ABSTRACT
PACHECO DOMINGUEZ, WILMER JAVIER. Effect of Particle Size and Inclusion Level of DDGS, and Pellet Quality on Nutrient Digestibility, Gastrointestinal Development, and Live Performance of Broilers and Swine. (Under the direction of Drs. John Brake and Peter Ferket).
Distillers dried grains with solubles (DDGS) is the co-product that remains after
fermenting the starch fraction of grains to produce ethanol. Previous research studies have
shown that the main limitations for using DDGS in poultry and swine diets were reduced
pellet quality and increased nutrient variability. Our working hypothesis was that further
grinding of DDGS would improve pellet quality and live performance in poultry and swine
and that the optimum dietary inclusion would depend upon feed formulation strategies. The
first study (Chapter 2) was designed to evaluate the effect of inclusion level and particle size
of DDGS as well as soybean meal (SBM) particle size on pellet durability index (PDI). Diets
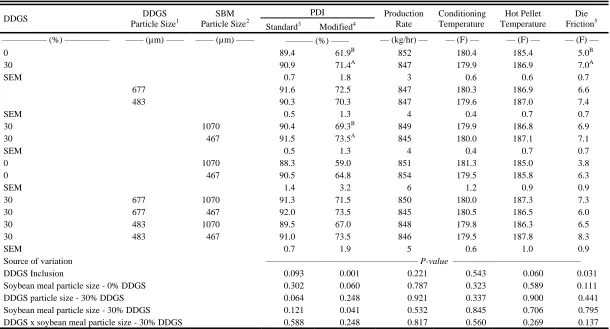
containing DDGS exhibited improved (P≤0.05) PDI relative to diets without DDGS. Further
grinding of SBM in diets with DDGS also improved (P≤0.05) PDI. Adding 30% DDGS to
corn-soy diets improved PDI and further grinding of SBM, but not DDGS, improved pellet
quality.
The second study (Chapter 3) evaluated the effect of particle size and DDGS
inclusion on pellet quality and live performance of broilers fed diets formulated on a
digestible amino acid (AA) basis. Birds fed diets with fine DDGS consumed more feed
(P≤0.05) and exhibited greater BW (P≤0.05) at 42 d than birds fed diets with coarse DDGS
with no difference in feed efficiency. Birds fed pelleted diets with fines removed exhibited
containing 30% DDGS consumed more feed (P≤0.05) but exhibited poorer feed efficiency
(P≤0.05) at 42 d than birds fed 15% DDGS with no differences in BW. The results observed
on this experiment demonstrated that broilers exhibited improved live performance when fed
finely ground DDGS (482 µm) with no fines in the feed and that up to 30% DDGS could be
fed when diets were formulated on a digestible AA basis.
The third study (Chapter 4) evaluated the effect of dietary DDGS inclusion and the
method of crude fat analysis on pellet quality, nutrient digestibility, incidence of footpad
lesions, and broiler live performance in diets formulated on a total AA basis. Increasing
dietary inclusion of DDGS to 30% reduced pellet quality, BW, and protein digestibility as
well as increased footpad lesions. Feed efficiency was also poorer. Evidently, broilers can be
fed up to 15% DDGS in diets formulated on total AA basis while the method of estimating
crude fat had a marginal effect on live performance.
The final experiment (Chapter 5) evaluated the effect of DDGS particle size and
percentage fines on grower-finisher pig performance. Particle size of DDGS and percentage
fines in the feed did not impact (P≥0.05) daily gain, daily feed intake, or feed efficiency. It
was determined that the particle size of DDGS did not improve overall live performance so
DDGS did not need to be further ground upon receipt at the feed mill. In addition, up to 25%
pellet fines could be fed without affecting grower-finisher pig performance.
Based on the results of these 4 studies, it was concluded that: (1) further grinding
DDGS did not influence pellet quality and grower-finisher pig live performance; (2) grinding
grower-finisher pigs without adverse effects on live performance; (4) and use of digestible
© Copyright 2014 Wilmer J. Pacheco Dominguez
Effect of Particle Size, DDGS Inclusion, and Pellet Quality on Nutrient Digestibility, Gastrointestinal Development, and Live Performance of Broilers and Swine
by
Wilmer Javier Pacheco Dominguez
A dissertation submitted to the Graduate Faculty of North Carolina State University
in partial fulfillment of the requirements for the Degree of
Doctor of Philosophy
Physiology and Nutrition
Raleigh, North Carolina
2014
APPROVED BY:
_______________________________ ______________________________
John T. Brake, Ph.D. Peter R. Ferket, Ph.D.
Co-chair Co-chair
________________________________ ________________________________
DEDICATION
To
God who strengthens me in times of weakness
My dear family; my mother Juana (QDDG), my father Virgilio, my brothers; Johnny, Hector,
Jorge, Rodolfo, Virgilio, Rodilio, Antonio (QDDG),
and my sisters; Lina (QDDG), and Lessy.
My beloved girlfriend Indira Medina.
All my friends who made this journey an enjoyable one.
BIOGRAPHY
Wilmer J. Pacheco was born in Las Vegas, Santa Barbara, Honduras, on June 9th,
1983. He spent the first years of his life studying in this small town in the mountains of
Honduras. During his childhood he collaborated in the farm activities helping his father to
grow corn and beans. After elementary school, he moved to San Pedro Sula where he studied
in the Honduran-German Technical Center where he learned the general concepts of
maintenance of industrial machines. In 2002, he was granted a scholarship to study in the
Pan-american school of agriculture (Zamorano), which is one of the most prestigious
agricultural schools in the area. At Zamorano, he was trained in areas related to food
technology with specialization in processing of dairy and meat products. After his graduation
from Zamorano he moved to Laurinburg, NC, where he started a manager trainee program
with Murphy Brown. The two main reasons for leaving his country were to learn the English
language and to pursue higher education degree in a US university. After one year in the
training program he was promoted as night shift supervisor and was the responsible to
oversee the production of approximately 10,000 tons of pelleted feed per week. In 2009, he
was granted a research assistantship in the Department of Poultry Science at North Carolina
State University (NCSU). At NCSU, Wilmer has focused on the interrelationships between
feed milling, nutrition, and physiology in poultry and swine. He is also a member of a team
ACKNOWLEDGMENTS
I would like to thank my advisory committee Dr. John Brake, Dr. Peter Ferket, Dr. Charles
Stark, Dr. Mark Knauer, and Dr. Vernon Felts as well as Dr. Adam Fahrenholz for their
support and advice. A special appreciation is expressed to Dr. Charles Stark for giving me
the opportunity to come to the U.S. initially to work with Murphy Brown and then for
accepting me as his graduate student. I would like to express my sincere gratitude to Dr. John
Brake and Dr. Peter Ferket for being excellent mentors, friends, and advisors. I would like to
express my most sincere gratitude to Dr. Diego Bohorquez and Dr. Leonel Mejia for having
encouraged me to continue with my studies and for their continual support through my years
as graduate student. Thanks to my beloved girlfriend Indira Medina for her unconditional
love and support. Thanks to the graduate students in the Poultry and Animal Science
Departments Manuel Costa, Marcelo Dalmagro, Basheer, Satid, Amy, Marissa, Coltin,
Ayuub, Ilana, Rasha, Frank, David Rosero, Michael Shields, Santa Maria Mendoza, Oswaldo
Medina, Tiago Pasquetti and others for their friendship and for making my time at NC State
an unforgettable experience. Thanks to the feed mill manager Shawn Bradshaw, the farm
crew Terry, Lory, and Scott as well as all the undergraduates students that assisted me during
TABLE OF CONTENTS
LIST OF TABLES ... x
LIST OF FIGURES... xii
CHAPTER I. LITERATURE REVIEW... 1
1.1. INTRODUCTION... 2
1.2. CORN STRUCTURE AND COMPOSITION... 4
1.3. ETHANOL PRODUCTION... 6
1.3.1. Grain receiving... 8
1.3.2. Grinding... 8
1.3.3. Cooking and liquefaction... 9
1.3.4. Saccharification and fermentation... 10
1.3.5. Distillation and further co-product processing... 11
1.4. DDGS IN ANIMAL NUTRITION... 12
1.4.1. Nutrient variability of DDGS... 13
1.4.2. Amino acid content and digestibility of DDGS... 17
1.4.3. Metabolizable energy level of DDGS... 19
1.4.4. Flow and storage of DDGS... 20
1.5. PELLETING... 22
1.5.1. Measuring pellet quality... 24
1.5.2. Pellet quality and feed mill efficiency... 25
1.6. PARTICLE SIZE REDUCTION... 26
1.8. REFERENCES... 32
CHAPTER II. EFFECT OF FURTHER GRINDING DDGS AND SBM ON PELLET QUALITY IN SWINE DIETS... 47
2.1. ABSTRACT... 48
2.2. INTRODUCTION... 49
2.3. MATERIAL AND METHODS... 51
2.3.1. Diets... 51
2.3.2. Data collection and laboratory analyses... 52
2.3.2. Statistical analyses... 53
2.4. RESULTS AND DISCUSSION... 54
2.5. TABLES AND FIGURES... 58
2.6. REFERENCES... 64
CHAPTER III. EFFECT OF PARTICLE SIZE, DDGS INCLUSION, AND PELLET QUALITY ON BROILER LIVE PERFORMANCE AND GASTROINTESTINAL DEVELOPMENT... 68
3.1. ABSTRACT... 69
3.2. INTRODUCTION... 70
3.3. MATERIAL AND METHODS... 72
3.3.1. DDGS analyses... 72
3.3.2. Diets... 72
3.3.3. Bird husbandry... 73
3.3.4. Data collection and laboratory analyses... 74
3.3.6. Statistical analyses... 76
3.4. RESULTS AND DISCUSSION... 76
3.4.1. Feed manufacturing... 76
3.4.2. Broiler live performance... 77
3.4.3. Organ development... 79
3.4.4. Nitrogen and energy digestibility... 80
3.5. TABLES AND FIGURES... 82
3.6. REFERENCES... 89
CHAPTER IV. EFFECT OF INCLUSION LEVEL AND METHOD OF ANALYSIS FOR CRUDE FAT OF DDGS ON NUTRIENT DIGESTIBILITY, FOOTPAD LESIONS, AND BROILER LIVE PERFORMANCE DEVELOPMENT... 95
4.1. ABSTRACT... 96
4.2. INTRODUCTION... 97
4.3. MATERIAL AND METHODS... 99
4.3.1. DDGS analyses... 99
4.3.2. Diets... 99
4.3.3. Bird husbandry... 100
4.3.4. Data collection and laboratory analyses... 101
4.3.5. Ileal analyses... 103
4.3.6. Statistical analyses... 103
4.4. RESULTS AND DISCUSSION... 104
4.4.1. Feed manufacturing... 104
4.4.3. Nutrient digestibility and footpad lesions... 108
4.5. TABLES AND FIGURES... 110
4.6. REFERENCES... 117
CHAPTER V. EFFECT OF DDGS PARTICLE SIZE AND PELLET QUALITY ON GROWER-FINISHER PIG PERFORMANCE... 121
5.1. ABSTRACT... 122
5.2. INTRODUCTION... 123
5.3. MATERIAL AND METHODS... 124
5.3.1. Diets... 124
5.3.2. Animal husbandry... 125
5.3.3. Data collection and laboratory analyses... 127
5.3.4. Statistical analyses... 128
5.4. RESULTS AND DISCUSSION... 128
5.4.1. Feed manufacturing... 128
5.4.2. Swine performance... 130
5.5. TABLES AND FIGURES... 133
5.6. REFERENCES... 141
CHAPTER VI. INTEGRATION OF CONCEPTS AND FINDINGS FROM RESEARCH STUDIES... 145
6.1. INTRODUCTION... 146
6.2. EFFECTS OF DDGS INCLUSION ON PELLET QUALITY... 147
6.4. EFFECT OF PERCENTAGE PELLET FINES ON BROILER AND SWINE LIVE PERFORMANCE... 150
6.5. MAXIMUM INCLUSION OF DDGS BASED UPON FORMULATION
STRATEGIES... 151
LIST OF TABLES CHAPTER I
Table 1. Average proximate composition of corn (% dry matter)... 3
Table 2. Average nutrient composition of DDGS from ethanol plants... 15
Table 3. Comparison of gross energy (GE), DE, and ME estimates among DDGS sources in pig diets ... 17
Table 4. The stepwise regression equation to predict amino acid levels based on the proximate values of moisture, crude protein (CP), fat, and fiber ... 18
CHAPTER II
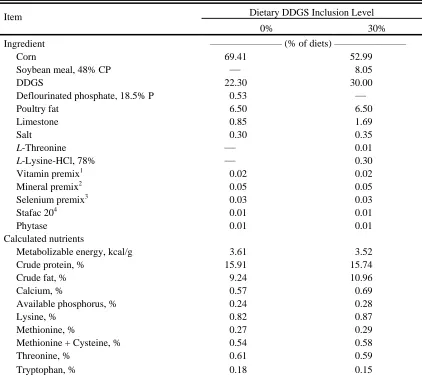
Table 1. Composition and calculated contents of the experimental diets (% as fed basis)... 58
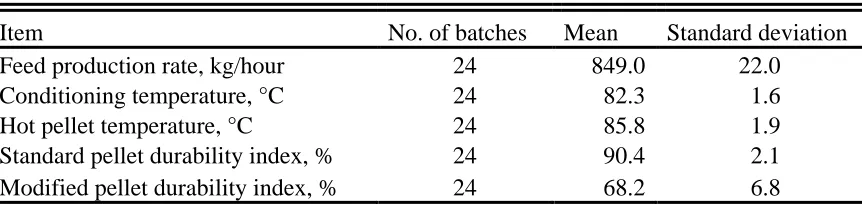
Table 2. Descriptive statistics of the experimental diet... 59
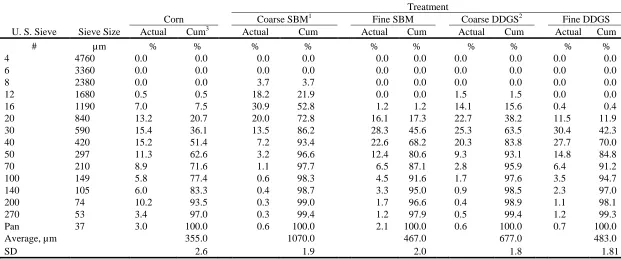
Table 3. Particle size distribution of corn, soybean meal, and DDGS ... 60
Table 4. Effect of particle size and inclusion of DDGS on pellet durability index (PDI) and feed production rate ... 61
CHAPTER III
Table 1. Determined and calculated chemical composition of the distillers dried grain with solubles (DDGS) (% as-fed basis, unless stated otherwise) as received from the supplier... 82
Table 2. Composition and calculated contents of the experimental diets (% as fed basis)... 83
Table 3. Effect of particle size and DDGS inclusion on pellet durability index (PDI) and feed pellet production rate... 84
Table 4. Effect of particle size, DDGS inclusion, and percentage feed fines on BW, feed intake, and feed conversion ratio (FCR) of broilers from 1 to 42 d of age………... 85
Table 6. Effect of particle size, DDGS inclusion, and percentage feed fines on nitrogen (N), crude protein (CP), and energy utilization (AME, AMEn, and GE) of male broilers from 1 to 42 d of age ... 87
CHAPTER IV
Table 1. Composition and calculated contents of the experimental diets (% as fed basis)... 110
Table 2. Effect of inclusion level and metabolizable energy value of DDGS on pellet durability index (PDI) and pellet production rate... 111
Table 3. Effect of inclusion level and metabolizable energy value of DDGS on BW, feed intake, and feed conversion ratio (FCR) of broilers from 1 to 49 d of age... 112
Table 4. Effect of inclusion level and metabolizable energy value of DDGS on protein, fat digestibility, and footpad lesion score at 49 d of age... 113
CHAPTER V
Table 1. Determined and calculated chemical composition of the distillers dried grain with solubles (DDGS) (% as-fed basis, unless stated otherwise) as received from the supplier... 133
Table 2. Composition and calculated contents of the grower, developer, and finisher diets (% as fed basis)... 134
Table 3. Particle size distribution of the distillers dried grains with solubles (DDGS) used during the experiment... 135
Table 4. Descriptive statistics for pellet quality... 136
Table 5. Effect of the particle size of distillers dried grain with solubles (DDGS) on percentage fines and standard and modified pellet durability index (PDI)... 137
Table 6. Descriptive statistics for pig live performance... 138
Table 7. Effect of the particle size of distillers dried grains with solubles (DDGS) and percentage pellet fines on body weight of grower-finisher pigs... 139
LIST OF FIGURES CHAPTER I
Figure 1. Corn production by county and location of ethanol plants in USA ... 4
Figure 2. Components of the corn kernel ... 6
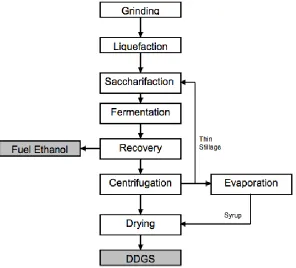
Figure 3. Overview of dry grind process of ethanol production ... 12
CHAPTER II
Figure 1. Average particle size and particle size distribution of soybean meal used in swine finishing diets as received (coarse-1070 µm) and after grinding (fine-467 µm) in a hammermill equipped with a 1.6 mm screen ... 62
Figure 2. Average particle size and particle size distribution of DDGS used in swine finishing diets as received (coarse-677 µm) and after grinding (fine-483 µm) in a hammermill equipped with a 1.6 mm screen ... 63
CHAPTER III
Figure 1. Average particle size and particle size distribution of DDGS used in broiler diets during the grower period as received (coarse-745 µm) and after grinding (fine-482 µm) in a hammermill equipped with a 1.6 mm screen... 88
CHAPTER IV
Figure 1. Relationship between pellet durability index (PDI) and amount of fat added in the mixer in grower diets containing 0, 15, and 30% DDGS analyzed by two methods of crude fat analysis (Acid hydrolysis (AH)-method 154.02 and ether extract (EE)-method 990.03; AOAC, 2006))... 114
Figure 2. Relationship between pellet durability index (PDI) and amount of fat added in the mixer in finisher diets containing 0, 15, and 30% DDGS analyzed by two methods of crude fat analysis (Acid hydrolysis (AH)-method 154.02 and ether extract (EE)-method 990.03; AOAC, 2006))... 115
CHAPTER I
1.1. INTRODUCTION
The increased usage of animal feed ingredients as raw materials for the production of
ethanol has increased U.S. production of biofuels by 82% from 2000 to 2008 (Schmidt et al.,
2012). Increased ethanol production has resulted into increased production of distillers dried
grains with solubles (DDGS) (Shurson, 2003). Distillers dried grains have been produced
after fermenting the starch fraction of grains to produce ethanol and have become the main
co-product of the ethanol and beverage industries. The residues that have remained after
fermentation have been termed “distillers wet grains or whole stillage” and have been
blended with the “condensed distillers solubles” (CDS, also know as syrup) to produce the
final DDGS. If the whole stillage was dried without adding the solubles, the product was
called distillers dried grains (DDG) (Pahm et al., 2008a).
Condensed distillers solubles has been reported to contain high levels of vitamins, fat,
and protein with low levels of fiber, and have yielded around 91% of the digestible energy
value of corn (Cruz et al., 2005). The DDGS have contained mainly the non-fermentable
components of the grains used to produce ethanol, but since the fermentation has not been
100% efficient, DDGS has also contained some residual sugars (Spiehs et al., 2002; Belyea
et al., 2004; Singh et al., 2005). Therefore, DDGS has become a valuable source of energy,
protein, water-soluble vitamins, and minerals (Batal and Dale, 2006; Ganesan et al., 2009;
Shalash et al., 2009) in poultry and swine diets.
Corn has been the major feed ingredient used for ethanol production and has
accounted for approximately 97% of the total grains used, followed by sorghum, which has
beverage production (Nichols and Bothast, 2008). The choice to use a particular ingredient
has depended upon the geographical location, costs, and availability among other factors.
Most ethanol plants have been concentrated in the Midwest and north-central portions of the
United States, where most of the corn has been produced (Figure 1). However, in recent
years ethanol facilities have been built in other states closer to the ethanol markets.
On a dry matter basis the corn kernel has been reported to contain approximately 75%
starch, 8.9% protein, 4.0% oil, 1.5% ash, 1.7% simple sugars, and 8.9% fiber (Watson,
2003), but since most of the starch has been fermented to produce ethanol the remaining
non-fermentable nutrients became concentrated about three-fold in the DDGS.
Table 1. Average proximate composition of corn (% dry matter)
Component Starch Fat Protein Ash Sugar Fiber
Whole Kernel 73.4 4.4 9.1 1.4 1.9 9.5
Kernel Fractions ———————————— (%) ————————————
Endosperm 98.1 15.4 73.3 17.9 28.6 27.00
Germ 1.5 82.6 26.2 78.4 69.3 16.00
Pericarp 0.6 1.3 2.6 2.9 1.2 51.00
Tip Cap 0.1 0.8 0.9 1.0 0.8 0.01
Source: USDA, 2012.
Figure 1. Corn production by county and location of ethanol plants in USA.
1.2. CORN STRUCTURE AND COMPOSITION
The kernel has been described as being comprised of pericarp, endosperm, germ, and
tip cap (Singh et al., 2007) (Figure 2). The pericarp was the seed coat that covered the corn
kernel and served to protect and support the growing endosperm and embryo during seed
development. The part of the hull overlying the embryo was known as the tip cap, which was
the attachment point to the cob (Kent and Evers, 1994). The endosperm was the largest
contained large amounts of starch and storage proteins (Watson, 1994; Reyes et al., 2011).
The nutrients in the endosperm were mobilized to support growth of the embryonic axis at
the onset of germination (Fincher, 1989). Starch has been found to be the most abundant
carbohydrate in corn and the main form of stored energy (Liu, 2012). In the production of
ethanol, starch has been the key component as it has been converted into glucose molecules,
which could be fermented to produce ethanol and CO2 (Bothast and Schlicher, 2005). In
addition, the endosperm contained around 6.9-10.4% protein stored in the endoplasmic
reticulum (Earle et al., 1946).
The aleurone tissue was reported to be a layer of single cells found just below the
pericarp and surrounding the starchy endosperm (Kent and Evers, 1994). Aleurone cells
exhibited high concentrations of proteins, lipids, vitamins, and minerals and provided sites
for synthesis and secretion of alpha amylase and a range of hydrolytic enzymes responsible
for solubilizing of the energy reserves of the grain at the onset of germination (Baulcombe et
al., 1984; Liu, 2012). Contrasted to the starchy endosperm, aleurone cells accumulated their
proteins inside vacuoles instead of the endoplasmic reticulum (Reyes et al., 2011).
The germ or embryo has been described as comprising between 8 – 10% of the dry
weight of the kernel and contained protein, oil, as well as starch (Watson, 1994).
Approximately 83% of the fat and 26% of the protein of the corn kernel were contained in
the germ (Earle et al., 1946). Indeed, there has been a positive correlation between the
percentage embryo and the lipid content of the corn kernel (Hopkins et al., 1974).
Proteins in corn have been classified based on their solubility with albumins soluble
glutelins soluble in acids (Shewry and Thatam, 1990). Albumins and globulins were
concentrated in germ, aleurone, and pericarp with small amounts found in the endosperm
(Hoseney, 1994). During the fermentation process to produce ethanol the proteins in the corn
have typically remained unchanged and have become concentrated around three-fold in the
DDGS. Therefore, if the initial protein content in the corn was 9%, the final DDGS contained
approximately 27% protein. In addition, lipids exhibited minimal change during the
fermentation process and have ended up mostly in the DDGS.
Figure 2. Components of the corn kernel (U.S. Grains Council, 2011).
1.3. ETHANOL PRODUCTION
At the time of this writing the USA had 211 ethanol facilities and more than 90% of
them used corn as their ingredient (RFA, 2014). Indeed, approximately 27.3% of corn
produced in the U.S. was diverted to ethanol production (National Corn Growers
and dry grinding (Rausch and Belyea, 2006). The wet milling process required high capital
investment, was required to process large quantities of corn, and produced large volumes of
ethanol and co-products to justify production costs (Belyea et al., 2004). In wet milling, corn
was fractionated into its components, which included starch, fiber, gluten, and germ (Bothast
and Schlicher, 2005). The starch was then converted into simple sugars and used to produce
glucose, dextrose, high fructose corn or ethanol by yeast fermentation. The germ was
de-oiled to produce corn oil or dehydrated to produce germ meal. Proteins were also
concentrated and used mainly in feeds for non-ruminants and companion animals (Raush and
Belyea, 2006). The wet milling industry had greater flexibility due to the amount of
co-products produced (Bothast and Schlicher, 2005).
The most popular process recently used to produce ethanol in the USA has been
recently the dry grind process (Figure 3), which has accounted for over 80% of the total
ethanol production (RFA, 2009). In dry grind processing, the corn kernel was ground into a
coarse flour of around 600 µm in particle size without fractionating. Dry-grind facilities
required less equipment and were less capital intensive, but fewer co-products were produced
than the wet milling process (Raush and Belyea, 2006). In both processes, unfermented
nutrients (protein, fiber, and minerals) were converted into DDGS. Dry grind ethanol
manufacturing has typically resulted in three main products that included ethanol, DDGS,
and carbon dioxide (CO2). As a rule of thumb, for every bushel of corn (~56 lbs; 25.4 kg)
approximately 2.8 gallons of ethanol (8.2 kg), 18 lbs (8.2 kg) of DDGS, and roughly 18 lbs
(8.2 kg) of CO2 were produced. Dry grinding consisted of several key steps including grain
simultaneous saccharification and fermentation), distillation, and co-product recovery (Naidu
et al., 2007; Liu, 2009).
1.3.1. Grain Receiving
Corn was typically delivered into the ethanol plant by truck or by rail. Before
unloading, the grain was sampled and tested for mycotoxins, moisture, foreign material, and
mold damage. Mycotoxin levels were monitored carefully as these typically became
concentrated by approximately three fold in DDGS (Bothast et al., 1992; Bennett and
Richard, 1996; Zhang et al., 2009). This has been a major concern because mycotoxins have
been reported to significantly decrease the performance of poultry and swine species (Doerr
et al., 1983; Verma et al., 2004; Verma et al., 2007). After testing, the grain was dumped into
an underground receiving pit and sent to the grain storage area.
1.3.2. Grinding
The purpose of grinding was to reduce particle size and facilitate water penetration
during the cooking process. The whole kernel was ground by passing it through hammermills
equipped with screens with relatively small openings of approximately 3.2–4.8 mm diameter
(Bothast and Schlicher, 2005) or through roller mills with one or two sets of rolls. Grinding
also increased the surface area of the starch substrate particles available to enzymes and yeast
in the subsequent ethanol production steps. Although roller mills were more energy efficient
than hammermills and tended to produce more uniform particles with fewer fines, roller mills
were not often used in ethanol plants as they had higher initial costs of installation (Koch,
throughput capacity and efficiency. The particles produced with a hammermill were
generally spherical and their distribution varied widely with mostly small particles and some
large particles (Koch, 2002). The resulting average particle size and distribution was affected
by a number of factors such as screen size, hammer tip speed, number of hammers, air
assisted equipment, roll openings, moisture content, sharpness of the hammers, size and
integrity of the screens, presence of foreign material among others (Dupin et al., 1997).
Particle size and particle size distribution were reported to affect ethanol yield and the final
nutritional composition of the DDGS (Kelsall and Lyons, 2003; Naidu et al., 2007). In fact,
Kelsall and Lyons (1999) reported that by reducing the screen size of the hammermill from 8
mm to 5 mm, there was an increase in the ethanol yield from 2.45 to 2.65 gallons per bushel
(~ 56 lbs) of corn.
1.3.3. Cooking and Liquefaction
After grinding, corn flour was mixed with water and recycled stillage to form slurry
with approximately 30% solids (Rosentrater et al., 2012). This process initiated the
separation of soluble proteins from non-starch bound lipids and sugars. The slurry was
pumped into a cooking system (jet cooker) where it was heated to temperatures of 110-150ºC
using pressurized steam. Cooking sterilized the mash, broke down the crystalline structure of
the starch granules as well as the chemical bonds between proteins and sugars, initiated
starch gelatinization, and reduced the viscosity of the slurry (Kelsall and Lyons, 2003;
Rosentrater et al., 2012). During the cooking process, the pH was adjusted to between 5.5
acid producing bacteria in the grain, which have been reported to negatively affect ethanol
production by reducing the pH of the medium and creating an unfavorable environment for
yeast (Makanjuola et al., 1992; Huang et al., 1996; Franchi et al., 2003; Graves et al., 2006).
After cooking, the slurry was sent to a liquefaction tank where it was cooled to
around 60ºC. Gelatinization of the starch occurred at temperatures between 50 to 70ºC and
was controlled by the addition of amylolytic enzymes at a rate of between 0.04 and 0.08%.
The rate of starch gelatinization influenced the extent of conversion of starch into glucose
chains in the subsequent steps (Lin and Tanaka, 2006)
1.3.4. Saccharification and Fermentation
During the saccharification step α-amylase was added to degrade starch polymers into
short chain molecules and form a mash. The addition of amylolytic enzymes accounted for
around 10-20% of the total ethanol production costs (Gregg et al., 1998). Once the starch was
cleaved into small dextrins, the mixture was sent to a fermentation tank. Residence times in
the fermentation tank ranged from 40 to 72 h, depending upon the temperature and initial
particle size of the grains. Since particle size greatly influenced the fermentation efficiency,
ethanol facilities have reduced the particle size of the flour in order to increase the ethanol
yield. Glucoamylase and yeast (Saccharomyces cerevisiae) were added in the fermentation
tank where glucoamylase hydrolyzed the α-1,4 and α-1,6 bonds in dextrins into glucose and
1.3.5. Distillation and Further Co-products Processing
At the end of fermentation the product was termed “beer” and contained around 12%
ethanol. The beer was stored in a tank called a “beer well” until transferred to distillation
columns where the ethanol was separated from the whole stillage (non-fermented solids of
corn, yeast, and water). The separation of the water and ethanol was accomplished by the use
of a rectifier column that produced 190-proof ethanol (95%), which was then sent to a
molecular sieve column and converted to 200-proof ethanol (100%).
The whole stillage with 13 to 17% solids (protein, minerals, fiber, fat, etc.) was
withdrawn from the bottom of the distillation unit and centrifuged to produce wet cake and
thin stillage (Raush and Belyea, 2006). The wet cake, which was a more concentrated form
of whole stillage, contained between 35 to 50% solids. The thin stillage that contained
between 5 to 10% solids was sent through an evaporator where solids were concentrated into
syrup that contained 25 to 55% solids. The syrup was subsequently blended with the wet
cake before entering the drier. The mixture of wet cake and syrup was dried to generate the
DDGS, which typically contained 31.3% crude protein, 11.9% crude fat, 10.2% fiber, and
4.6% ash (Belyea et al., 2004). On a dry matter basis 100 kg corn has typically yielded 70 kg
starch, which produced 77.8 kg of glucose. The glucose was subsequently fermented to
produce 39.8 kg of ethanol and 38.0 kg of carbon dioxide (Maisch, 2003). Quality control
procedures have assured consistency in the amount of protein, fat, fiber, and moisture as well
Figure 3. Overview of dry grind process of ethanol production. Reproduced from Nichols et al. (2006).
1.4. DDGS IN ANIMAL NUTRITION
Distillers dried grains with solubles was not typically included in poultry and swine diets, but increased production of ethanol increased the supply of DDGS while decreasing the
supply of corn and encouraged the use of higher percentages of DDGS in livestock diets
(Waldroup, 2007). As the usage of DDGS increased, there was the necessity to study the
maximum inclusion of DDGS that could be fed without affecting animal performance,
animal welfare, and feed efficiency. Recently, there has been an abundance of research to
precisely determine the nutrient content of DDGS in order to take full advantage of its value
DDGS could be included in broiler starter diets and 12 to 15% in grower and finisher diets.
In another study, Loar et al. (2010) reported that 8% DDGS could be included from 0 to 14 d
of age and 15% from 14 to 42 d of age without adverse effects on broiler live performance
and feed efficiency. In diets for commercial layers approximately 10-12% could be fed
without affecting egg production (Lumpkins et al., 2005). The maximum inclusion of DDGS
has been influenced by the methodology used during feed formulation. If the metabolizable
energy (ME) content of diets was maintained constant by the addition of supplemental fat, up
to 25% DDGS could be used without adverse effects on live performance and feed efficiency
(Waldroup et al., 1981), but if the ME was allowed to decline as the inclusion of DDGS
increased, only 15% could be fed. Some concerns regarding DDGS usage were related to
nutrient variability, particularly when high levels were used (Noll et al., 2007b). The major
concerns were variation in ME content, bioavailability of amino acids such as lysine,
bioavailability of phosphorus, and variation in sodium content (Waldroup et al., 2007). From
the feed milling perspective, the major concerns were related to poor ingredient flow
characteristics and decreased pellet quality. Therefore, it has become essential to precisely
know the nutritional value and pelleting characteristics of DDGS in order to utilize this
ingredient effectively in poultry and swine diets.
1.4.1. Nutrient Variability of DDGS
The nutrient content of DDGS has varied considerably from different sources (Spiehs
et al., 2002; Belyea et al., 2010; Liu, 2008). Many factors have been found to influence
content (Singh and Graeber, 2005; Sharma et al., 2007), location of the ethanol plant
(Whitney et al., 2000; Fastinger and Mahan, 2006), type and amount of additives used during
fermentation, water quality, and concentration of solids (Rausch and Belyea, 2006) among
others. However, the main factor that influenced the nutrient content of DDGS was the
amount of distillers solubles (thin stillage) added to the whole stillage (Goodson and
Fontaine, 2004; Waldroup et al., 2007). Noll et al. (2007a) observed that as the amount of
thin stillage added to the whole stillage was increased, there was an increase in fat and ash
content in the final DDGS. In the same study, protein and amino acid content did not change
appreciably, but true amino acid digestibility coefficients were negatively correlated with
solubles addition, likely because a more severe heat treatment was required to decrease the
moisture level in the final DDGS. Heat treatment has been reported to deteriorate protein
quality by destroying heat-sensitive amino acids, particularly lysine. The Maillard reaction,
which is the most common type of heat damage, involves the reduction of the ε-NH2 group
of lysine with a carbonyl group of a reducing sugar (Pahm et al., 2008a). Previous research
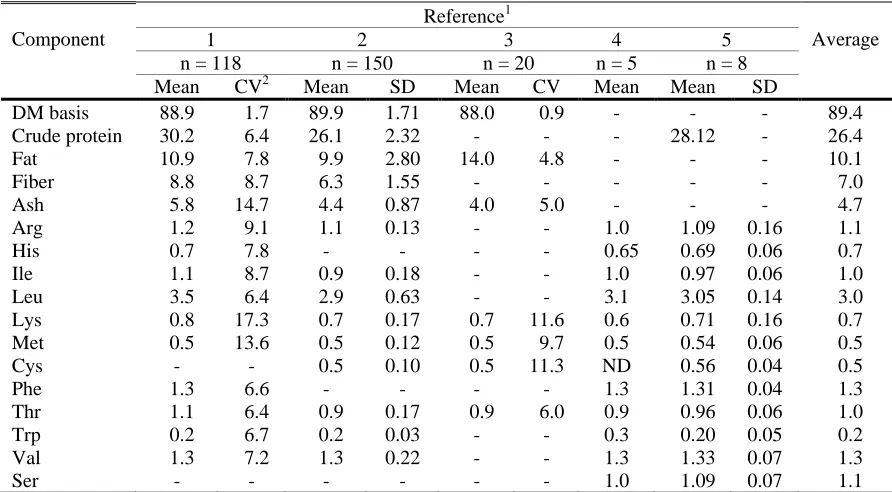
demonstrated that the components of DDGS with the highest nutritional variation were crude
fiber, ADF, NDF, ash, phosphorus, and lysine (Table 2).
There has been a considerable variability in many of the essential nutrients in DDGS,
particularly with regards to certain amino acids such as arginine, leucine, and lysine.
According to Waldroup el at. (2007), corn itself has varied in nutrient content and since the
nutrients in corn other than starch became concentrated in DDGS about three fold, any
variation in corn would exacerbate the nutrient variability in the DDGS. The swine industry
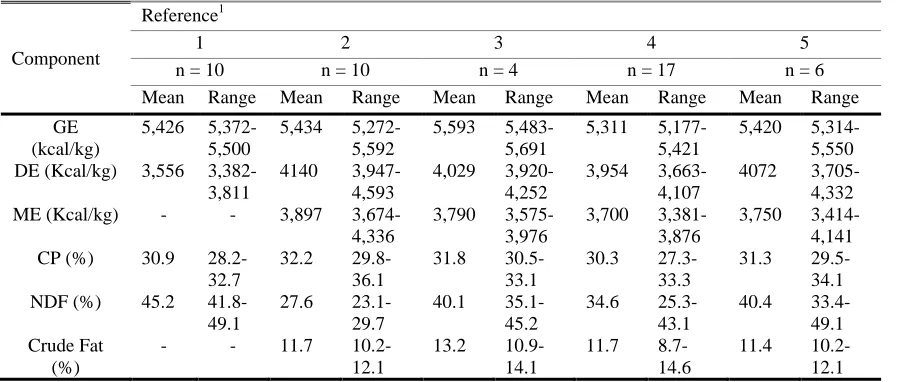
of various DDGS sources (Stein et al., 2006; Pedersen et al. 2007; Stein et al., 2009;
Mendoza et al., 2010; Anderson et al. 2011) (Table 3). The average ME value of DDGS has
been approximately 96% of the value of corn, but has ranged from 88.9 to 105.7% (Shurson,
2007), depending particularly upon the level of crude fat.
Table 2. Average nutrient composition of DDGS from ethanol plants.
Component
Reference1
Average
1 2 3 4 5
n = 118 n = 150 n = 20 n = 5 n = 8 Mean CV2 Mean SD Mean CV Mean Mean SD
DM basis 88.9 1.7 89.9 1.71 88.0 0.9 - - - 89.4 Crude protein 30.2 6.4 26.1 2.32 - - - 28.12 - 26.4 Fat 10.9 7.8 9.9 2.80 14.0 4.8 - - - 10.1 Fiber 8.8 8.7 6.3 1.55 - - - 7.0 Ash 5.8 14.7 4.4 0.87 4.0 5.0 - - - 4.7 Arg 1.2 9.1 1.1 0.13 - - 1.0 1.09 0.16 1.1 His 0.7 7.8 - - - - 0.65 0.69 0.06 0.7 Ile 1.1 8.7 0.9 0.18 - - 1.0 0.97 0.06 1.0 Leu 3.5 6.4 2.9 0.63 - - 3.1 3.05 0.14 3.0 Lys 0.8 17.3 0.7 0.17 0.7 11.6 0.6 0.71 0.16 0.7 Met 0.5 13.6 0.5 0.12 0.5 9.7 0.5 0.54 0.06 0.5 Cys - - 0.5 0.10 0.5 11.3 ND 0.56 0.04 0.5 Phe 1.3 6.6 - - - - 1.3 1.31 0.04 1.3 Thr 1.1 6.4 0.9 0.17 0.9 6.0 0.9 0.96 0.06 1.0 Trp 0.2 6.7 0.2 0.03 - - 0.3 0.20 0.05 0.2 Val 1.3 7.2 1.3 0.22 - - 1.3 1.33 0.07 1.3
Ser - - - 1.0 1.09 0.07 1.1
1
1 = Spiehs et al. (2002); 2 = Fiene et al. (2006); 3 = Parsons et al. (2006); 4 = Fastinger et al. (2006); Batal and Dale (2006).
In the USA more than 50% of the ethanol facilities have extracted the oil principally
from corn before producing the DDGS, which increased the variability of the crude fat
content and ME values in the final DDGS (U.S. Grains Council, 2011) and produced DDGS
a MEn of 1,975, 2,644, and 3,137 kcal/kg for low (6.06% ether extract (EE)), medium (8.80% EE), and high (11.59% EE) DDGS when fed to broilers from 21 to 30 d of age.
Prediction equations have been developed to estimate ME based on the chemical composition
(Batal and Dale, 2006; Cozannet et al., 2010). Although the use of prediction equations have
ameliorated the adverse consequences of nutrient variability between DDGS sources, the
ethanol industry did not have guidelines or recommendations regarding the most appropriate
analytical methods to measure the chemical composition of DDGS. This has led to confusion
and misinterpretation of data for proximate analysis and formulation issues regarding to the
ME values assigned to the nutrient matrix of DDGS. The American Feed Industry
Association (AFIA, 2007) conducted a study to evaluate the efficacy, applicability, and
variability (both intra and inter laboratory variation) of the most common methods used for
analysis of moisture/loss on drying, crude protein, crude fat, and crude fiber. The final
recommendations were based upon the coefficient of variation for both the intra and inter
laboratory variations. The recommended methods were NFTA 2.2.2.5 Lab Dry Matter (105
ºC/3 hr) for moisture analyses, AOAC 990.03 and AOAC 2001.11 for crude protein, AOAC
945.16 for ether extract, and AOAC 978.10 for crude fiber (AOAC, 2005). Nevertheless, the
influence of the variation in these methods has not been tested to determine their effect on the
Table 3. Comparison of gross energy (GE), DE, and ME estimates among DDGS sources in pig diets.
Component
Reference1
1 2 3 4 5
n = 10 n = 10 n = 4 n = 17 n = 6
Mean Range Mean Range Mean Range Mean Range Mean Range
GE (kcal/kg)
5,426 5,372-5,500
5,434 5,272-5,592
5,593 5,483-5,691
5,311 5,177-5,421
5,420 5,314-5,550 DE (Kcal/kg) 3,556
3,382-3,811
4140 3,947-4,593
4,029 3,920-4,252
3,954 3,663-4,107
4072 3,705-4,332 ME (Kcal/kg) - - 3,897
3,674-4,336
3,790 3,575-3,976
3,700 3,381-3,876
3,750 3,414-4,141 CP (%) 30.9
28.2-32.7
32.2 29.8-36.1
31.8 30.5-33.1
30.3 27.3-33.3
31.3 29.5-34.1 NDF (%) 45.2
41.8-49.1
27.6 23.1-29.7
40.1 35.1-45.2
34.6 25.3-43.1
40.4 33.4-49.1 Crude Fat
(%)
- - 11.7
10.2-12.1
13.2 10.9-14.1
11.7 8.7-14.6
11.4 10.2-12.1
1
1 = Stein et al. (2006); 2 = Pedersen et al. (2007); 3 = Stein et al. (2009); 4 = Mendoza et al. (2010); Anderson et al. (2011).
1.4.2. Amino Acid Content and Digestibility of DDGS
Poultry and swine nutritionists have been concerned not only with the variation in the
total amount of amino acids but also with variation in their digestibility, which has varied
depending upon the type and source of grain that has been used to produce the ethanol.
Nevertheless, studies have shown that variation has existed even in DDGS produced from the
same type of grain (Fastinger and Mahan, 2006; Pahm et al., 2008b). Lysine has been defined
as the first or second limiting amino acid in swine and poultry diets. Hence, its digestibility
has been a major concern when a high level of DDGS has been used (Noll et al., 2007b). The
digestibility of lysine in DDGS has usually been lower as compared to that in corn and SBM
During the drying process of DDGS, the material was exposed to high temperatures
increasing the Maillard reaction between lysine and reducing sugars (McGinnis and Evans,
1947; Warnick and Anderson, 1968; Cromwell et al., 1993). In one study, Fastinger and
Mahan (2005) reported DDGS to have an apparent ileal digestibility of lysine of only 27%,
which suggested that some sources of DDGS might be severely overheated. In a previous
study, Spiehs et al. (2002) measured the amino acids variability in DDGS and reported that
lysine exhibited the highest variability (CV = 17.3%) followed by methionine (CV = 13.6%).
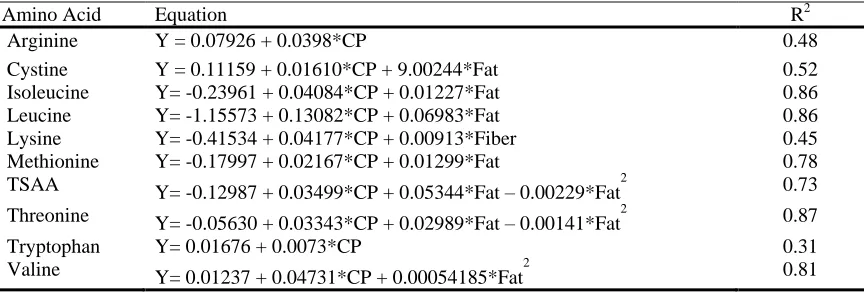
Table 4 shows regression equations used to predict total amino acid content of DDGS from
proximate analyses values that included moisture, crude protein, fat, and fiber.
Table 4. The stepwise regression equation to predict amino acid levels based on the proximate values of moisture, crude protein (CP), fat, and fiber.
Amino Acid Equation R2
Arginine Y = 0.07926 + 0.0398*CP 0.48
Cystine Y = 0.11159 + 0.01610*CP + 9.00244*Fat 0.52 Isoleucine Y= -0.23961 + 0.04084*CP + 0.01227*Fat 0.86 Leucine Y= -1.15573 + 0.13082*CP + 0.06983*Fat 0.86 Lysine Y= -0.41534 + 0.04177*CP + 0.00913*Fiber 0.45 Methionine Y= -0.17997 + 0.02167*CP + 0.01299*Fat 0.78 TSAA Y= -0.12987 + 0.03499*CP + 0.05344*Fat – 0.00229*Fat2 0.73 Threonine Y= -0.05630 + 0.03343*CP + 0.02989*Fat – 0.00141*Fat2 0.87
Tryptophan Y= 0.01676 + 0.0073*CP 0.31
Valine Y= 0.01237 + 0.04731*CP + 0.00054185*Fat2 0.81 Source = Fiene et al. (2006)
The amino acids above with high R2 values (Ile, Leu, Met, TSAA, and Val) were
predicted with most accuracy using the proximate analyses data. The use of color
been reported to have lower amino acid digestibility when compared with light colored
DDGS (Cromwell et al., 1993; Fastinger and Mahan, 2006).
Formulation decisions could also influence performance, especially if diets were
formulated on a crude protein basis rather than digestible amino acid basis. Shim et al. (2011)
conducted an experiment in which the diets were formulated on a digestible amino acid basis
and did not find statistical differences for BW gain, FCR, and mortality at 42 d of age in diets
containing 0, 8, 16, or 24% DDGS. In the study the authors utilized fixed formulation
minimums for Met, TSAA, Thr, Trp, Val, Ile, and Arg in order to maintain ideal digestible
amino acid ratios relative to Lys, hence protein level increased as the DDGS inclusion
increased in order to compensate the for the lower amino acid digestibility of DDGS as
compared to corn or SBM. In contrast, Lumpkins et al. (2004) formulated diets to a minimum
crude protein level and on a total amino acid basis and concluded that only 6% DDGS could
be safely used in starter diets followed by 12 to 15% in grower and finisher diets. According
to Shim et al. (2011), diets in earlier trials using DDGS were formulated using total amino
acids rather that digestible amino acids and minimum amino acids constraints were only set
for lysine, methionine, and TSAA.
1.4.3. Metabolizable Energy Levels of DDGS
Use of the correct ME level for DDGS during feed formulation has had a
considerable impact on the performance of poultry and swine (Fiene et al., 2006). Fastinger
et al. (2006) reported an average of 2,871 kcal/kg for five samples, which ranged from 2,484
metabolizable energy (TME) value of 2,820 ± 82 kcal/kg, with a range of 2,490 to 3,190
kcal/kg for 17 samples. The same authors applied regression analyses and developed
prediction equations to calculate the TMEn of DDGS based on its proximate composition
(fat, protein, fiber, and ash). The major differences between the samples were in crude fat
content with lower variability in fiber and ash content. The best single indicator for TMEn
was the fat content (R2 = 0.29) but the addition of second, third, and fourth variables (fiber,
protein, and ash) improved the accuracy of the prediction equation (R2 = 0.43, 0.44, and 0.45,
respectively). For swine diets, Spiehs et al. (2002) calculated the DE and ME to be 3,990 and
3,749 kcal/kg, respectively, which were also higher than NRC values, likely due to higher
crude fat content (NRC, 1998). Stein et al. (2006) reported an average DE of 3,556 kcal/kg
with a range of 3,382 to 3,811 kcal/kg of DM (Table 3).
1.4.4. Flow and Storage of DDGS
Storage and handling of DDGS was initially very troublesome due to its poor
flowability during loading and unloading into storage bins (AURI and MCGA, 2005;
Rosentrater, 2006; Bhadra et al., 2009). During shipping, DDGS often caked and bridged,
which decreased its flow characteristics in the feed mill and resulted in additional shipping
costs (Schlicher, 2005; Bhadra et al., 2009) because of increased labor, machinery, and time
required to unload and handle the material (Rock and Schwedes, 2005). The use of
anti-caking agents such as calcium carbonate, which were previously used to enhance flow of
SBM have not been not approved to be used in DDGS because there were questions
characteristics also led to damage of the railcars during unloading as sledgehammers were
frequently used to hit the cars and induce flow (Ganesan et al., 2009).
Strategies such as controlling the amount of condensed distillers solubles added to the
wet cake and controlling the drying process were proposed to reduce flowability problems
(Kleinschmit et al., 2006). According to Behnke (2007) storing the DDGS at the ethanol
facility for five to seven days or until moisture equilibration was completed increased the
flowability of DDGS. Bhadra et al. (2009) reported that flowability decreased as moisture
content of DDGS increased. In a more recent study, Bhadra et al. (2013) concluded that the
flowability problems of DDGS were primarily due to variability of temperature during drying
and quantity of condensed distillers added to the wet cake, with a lesser effect of cooling
temperature. Another approach to improve flowability and decrease caking was to pellet the
DDGS at the ethanol facility, however this approach could increase grinding costs at the
receiving feed mill (Behnke, 2007). Rosentrater (2007) conducted a study in which 100% of
DDGS were pelleted using a commercial pellet mill and he reported that pelleting did not
affect its nutritional value. In addition, Tumuluru et al. (2010) reported the effects of process
variables on pellet quality of wheat DDGS and reported a higher pellet density, lower pellet
moisture, and higher pellet durability at low initial moisture content of the DDGS in the
1.5. PELLETING
Pelleting was developed to force and shape bulk material through a die in order to
improve its physical characteristics and nutritional content (Kokić et al., 2013). As the
benefits of pelleting became more recognized in recent years, there has been an enormous
increase in the amount of feed that was pelleted by the swine and poultry industries (Zang et
al., 2009). Pelleting has been reported to be a combination of heat, friction, pressure, and
particle size reduction and has been shown to increase feed consumption (Abdollahi et al.,
2011), improve feed efficiency (Jensen, 2000), and increase BW (Frikha et al., 2009).
Pelleting has also been related to an improvement of dietary AME and apparent digestibility
of dry matter (Kilburn and Edwards, 2001; Svihus et al., 2004). The increased temperature
accomplished during pelleting has been shown to positively influence protein unfolding,
starch gelatinization, feed throughput, and pellet quality (Ravindran and Amerah, 2008).
Protein unfolding and partial denaturation of the native structure of protein has exposed
peptides linkages to enzymatic attack by endogenous proteases (Voragen et al., 1995;
Amerah et al., 2011). Heat treatment during pelleting has also increased starch gelatinization
to some extent. Gelatinization has been reported to increase the digestion and absorption of
the starch by enhancing its ability to absorb water and hence increased the speed at which the
amylolytic enzymes (endogenous and exogenous) disrupted the linkages of starch (alpha 1-4
and alpha 1-6) and converted it into simple sugars (Ravindran and Amerah, 2008).
In addition to increased starch gelatinization and protein denaturation, pelleting
improves performance and feed efficiency through decreased feed wastage and reduced
particularly as birds aged and became larger (Moran, 1982). Therefore, pelleting has
improved the likelihood of feeding a more uniform and balanced diet (Fahrenholz, 2012).
Pelleting has also improved performance by reducing the length of time and energy costs of
feeding periods. Poultry and swine have been reported to consume pelleted feed faster than
mash feed. In addition, Skoch et al. (1983) suggested that pelleting made the feed more
palatable by increasing its bulk density and by reducing dustiness, which increased feed
consumption and reduced time that the animals spent at the feeder. Indeed, Jensen et al.
(1962) reported that chicks fed mash diets spent 14.3% of their time at the feeder, while
chicks fed pelleted feed only spent 4.7%. Pelleting has improved performance efficiency
through decreased ingredient segregation, increased bulk density and reduced bridging
problems in bins. Agglomeration of the ingredients in the pellet enabled poultry and swine to
consume all ingredients and nutrients simultaneously and discouraged selective feeding.
Pelleting has also been reported to decrease nutrient segregation during transportation and
during storage in the bins (Behnke, 1994). Furthermore, pelleting has facilitated the inclusion
of ingredients with poor flowability characteristics (Stark, 2012).
Pelleted feed has allowed poultry and swine to consume their meals during their
limited time at the feeder. Behnke and Beyer (2002) reported that chicks fed pelleted diets
spend around 5% of their times eating at the feeder as compared to 15% for chicks fed mash
diets. Under conditions of ad libitum feeding, the total rate of growth was the major
determinant of feed efficiency as it resulted in a reduction in daily maintenance costs that use
feed and water without yielding product in terms of eggs, meat, etc. A chicken or pig
growing more rapidly, but would produce less meat to counteract the fixed cost of
maintenance (Kleyn, 2013).
1.5.1. Measuring Pellet Quality
Pellet quality analyses have helped to assure that consistent quality feed was
produced at the feed mill. Pellet quality has been measured using various standard methods.
The two most popular methods used to measure pellet quality have been the Kansas State
University (KSU) method and the Holmen method. The KSU method or tumbling can test
was accepted as the standard method by the American Society of Engineers after it showed
an excellent correlation with the Stoke hardness test. This was a simple test in which the
pellets were tumbled in a specially designated box for 10 min in order to simulate the transfer
and handling of the feed (Fairfield, 1994). Pellet durability index (PDI) was calculated as the
ratio of fines after tumbling to the amount of whole pellets at the start of the test. Feed with a
higher PDI indicated that the manufactured pellets were more likely to remain intact before
feeding (Behnke and Beyer, 2002). The main purpose of the KSU tumble box method was to
predict the actual percentage of fines generated as the pelleted feed was subjected to abrasive
impact forces as it moved from the feed mill to the farm bin and then to the feeder in front of
the birds or pigs. However companies and nutritionists have modified the KSU method by
adding hex nuts or other modifiers in order to increase the impact forces inside the tester and
improve the ability to predict the true quality of the feed at the farm.
Holmen Pellet Tester was developed in England and therefore has been more
through an air conveyance system for 30-120 second. Pellets were subjected to shear and
impact, which simulated the pneumatic transport used mainly in European countries rather
than the mechanical conveyance used in USA feed mills.
1.5.2. Pellet Quality and Feed Mill Efficiency
The addition of DDGS to poultry and swine diets has produced mixed results with
regards to pellet quality. According to Noll et al. (2007b), the addition of DDGS to pelleted
feed has had negative effects on feed mill performance. The main concerns during feed
manufacturing were the negative effect on pellet quality and pellet mill throughput (Behnke,
2007). Shim et al. (2011) reported a decrease in pellet quality from 81 to 61% in grower feed
and 74 to 50% in finisher feed when the inclusion of DDGS increased from 0 to 24%.
Fahrenholz et al. (2008) conducted two experiments varying the inclusion of DDGS from 0
to 40%. In the first experiment, the author reported no differences on pellet durability for
both standard and modified methods, however diets that contained 40% DDGS resulted in
10% lower production rate as compared to the control. In the second experiment the author
reported a decrease in pellet quality for the standard (90.3 to 86.6%) and modified (88.6 to
84.3%) PDI methods and decreased production rate (13%) as the inclusion of DDGS was
increased from 0 to 40%. Using similar levels, Stender and Honeyman (2008) reported a
decrease in pellet quality from 78.9 to 47.4% as the inclusion of DDGS was increased from 0
to 40%. The decrease in pellet quality of diets containing DDGS has been attributed to lower
starch content and consequently poorer binding properties (Behnke and Beyer, 2002). In
always required a higher amount of added fat in the mixer if caloric density had to be
maintained. Fat has been reported to work as a lubricant during the pelleting process to
reduce friction in the pellet die and impair pellet binding (Stark, 1994; Thomas et al., 1998).
Wang et al. (2007) reported an increase in the percentage of fines when more fat was added
to diets containing DDGS in order to retain isocaloric diets, but less variation in the
percentage fines when the level of fat was kept constant (Wang et al., 2008).
1.6. PARTICLE SIZE REDUCTION
Many feed ingredients such as cereal grains (corn, wheat, etc.) have been ground to
reduce particle size before their incorporation into poultry and swine diets (Zang et al.,
2009). The reduction in the particle size of grains during grinding has involved the disruption
of the outer seed coat and fracture of the endosperm (Amerah et al., 2007). The influence of
particle size on pellet quality and poultry and swine performance has been extensively
studied (Kilburn and Edwards, 2001; Peron et al., 2005; Parsons et al., 2006). Decreased
particle size increased the surface area of the digesta available for interaction with digestive
enzymes and was associated with improved digestibility (Goodband et al., 2002). Previously,
particle size was defined in general terms as fine, medium, and coarse (Goodband et al.,
2002). Currently there has been more interest in studying the effect of dietary particle size on
animal performance and a more accurate measurement of particle size has been developed
utilizing the geometric mean of the particles as well as size distribution (ASAE, 1973). A
better definition of particle size has allowed better recommendations regarding the particle
The effects of particle size on nutrient digestibility and live performance of poultry
and swine have been studied by several groups (Wondra et al., 1995; Fastinger and Mahan,
2003; Parsons et al., 2006), but the results have been contradictory. Parsons et al. (2006)
reported a decrease in digesta passage rate and increase in nitrogen retention when the
particle size of corn was increased. In addition, Favero et al. (2012) reported an improvement
in total tract apparent digestibility of dry matter, nitrogen, and crude fiber as the particle size
of corn was increased from 380 µm to 606 and 806 µm. On the other hand, Wondra et al.
(1995) reported a lineal increase in the fecal digestibility of dry matter, nitrogen, and gross
energy when the particle size of corn was decreased.
The results of the previous studies suggested that the response to different particle
sizes of feed ingredients differ depending on the species, age, and feed form. Poultry have
been reported to require large particles of cereal grains that can stimulate gizzard
development and reverse peristalsis in order to compensate for a short intestine (Nir et al.,
1994). Reverse peristalsis has been reported to be important to increase the exposure of the
intestinal digesta to enzymatic secretions in order to improve digestion in the upper and
lower section of the gastrointestinal tract (Duke, 1992; Nir et al., 1995). The gizzard has been
the organ that regulated intestinal motility as influenced by particle size of the feed
ingredients (Nir et al., 1995). Conversely, the growth performance of swine has been
improved as the proportions of dietary fine feed particles were fed (Steinhart, 2012).
Research had shown that when particle size was reduced from 1000 microns to 400 µm there
was an improvement in swine feed efficiency of approximately 1.3% for every 100-µm
1.7. HYPOTHESES AND RESEARCH OBJECTIVES
Feed costs represents 65 to 75% of total livestock production costs (Goodband, 2002).
Because corn usage for ethanol production has increased by 82% from 2000 to 2008, the
availability of DDGS as a feed ingredient has increased accordingly (Shurson, 2003; Schmidt
et al., 2012). During this period, the potential of DDGS to be used as a source of protein,
energy, and phosphorus to replace more expensive ingredients, such as corn, SBM, and
dicalcium phosphate in poultry and swine diets has increased tremendously (Hoffman and
Baker, 2011). However, the nutrient content of DDGS varies considerably among ethanol
plants, with crude fiber, acid detergent fiber (ADF), neutral-detergent fiber (NDF), ash,
phosphorus, and heat sensitive essential amino acids being the nutrients with the highest
variation (Speihs et al., 2002; Belyea et al., 2004; Batal and Dale, 2006; Fastinger et al.,
2006; Fiene et al., 2006; Parsons et al., 2006; Liu, 2008). Lysine has been defined as the first
and second limiting amino acid in swine and poultry diets, respectively, and has been a major
concern when a high dietary inclusion level of DDGS is used (Noll et al., 2007b). The
digestibility of lysine in DDGS has been reported to be lower than in corn and SBM (Batal
and Dale, 2006). During the drying process of DDGS the epsilon amino group of lysine has
been reported to react with the carbonyl group of reducing sugars and be rendered
unavailable (McGinnis and Evans, 1947; Warnick and Anderson, 1968; Cromwell et al.,
1993; Pahm et al., 2008a). Fastinger and Mahan (2005) reported DDGS to have an apparent
ileal digestibility of lysine of only 27%, indicating that some commercial sources of DDGS
might be severely over-heated.
and swine have been studied by several groups in recent years (Wondra et al., 1995;
Fastinger and Mahan, 2003; Parsons et al., 2006), but the results have been somewhat
contradictory. While poultry species require large particles of cereal grains to stimulate
gizzard development and reverse peristalsis, swine require small particles to increase the
surface area of contact between digesta and digestive enzymes and thus increase nutrient
digestibility (Goodband et al., 2002). This apparent paradox provides an interesting subject
of research study.
Therefore, our working hypothesis was that the dietary inclusion level of DDGS in
broilers and pigs diets depends upon formulation strategies and particle size manipulation
and could be used to influence pellet durability, nutrient digestibility, and overall
performance of poultry and swine. To accomplish our working hypothesis, our research
objectives were divided into four specific hypotheses described below.
CHAPTER 2
Specific hypothesis 1. Further grinding of SBM and DDGS will improve pellet quality. Objective 1. To evaluate the effect of further grinding of SBM on pellet quality in finisher diets for swine.
Objective 2. To evaluate the effects of further grinding DDGS on pellet quality in
finisher diets for swine.
CHAPTER 3
Objective 1. To evaluate the effect of further grinding DDGS on pellet quality and
broiler live performance when the mixer-added fat is kept constant.
Objective 2. To determine the effect of DDGS inclusion on broiler performance in
diets formulated on a digestible amino acid basis.
Objective 3. To determine the effect percentage fines in the feed on broiler
performance.
CHAPTER 4
Specific hypothesis 3. In diets formulated on a total amino acid basis, the live performance of broilers decreases and footpad lesions increase as dietary inclusion level of DDGS
increases.
Objective 1. To evaluate the effect of dietary DDGS inclusion level on pellet quality
when supplemental fat is added in the mixer.
Objective 2. To evaluate the effect of method of DDGS fat analysis (ether extract
versus ether extract with acid hydrolysis pretreatment) on pellet quality and broiler
live performance.
Objective 3. To evaluate the effect of dietary DDGS inclusion level on broiler growth
performance when diets are formulated on a total amino acid basis.
Objective 4. To evaluate the effect of dietary DDGS inclusion level on nutrient
CHAPTER 5
Specific hypothesis 4. Further grinding of SBM and DDGS and pelleted feed without fines improves pig live performance.
Objective 1. To evaluate the effect of further grinding SBM and DDGS on pig live performance.
1.8. REFERENCES
AOAC. 2005a. AOAC Official Method 990.03. Protein (Crude) in Animal Feed. In Official Methods of Analysis of AOAC International (OMA). AOAC International. Gaithersburg, MD.
AOAC. 2005b. AOAC Official Method 2001.11. Protein (Crude) in Animal Feed, Forage (Plant Tissue), Grain and Oilseeds. In Official Methods of Analysis of AOAC International (OMA). AOAC International. Gaithersburg, MD.
AOAC. 2005c. AOAC Official Method 945.16. Oil in Cereal Adjunts. In Official Methods of Analysis of AOAC International (OMA). AOAC International. Gaithersburg, MD.
AOAC. 2005d. AOAC Official Method 978.10. Fiber (Crude) in Animal Feed and Pet Food. In Official Methods of Analysis of AOAC International (OMA). AOAC International. Gaithersburg, MD.
Abdollahi, M. R., V. Ravindran, T. J. Wester, G. Ravindran, and D. V. Thomas. 2011. Influence of feed form and conditioning temperature on performance, apparent metabolisable energy and ileal digestibility of starch and nitrogen in broiler starters fed wheat-based diet. Anim. Feed Sci. Technol. 168:88-99.
AFIA. 2007. Evaluation of analytical methods for analysis of dried distillers grains with solubles. Am. Feed Ind. Assn., Arlington, VA.
Amerah, A. M., V. Ravindran, R. G. Lentle, and D. G. Thomas. 2007. Influence of feed particle size and feed form on the performance, energy utilization, digestive tract development, and digesta parameters of broiler starters. Poult. Sci. 86:2615-2623.