YEH, JACQUELINE S. Effect of Varying Hydrodynamic Shear and Extracellular Polymeric Substances on Aerobic Granulation. (Under the direction of Dr. Francis Lajara de los Reyes III).
Conventional activated sludge (AS) has been a central part of the wastewater treatment system since its development. The efficiency of AS could be improved by converting the slow-settling flocs to larger, denser, and more regularly shaped microbial aggregates known as aerobic granular sludge (AGS). The advantages of AGS over AS include higher settling velocity,
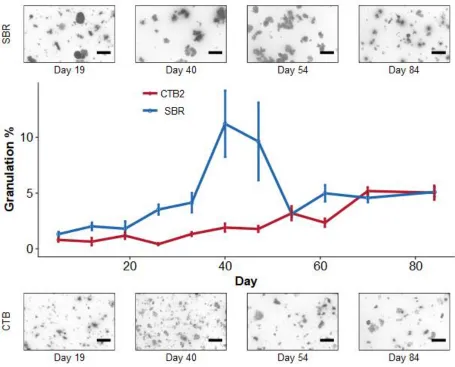
Effect of Varying Hydrodynamic Shear and Extracellular Polymeric Substances on Aerobic Granulation
by
Jacqueline S Yeh
A thesis submitted to the Graduate Faculty of North Carolina State University
in partial fulfillment of the requirements for the degree of
Master of Science
Environmental Engineering
Raleigh, North Carolina 2018
APPROVED BY:
______________________________ ______________________________ Dr. Joel J. Ducoste Dr. Douglas F. Call
______________________________ Dr. Francis Lajara de los Reyes III
DEDICATION
To my parents, David and Khue, and my brothers, Andy, Victor, and Carter, Thank you for your unconditional love and support.
BIOGRAPHY
Jacqueline Yeh was born in Plano, Texas on June 27, 1994 to David and Khue Yeh. She spent half her childhood in Plano before moving to Cary, North Carolina in 2005. In 2012, her undergraduate journey began at North Carolina State University. During her time as an
undergraduate student, Jacqueline was in the University Honors Program, served as co-director of Engineers’ Week within Engineers’ Council, studied abroad at the Prague Institute in Prague, Czech Republic, and enjoyed pottery classes at the Craft Center. Jacqueline completed her Bachelor of Science in Environmental Engineering and Minor in Design Studies at North
ACKNOWLEDGMENTS
With immense gratitude, I would like to acknowledge my advisor, Dr. Francis de los Reyes, for introducing me to the world of research and for guiding me during my graduate studies. I am grateful for all the advice and opportunities shared along the way.
Additional gratitude for Dr. Joel Ducoste for his support, advice, and knowledge shared during research meetings and for his constant enthusiasm.
Sincere thanks as well for my committee member, Dr. Douglas Call, for the suggestions made and time set aside during this thesis development.
I am very grateful to Joseph Weaver, Ling Wang, Yi-Chun Lai, and Austin Burke for their help with the lab work involved with my reactor operation. This project would not have been possible without your assistance.
Further thanks to Dr. Lisa Castellano, the Environmental Engineering Lab Manager who helped me process numerous samples and develop my experimental procedures.
Many thanks to Jake Rhoads for his expertise and help in building and fixing the reactors. Additional thanks to the Staff of North Cary Water Reclamation Facility for always being eager to answer my questions and for providing the seed sludge for this project.
TABLE OF CONTENTS
LIST OF TABLES ... vii
LIST OF FIGURES ... viii
CHAPTER ONE – Introduction ... 1
CHAPTER TWO – Background ... 5
2-1 Activated Sludge ... 5
2-2 Goal of Secondary Treatment ... 5
2-3 Aggregation ... 6
2-4 Extracellular Polymeric Substances ... 6
2-5 Granules and Activated Sludge ... 12
2-6 Hydrodynamic Shear in Reactors ... 18
2-7 Sequencing Batch Reactors vs. Couette-Taylor Bioreactors ... 20
2-8 Stokes’ Law of Settling ... 22
2-9 Key Players in Conventional vs. Granular Aerobic Sludge ... 23
2-10 Knowledge Gaps Preventing Aerobic Granular Technology from being Implemented ... 24
2-11 Hypothesis ... 26
CHAPTER THREE – Materials and Methods... 27
3-1 Introduction ... 27
3-2 Reactor Setup ... 27
3-3 Experimental Setup Schematics and Configurations ... 28
3-4 Experimental Matrix (table for aeration and shear levels within reactors) ... 31
3-5 Influent and Mixing Feed Process ... 33
3-6 Components of Influent Feed ... 34
3-7 Novel pH Control ... 35
3-8 Measured Parameters During Run ... 36
3-9 Batch Tests ... 39
3-10 Length of Run ... 39
3-11 Extracellular Polymeric Substance Measurement ... 40
CHAPTER FOUR – Results ... 42
4-1 Introduction ... 42
4-3 Mixed Liquor Suspended Solids (MLSS) ... 43
4-4 Sludge Volume Index ... 44
4-5 Effluent Characteristics ... 46
4-6 Image Analysis ... 48
4-6.1 Percent Granulation ... 48
4-6.2 Equivalent Diameter and volume moment mean (d43) ... 55
4-7 Extracellular Polymeric Substances (EPS) ... 57
4-7.1 Soluble EPS (Sol-EPS) ... 57
4-7.2 Loosely Bound EPS (LB-EPS) ... 59
4-7.3 Tightly Bound EPS (TB-EPS) ... 60
4-7.4 Correlation Analysis ... 61
4-8 Parameters over a single cycle ... 70
4-9 Lessons from Operation ... 73
CHAPTER FIVE – Conclusions and Future Work ... 76
CHAPTER SIX – Overall Mechanism of Granulation related to Shear Variation and EPS Production ... 78
6-1 The role of shear variation ... 78
6-2 The role of EPS ... 79
6-3 Proposed granulation mechanisms ... 80
6-4 Conclusions ... 81
REFERENCES ... 82
APPENDIX ... 86
Appendix A-1: Image capture and analysis procedures ... 91
Appendix A-2: Code for plotting percent granulation, equivalent diameter, ribbon plots for SVI5/SVI30 in R ... 93
LIST OF TABLES
Table 01. Experimental Matrix ... 32
Table 02. Influent feed components ... 35
Table 03. Extraction buffer components ... 40
Table 04. Correlation coefficients between percent granulation and PS/PN ratios ... 62
Table 05. Correlation coefficients between d43 and PS/PN ratios ... 63
Table 06. Correlation coefficients between protein and percent granulation and d43 ... 63
Table 07. Correlation coefficients between polysaccharide and percent granulation and d43 .... 64
Table 08. Free Ammonia concentrations in each reactor ... 72
LIST OF FIGURES
Figure 01. Possible chemical transformation processes in activated sludge granules
(Cornea, Cr, & Dinu, 2013) ... 1
Figure 02. Nereda® cycle (Cornea et al., 2013) ... 2
Figure 03. Sketch of EPS structure (Sheng, Yu, & Li, 2010) ... 8
Figure 04. Schematic representation of extracellular polymeric substance (EPS)-enhanced biogranulation (Y.-Q. Liu et al., 2004) ... 11
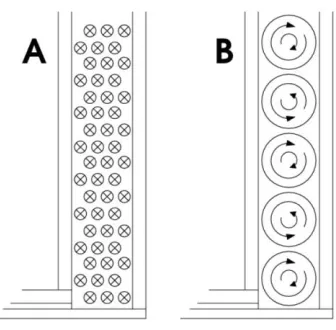
Figure 05. Fluid motion within an annular gap; (A) For a rotating outer cylinder, laminar streamlines flow into or out of the page with no z-component; (B) For a rotating inner cylinder, turbulent Taylor vortex motion is observed (Williams, 2004) ... 22
Figure 06. Experimental setup showing a) refrigerated influent, b) inline mixers, c) SBR, d) CTB1 with lower average total shear to SBR, e) CTB2 with equal average total shear to SBR, f) CTB3 with higher average total shear to SBR ... 28
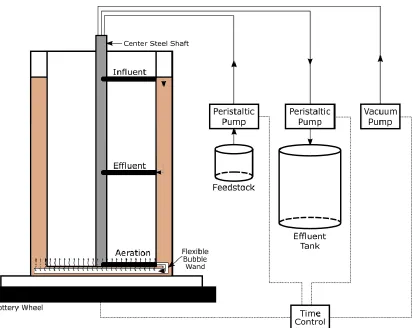
Figure 07. Couette-Taylor bioreactor setup ... 30
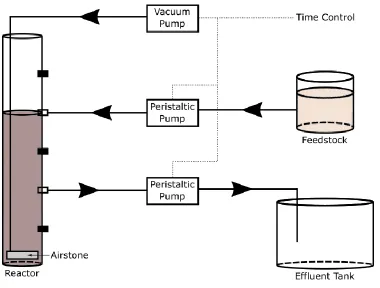
Figure 08. Sequencing Batch Reactor setup ... 31
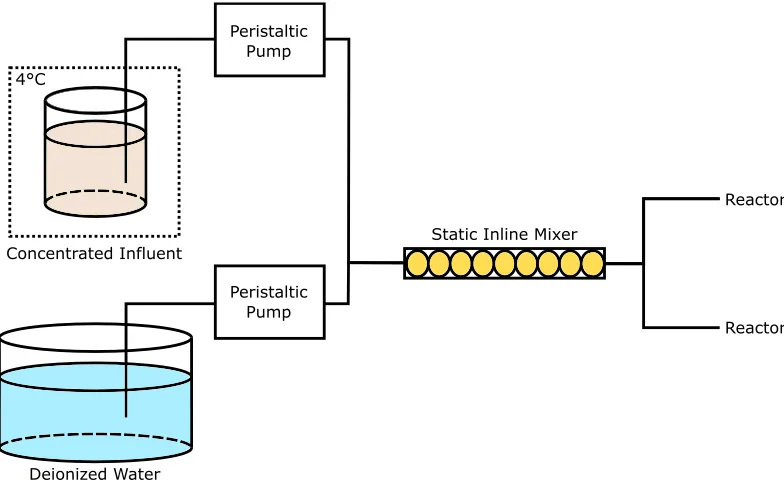
Figure 09. Schematic showing the influent mixing process (use of inline mixer) used in duplicate ... 34
Figure 10. pH of each reactor during operation ... 42
Figure 11. COD removal performance ... 43
Figure 12. Total Suspended Solids measured for each reactor ... 44
Figure 13. Ribbon plot displaying difference between SVI5 and SVI30 ... 46
Figure 14. Effluent Total Nitrogen concentrations ... 47
Figure 15. Effluent Nitrite and Nitrate concentrations ... 47
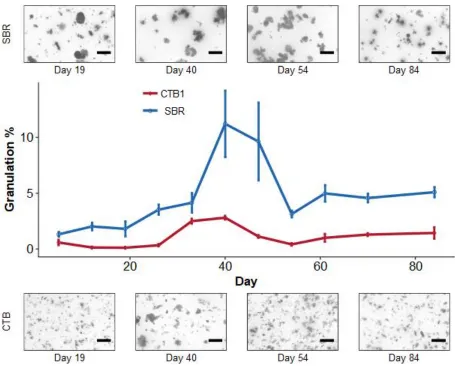
Figure 16. Percent granulation comparison between CTB1 and SBR ... 49
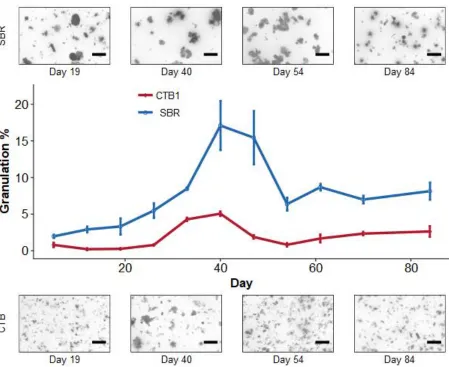
Figure 17. Percent granulation comparison between CTB1 and SBR with less selective granule threshold ... 50
Figure 18. Percent granulation comparison between CTB2 and SBR ... 51
Figure 19. Percent granulation comparison between CTB2 and SBR with less selective granule threshold ... 52
Figure 20. Percent granulation comparison between CTB3 and SBR ... 53
Figure 21. Percent granulation comparison between CTB3 and SBR with less selective granule threshold ... 55
Figure 22. Changes in volume-moment mean (d43) over the course of the run for (a) CTB1, (b) CTB2, and (c) CTB3 as compared to the control SBR ... 56
Figure 24. PS/PN ratio for Loosely Bound EPS components from each reactor ... 60
Figure 25. PS/PN ratio for Tightly Bound EPS components from each reactor... 61
Figure 26. Correlation plots between PS/PN and percent granulation ... 65
Figure 27. Correlation plots between protein and percent granulation ... 66
Figure 28. Correlation plots between protein and percent granulation for the SBR, separated by granulation and disintegration events ... 67
Figure 29. Correlation plots between polysaccharide and percent granulation ... 68
Figure 30. Correlation plots between polysaccharide and percent granulation for the SBR, separated by granulation and disintegration events ... 69
Figure 31. Reactor COD over a cycle ... 70
Figure 32. Reactor Ammonia over a cycle ... 71
Figure 33. Reactor Nitrite over a cycle ... 72
Figure 34. Reactor Nitrate over a cycle ... 73
Figure 35. Proposed mechanism for the presence of shear variation in a bioreactor; (a) longer cycle time between low and high shear zones (b) shorter cycle time between high and low shear zones (Karami, 2012) ... 80
Figure A-01. Effluent Nitrite concentrations ... 87
Figure A-02. Least squares curve fit for SBR during respirometry test ... 87
Figure A-03. Least squares curve fit for CTB1 during respirometry test ... 88
Figure A-04. Least squares curve fit for CTB2 during respirometry test ... 88
CHAPTER ONE – Introduction
The conventional activated sludge treatment process is one of the most prominent and long-lasting technologies of the wastewater treatment industry though there are many areas where inefficiencies could be improved. Typical activated sludge steps must include two basins, requiring a large footprint. Typical aerobic sludge becomes flocculent in the aeration basin and is allowed to slowly settle in the secondary clarifiers and be returned to treat the new flows of influent wastewater. These characteristic fluffy floc structures may require long settling periods. A common operational disadvantage is for facilities to experience periods of bulking and
foaming which prevents the sludge from settling effectively. In addition, the microbes in conventional activated sludge may not be able to handle unexpected loads or toxic shocks. Thought there are still questions regarding how and why certain reactor characteristics lead to their formation, aerobic granules have been developed over the past two decades as a more efficient alternative to the conventional activated sludge system.
Granules are self-immobilized microbial aggregations with larger and more consistent size, density, and shape factors, formed without additional media. The higher density and size of granules allows them to settle faster than flocs, leading to better retention. The microbial layers within an aerobic granular particle also allow for simultaneous nitrogen and phosphorous removal by the chemical reactions shown in the following figure.
In addition, the granular sludge structure is better suited to deal with high organic loading rates and shock loadings. Previous research has been conducted to determine whether
fundamental characteristics such as hydrodynamic shear, organic loading rate, and flow
characteristics due to reactor configuration influence aerobic granular formation (Xiao, Yang, & Li, 2008).
Thus far, only one instance of aerobic granular sludge technology has been implemented at a full-scale facility, the Nereda® technology, developed at Delft Tech University in
collaboration with Ryal HaskoningDHV (Rewell & Seccombe, 2012). Under specific conditions, Nereda® may be grown using a mix of bacteria able to remove biological oxygen demand (BOD), nitrogen, and phosphorous from wastewater.
Figure 02. Nereda® cycle (Cornea et al., 2013)
needed (Rewell & Seccombe, 2012; S. J. Sarma & Tay, 2018). Full-scale plants with Nereda® technology can achieve high effluent quality with less than 5 mg/L total nitrogen and about 0.3 mg/L total phosphorous (S. J. Sarma & Tay, 2018). Though this is an advance toward making aerobic granular sludge a reality for many treatment facilities looking to improve their treatment process, it is mostly suited for small plant sizes, batch configuration, specific types of
wastewater, and specific loadings and removal requirements. The test plant in South Africa that piloted the full-scale demonstration of Nereda® treated four million liters per day of high strength influent (Rewell & Seccombe, 2012). High strength septic influent and municipal wastewater with high contributions of industrial waste from slaughterhouses have been
successfully treated by aerobic granular sludge but at flows limited to 4000 to 36000 m3/day (Li, Ding, Cai, Huang, & Horn, 2014). Thus far, few detailed reports have been released about the ability of the aerobic granules at these plants to withstand changes in process conditions, which has been an issue seen during lab-scale experiments and may be an issue for full-scale plants (S. J. Sarma & Tay, 2018). Improvements that the Nereda® team suggest include improving the type of influent the granular sludge is able to treat and widening the types of facilities that may be retro-fit with such technology, since Nereda® granules are only applicable under batch
It is often concluded that the relatively circular upflow patterns seen in column reactors are homogenous enough to be represented by a single, average hydrodynamic shear value (Y. Liu & Tay, 2002). However, column reactors with a high ratio of reactor height to diameter display a variation in shear throughout a reactor system from high to low moving away from aeration ports. Higher levels of hydrodynamic shear are important for inducing the excretion of extracellular polymeric substances (EPS) which forms a sticky matrix and for driving the
aggregation process (Feng et al., 2016). The EPS quantification is typically represented as a ratio of proteins (PN) and polysaccharides (PS) and it is widely assumed that these polymeric
CHAPTER TWO – Background
2-1 Activated Sludge
Activated sludge is the most common biotechnology used during the secondary treatment process of wastewater due to its reliable performance of organics removal. This step requires the use of an aeration tank, for the removal of organic carbon, ammonium, and phosphate, and a secondary clarifier for the separation of solids (Martins, Pagilla, Heijnen, & Van Loosdrecht, 2004). While it has been widely used, there are areas for improvement in the technology.
Potential improvement could be made to reduce the production of excess sludge, size of the unit process footprint, time of settling period, and operational problems.
A common operational problem that can arise with conventional activated sludge processes is bulking due to the sludge being unable to settle apart from the clear supernatant in the settling tank. This problem is often due to the presence of filamentous microorganisms which prevent the flocs from compacting and settling out (Martins et al., 2004). Alternative treatment methods have been developed and researched to avoid such problems and to meet increasing demand placed on existing facilities using existing infrastructure. Aerobic granulation has been studied as an improvement to the conventional activated sludge system with superior settling ability, high biomass retention, and tolerance for high organic loading rates.
2-2 Goal of Secondary Treatment
step involves a settling process to separate suspended solids from treated water which is where there are inefficiencies with settling times and basin size and number required. By tailoring the sludge to settle faster through the formation of larger, denser granules, the secondary treatment footprint may be reduced, and shorter settling periods may be achieved.
2-3 Aggregation
The basis for many microbial processes in wastewater is aggregates: microbial
communities that form biofilms or flocs which utilize extracellular polymeric substances (EPS) to stick together. Attached growth processes rely on a biofilm structure to achieve retention of the microbial community while suspended growth processes rely on the gravity settling ability of the floc particles to retain their microbial communities (Grady Jr., Diagger, Love, & Filipe, 2011). Though there are aspects of the complex aggregation process that are not fully
understood, it has been concluded that EPS is important to the aggregation of flocs and biofilms due to their assistance with the retention of water, storage of nutrients, accumulation of
enzymatic activity, and protection against toxins (Grady Jr. et al., 2011). 2-4 Extracellular Polymeric Substances
excreted by cells forms a three-dimensional matrix that entraps bacteria, nutrients, and microbial debris, acting as a stabilizing and protective barrier between cells and the environment. Within the protective matrix, the EPS can also trap organic materials, providing the cells with a readily-available energy source, and enzymes, which hydrolyze the sorbed organic matter (Laspidou & Rittmann, 2002). While present in both flocculent and granular sludge, research has shown the EPS content of granules to be much higher than both conventional flocs and biofilms due to higher stress conditions necessary for the formation of granules (Y.-Q. Liu et al., 2004). Though reported as controlling factors related to membrane fouling of submerged membrane bioreactors (MBR), EPS is theorized to play an important role in the formation of aerobic granules (Z. Wang, Wu, & Tang, 2009). Several operational conditions, including reactor type, substrate composition and loading rate, hydraulic retention time, hydrodynamic shear force, settling time, feast-famine regime, and influent and operational temperatures can stimulate cells to produce additional EPS (Y.-Q. Liu et al., 2004).
Regarding biogranules, EPS can be divided into three types based on their proximity and interaction to the biomass. Soluble EPS (Sol-EPS), primarily consisting of soluble
flocs and biofilms, also resulting in ecological zones (Grady Jr. et al., 2011). Separation of the soluble portion of EPS may be achieved by centrifugation as the soluble polymers are transferred to the supernatant, leaving the bound polymers attached to the biomass pellet (Y.-Q. Liu et al., 2004). Thus far, research has not been able to determine whether the EPS is made initially, leading to bacteria being able to stick together, or whether bacteria are able to adhere prior to the production of EPS.
Figure 03. Sketch of EPS structure (Sheng, Yu, & Li, 2010)
Past research has produced contradictory reports on the ratio of carbohydrate to protein found in granule EPS with some reporting higher protein components (Fukuzaki, Nishio, & Nagai, 1995) and other reporting higher carbohydrates (Fang, Liu, & Zhang, 2002) though it is agreed that the quantity and composition of EPS produced by granules depends on the present species, limiting substrate, oxygen limitation, ionic strength, shear force, and phase of the batch cycle, among other operational conditions (Y.-Q. Liu et al., 2004). It has been reported by Tay et al. (2001) that aerobic granule formation corresponds to a sharp increase in cellular
Rittmann, 2002). While there are contradicting reports regarding the dominant components of granular EPS, it should be noted that there is not one standard EPS extraction method - there are many different EPS extraction methods, including EDTA extraction, ultracentrifugation, steam extraction, formaldehyde (RCF) and regular centrifugation, and sonication, among others, which makes it difficult to compare EPS found in different granular sludges treating different types of influent (Y.-Q. Liu et al., 2004; Pellicer-Nàcher, Domingo-Félez, Mutlu, & Smets, 2013). In general, it has been found that a protein/polysaccharide (PN/PS) ratio of 3.4:6.2 is present in the EPS matrix, not separated by different EPS types (Grady Jr. et al., 2011). It is thought that the β-polysaccharides and alginate are responsible for mechanically stabilizing the granules (Grady Jr. et al., 2011). While generally it is understood that the production of EPS affects the formation of larger aggregates and mature granular sludge, there is still more that is not understood about its formation – including whether a particular species produces the majority of the EPS or if all the microorganisms making up the granules produce EPS at similar rates. Additional work that needs to be performed includes EPS characterization to determine the individual polymers extracted as proteins or polysaccharides. Knowing which individual polymers are present may help determine which are the most important for granulation (Grady Jr. et al., 2011).
charged cell surface and EPS with a minimum concentration of 0.7 to 2.0 meq/L of calcium and magnesium being suggested, though the actual required concentration would depend on the ionic strength of the particular wastewater being treated (Grady Jr. et al., 2011). Calcium, Ca2+, ions may crosslink anionic polysaccharides in the EPS and play a role in stable granule formation while phosphate ions, which act as ion chelating agents, have been found to dissolve crosslinks found in calcium-alginate gels (Grady Jr. et al., 2011). This observation has led to the conclusion that chelating agents, such as phosphate ions, amino acids, peptides, or organic acids, found in wastewater may be responsible for destabilizing aerobic granules (Grady Jr. et al., 2011). In addition to having a recommended concentration of divalent ions, it is important for the ratio of divalent to monovalent cations to be above 0.5 as the competition between the two cations for the binding sites on the cell surfaces and the EPS can cause lower formation of settling
characteristics (Grady Jr. et al., 2011). Operating above a minimum solids retention time (SRT) is important to allow the rate of EPS production by the floc-forming bacteria to match the rate of bacterial growth with new surface area; if the SRT is too short, the bacterial growth rate may exceed the EPS production and prevent optimal conditions for bioflocculation from being reached.
Bulk liquid characteristics can also affect surface characteristics of cells which affects the bound EPS components that accumulate on the surface of microorganisms. Cell surface
increases the softness of cell surface and further reduce the negative surface density charge of cells by transferring some of the negative charge to the EPS itself (Y.-Q. Liu et al., 2004).
Figure 04. Schematic representation of extracellular polymeric substance (EPS)-enhanced biogranulation (Y.-Q. Liu et al., 2004)
The overall process that relates EPS production to the aggregation and formation of aerobic granules comes from the role of EPS as a capsular material correlated to cell-to-cell adhesion. It has been found that when exopolysaccharide synthesis was blocked, microbial aggregation was also prevented, strengthening the argument that EPS is a necessary factor
2-5 Granules and Activated Sludge
Granular sludge technology began with anaerobic granules in 1976 for wastewater treatment with aerobic granular technology being reported and researched beginning in 1991 (Saurabh Jyoti Sarma, Tay, & Chu, 2016). The success of anaerobic granular technology with upflow anaerobic sludge blanket (UASB) reactors is often marred by the long start-up period of two to eight months for anaerobic granular sludge development and its inability to be applied for nutrient removal of wastewater; comparatively, the relatively new aerobic granules have a shorter start-up period and may be used for nutrient removal (Y.-Q. Liu et al., 2004). Thus far, aerobic granules have been almost exclusively developed in sequencing batch reactor
configurations.
Aerobic granules are self-immobilized microspheres with multispecies microbial layers that typically grow to 1-3 mm in diameter and must be cultivated under specific operational conditions with strong selective pressure (Y. Q. Liu & Tay, 2007; S. J. Sarma & Tay, 2018). Without specific operational conditions, the self-aggregation without the presence of media would not begin the granulation process (Y.-Q. Liu et al., 2004). Due to an outer layer of aerobic microorganisms and an inner layer of facultative and obligate anaerobic microorganisms and dead biomass, aerobic granules are able to achieve nutrient removal (S. J. Sarma & Tay, 2018). The process to grow ideal granules containing certain species of autotrophic ammonia-oxidizing bacteria, which perform better nitrogen removal, and Accumulibacter, which can couple
The compact and dense nature of aerobic granules allows short settling times to be used and reduces the necessary size of settling tanks to about one-fifth of that required by conventional activated sludge systems (S. J. Sarma & Tay, 2018). The sludge volume index (SVI) is generally used as the main quantitative factor used to evaluate sludge settling properties and shows large differences between aerobic granules and flocs formed from conventional activated sludge (Deng, Wang, & Su, 2016). It has been increasingly common to compare a five-minute and thirty-minute SVI (SVI5 and SVI30) to show the superior settling of granules over flocs (Pronk et al., 2015; S. J. Sarma & Tay, 2018; Wei, Ji, Li, & Qin, 2012). Due to the high biomass
concentration, the desired removal of contaminants is much faster than in conventional activated sludge or larger volumes may be treated in a smaller amount of space (J. H. Tay, Liu, & Liu, 2002). Direct analysis of the SVI5 also helps correlate operational events to granule behavior; for instance, decreases in SVI5 just after inoculation of reactors with conventional activated sludge could indicate slow adaptability to the new configuration and operation or washout of suspended biomass due to strong selection pressures (Wei et al., 2012). The fast settling of aerobic granules also allows about three to five times greater biomass retention, as the granules tend not to be washed out in the effluent, and a reduction in sludge volume which allows larger volumes of wastewater to be treated under the same period (S. J. Sarma & Tay, 2018). The improved
biomass retention also reduces the amount of biomass that makes it to the treated effluent stream, reducing the cell-bound pollutants and nutrients that are released with the effluent (Saurabh Jyoti Sarma et al., 2016).
another, adhesion due to proton translocation, surface charge neutralization, cell surface
hydrophobicity, and van der Waals forces takes place (Y. Liu & Tay, 2002; S. J. Sarma & Tay, 2018). The gradual development of the microaggregates is followed by growth of the
multispecies clusters and EPS production, due to environmental stressors such as fluid shear or nitrogen starvation, which helps form larger aggregates by mediating cohesion and adhesion of cells (Adav, Lee, & Lai, 2007). The final steps lead to mature granule formation, involving compaction and growth to a diameter between 1 to 3 mm as well as strengthening of the aggregate structure. At steady-state, hydrodynamic shear forces lead the three-dimensional structure of the granules to be more regular. From the innermost to outermost layers, the granule consists of a core of anaerobic and facultative anaerobic microorganisms and dead microbial cells and an outer layer of aerobic microorganisms. Though aeration is needed for the growth of aerobic granules, it reduces the nitrogen and phosphorous removal efficiency; this has led the determination that granule development and use in wastewater treatment should be treated as separate processes to keep both efficient (S. J. Sarma & Tay, 2018). The layers present around aerobic granules may protect the innermost bacteria, allowing granules the resilience to withstand toxic shocks and changes in pH (Y. Q. Liu & Tay, 2007).
This process is sensitive to many factors, including reactor geometry, substrate type, and nucleating agents. Most aerobic granules produced under lab conditions have come from
sequencing batch reactors with a large height to diameter ratio though the practical
be one of the driving forces behind aerobic granulation; however, the actual molecular
mechanisms that lead these forces to affect granulation are not fully understood (Grady Jr. et al., 2011). While aerobic granules can be produced without the addition of media for the biomass growth to begin on, nucleating agents such as granular activated carbon have been used to speed up the formation of granules by acting as locations for cell attachment and granule growth to begin (S. J. Sarma & Tay, 2018).
Since aerobic granules have a better retention time than conventional activated sludge, it may more effectively be able to remove pollutants via bioaccumulation or adsorption, which increases its ability to effectively remove emerging contaminants, persistent organic pollutants, nanomaterials, and heavy metals present in wastewater at low concentrations (Saurabh Jyoti Sarma et al., 2016).
Another aspect of granulation that is being researched is how to predictably maintain healthy and stable granules. Stability of granules may be defined as the ability of microbial aggregates to resist hydrodynamic and mechanical shear which may erode the surface of the particles and affect the separation of the solid and liquids (Sheng et al., 2010). Currently, the mechanisms leading to aerobic granule disintegration have not been identified. The increase in granules’ size as a result of microbial growth prevents the dynamic size and shape characteristics of particles during granulation from being predictable since not much is known about the growth rates of the microorganisms found in aerobic granules. Though microbial communities vary throughout different the formation of granules under different conditions, it is suggested that the formation of EPS is more significant to the formation and strength of granules than microbial composition (Quarmby & Forster, 1995). In order for aerobic granules to be a reliable
under steady-state conditions. As mentioned earlier, a possible mechanism for destabilization is the presence of phosphorous ions which act as chelating agents and precipitate out calcium and magnesium as calcium or magnesium phosphate, respectively, and rendering the cations useless for crosslinking with the EPS matrix polymers (Grady Jr. et al., 2011). Other studies have suggested that granule disintegration may be due to anaerobic ammonium-oxidizing bacteria (Grady Jr. et al., 2011) or EPS-deficient conditions (Quarmby & Forster, 1995). As granules disintegrate, it has been observed that the protein to polysaccharide ratio of EPS content will also correspondingly decrease with disintegration events (Kang & Yuan, 2017). Adav et al. (2007) discovered that the proteins and dead cells were the main components in the core layer of aerobic granules while active cells and α-polysaccharides were found along the outer layers of the
granules and β-polysaccharides were found throughout the granules; from this experiment they theorized that the protein found in the core of the aerobic granules and the β-polysaccharides found throughout were important for the stability of the granules (Adav et al., 2007).
Confirmation of this theory has been hindered by the difficulty to accurately separate layers of extracellular and intercellular polymers. Current literature includes some reports that the protein component of EPS found on aerobic granules is essential for the stability and settleability of granules while other experiments report that the polysaccharide component of EPS is responsible for the gel-like properties that lead to denser and more stable granule formation (Kang & Yuan, 2017). Thus, more research and consistent results are needed to determine which primary component of EPS is essential to the successful formation of aerobic granules.
(2017) reported that EPS production was increased because lower OLR and led to more compact granules formation (Kang & Yuan, 2017). The same experiment also reported that higher PN/PS ratios were achieved for lower OLR and confirmed that starvation times during batch operation of reactors led to higher EPS production. Some theorize that increasing protein components of EPS are secreted to protect cells from the shock of nutrient deficiencies while increasing polysaccharide components assist aggregates in becoming denser and more regularly shaped (Deng et al., 2016). This increase of EPS for nutrient deficiencies was also seen during the starvation phase of batch operation to allow the microorganisms to continue to consume nutrients though the COD fed during the influent period had already been removed (Deng et al., 2016).
When assessing the viability of aerobic granular sludge technology, it is important to compare the timeline of start-up between developing granules and adapting conventional activated sludge. Conventional activated sludge typically takes between 30 and 40 days to acclimate to a particular wastewater (Pronk et al., 2015; Wei et al., 2012). If additional biomass is required to treat the wastewater to regulation levels, the start-up period required may be longer. When planning for the necessary biomass volume, a plant must consider the ability to treat the highest load at the coldest temperature the plant, which leads to longer start-up times. Thus far, the start-up times required for aerobic granular sludge plants have been similar (Pronk et al., 2015). Depending on the stringency of effluent requirements, plants may need to operate with gradually increasing stepwise influent flows to achieve effluent quality requirements during start-up.
2002), which leads to the conclusion that granulation is primarily related to the operational parameters chosen for reactors (i.e. settling period, hydraulic retention time, aeration,
hydrodynamic shear, etc.). Although there are still fundamental questions remaining around the aerobic granulation process, laboratories have made efforts to determine how other operational parameters such as organic loading rate, shear stress, aeration, hydraulic retention time, and selection pressure affect the granulation process. Though these factors have warranted many different experiments, the granulation process is still unpredictable and not fully understood. 2-6 Hydrodynamic Shear in Reactors
It has also been reported that within upflow sludge blanked reactors (USBR) with low superficial air velocities around 0.008 m/s, only fluffy flocs were formed, and it was not until an superficial air velocity of 0.025 m/s was reached that granules were reported (Tay et al., 2001). It was similarly reported by Beun et al. (1999) that superficial air velocities of 0.014 and 0.02 m/s did not lead to granulation while higher superficial air velocities of 0.041 m/s did lead to stable aerobic granulation under SBR conditions. Adav et al. (2007) also reported that low aeration rates of 1 L/min did not produce stable granules in comparison to granules with filamentous growth under 2 L/min aeration and 1.0 to 1.5 mm diameter granules were produced in reactors with high aeration rates of 3 L/min. Operational deficiencies in dissolved oxygen or nutrients due to lower aeration may be more favorable to filament growth which affects the stability and performance of granules. High shear may be responsible for the surface erosion that leads to smoothing and promotion of denser aerobic granules, though further research needs to be performed to fully understand how the shear affects granulation at a molecular level.
High hydrodynamic shear conditions with experimental SBRs may lead to the breakup of filamentous granules that are often seen soon after inoculation with conventional activated sludge; the filamentous granules are not stable and usually break apart after a few days but may be important nucleation sites for stable granules (Beun et al., 1999). These filamentous pellets likely lyse due to oxygen limitations in the center of the pellets. The appearance of higher superficial gas velocities also led to the smoothing of granules which displayed filamentous outgrowth, leading to higher shape factors and a more regular appearance of the formed granules. Thought the originally filamentous pellets lyse, the bacterial aggregates of multispecies
media and dominate reactors under the right operational conditions (Beun et al., 1999). Paired with high COD loading and short settling periods, high shear can lead to the formation of stable granules in an SBR.
Several reported experiments have contrasted the view that higher aeration, and subsequent hydrodynamic shear forces, are necessary for the formation of aerobic granules by reporting that compact granules were successfully achieved with lower hydrodynamic shear rates. Kang et al. (2017) achieved such granules with a superficial upflow air velocity of 0.43 cm/s and Henriet et al. (2016) also achieved granulation with dynamic shear rates of 0.42 cm/s. The apparent granulation achievement of these experiments may indicate that it is not an average hydrodynamic shear that leads to granule formation, but rather the inclusion of a variation in hydrodynamic shear within a reactor that offers ideal conditions for granulation. The experiment performed for this project aimed to address whether this variation in hydrodynamic shear is necessary for aerobic granule formation within an SBR.
While previously believed that column reactors with a high ratio of reactor height to diameter led to relatively homogenous circular flow along a reactor’s height (Liu et al., 2002), it is known that there is variation in shear due to the reactor configuration. Thermodynamically, the circular flow found in column reactors forces granules to be sheared into more regularly shaped aggregates to develop minimum surface free energy, similar to how benthic round-shaped boulders are formed in flowing river systems (Liu et al., 2002).
2-7 Sequencing Batch Reactors vs. Couette-Taylor Bioreactors
Sequencing batch reactors (SBR) are a common reactor type due to their cost
settle, and decant times to treat wastewater though suspended growth biomass. These reactors are often use for lab-scale aerobic granulation experiments because each step of the cycle can be easily tailored to favor the formation of larger, denser particles, increased EPS production, and the microbial communities that lead to aerobic granules.
Taylor-Couette flow is the flow between the narrow gap of two coaxial cylinders where one or both of the cylinders are rotating (Masuda, 2018; Qiao, Yan, Teoh, Tong, & Wang, 2018). This type of flow has been used in industrial applications for the cooling of rotary machines, filtration, particle classification, and blood detoxification and for food and bioprocesses due to its improved mixing and heat transfer (Masuda, 2018). Taylor-Couette reactors are also chosen for many bioreactors because the produce less agitation and sparging than traditional stirred and aerated bioreactors which can produce high stress and lead to undesired breakup of fragile cells (i.e. mammalian cells without cell walls) (Qia, Yan, Teoh, Tong, & Wang, 2018). In many cases, only one of the coaxial cylinders will be allowed to rotate to simplify the system. For this
experiment, the inner cylinder, or wall, remained stationary while the outer cylinder rotated. This system of movement meant that the fluid velocity was highest adjacent to the inner wall and lowest near the outer wall, leading to the circular movement of fluid from the inner to the outer wall. These small eddys produced a more laminar flow than if the inner wall had been the rotating surface, as illustrated in Figure 05. This was desirable as it led to a more homogeneous mixture of the fluid within the reactors which allowed for average shear comparison between the CTBs and the SBR which had spatially varying shear. The vortices produced by Taylor-Couette flow are affected by density and viscosity of the fluid, buoyancy, speed of rotation, and
Figure 05. Fluid motion within an annular gap; (A) For a rotating outer cylinder, laminar streamlines flow into or out of the page with no z-component; (B) For a rotating inner cylinder, turbulent Taylor vortex motion is observed
(Williams, 2004)
2-8 Stokes’ Law of Settling
Settling velocity of aerobic granules, and conventionally for particle aggregates in water and wastewater treatment processes, follows Stokes’ law for porous but impermeable microbial granules, which is a generalization applicable for a wide range of Reynolds numbers (Wei et al., 2012).
𝑈𝑠 = (4𝑔(𝜌𝑎−𝜌𝑙)𝑑 3𝜌𝑙𝐶𝑑 )
1 2⁄
= [8𝑔𝑓 𝜋 (
1 𝜌𝑙−
1 𝜌𝑎)
𝑊𝑑 𝐶𝑑𝑑2]
1/2
Eq. 1
Where ρa and ρl are the densities of the aggregate and the surrounding liquid,
respectively, g is the gravitational constant (9.81 m/s2), d is the diameter of the aggregate, Cd is
the empirical drag coefficient adjusted for Reynolds numbers above 1, f is a dimensionless ratio between the wet mass and dry mass of the cells with the aggregate, and Wd is the dry mass of the
𝐶𝑑 = 24 𝑅𝑒+
6
1+√𝑅𝑒+ 0.4 Eq. 2
Settling rate of particles is dependent on the size and density of particles due to Stokes’ Law of Settling. Under sequencing batch reactor configurations, the desired settling period will allow larger, granular material to settle below the effluent discharge point while more flocculent, slow-settling sludge is washed out of the effluent port.
2-9 Key Players in Conventional vs. Granular Aerobic Sludge
Though much research has been performed to determine how various process parameters affect the formation of granules, there is also little known about the microbial communities found within the layers of a granules’ structure. Thus far, few experiments have been performed analyzing community structures found within aerobic granules and corresponding reactor performance. Granules developed for swine wastewater treatment showed Nitrosomonas and Nitrosococcus as the dominant bacteria populations for both flocs and granules, though the
diversities of the dominant populations were not significantly different (Mota et al., 2014). Understanding how the ecology of influent wastewater affects the microbial communities and their nutrient removal performance would allow for more tailored treatment operation and control. Aerobic granules degrading tert-butyl alcohol have been found to have stable
communities with α, β, and δ subdivisions of Proteobacteria and the Cytophaga-Flavobacteria-Bacteroides (CFB) group (Zhuang, Tay, Yi, & Tay, 2005). Under influent primarily consisting of
wastewaters being treated in the experiments are not representative of typical municipal or industrial waste which the majority of treatment plants would receive. Additionally, there has not been extensive research looking at whether there is a consistent community structure that makes up aerobic granules regardless of the dominant component of substrate to be treated. An example of a microbiological study regarding granules that could be done includes how autotrophs, which can store excess nutrients in the form of glycogen or polyhydroxyalkanoates (PHA), contribute to granule formation (Grady Jr. et al., 2011). Determining which microbial ‘key players’ are necessary to the formation of granules can help determine which process parameters should be tweaked to achieve fast and efficient granule formation.
2-10 Knowledge Gaps Preventing Aerobic Granular Technology from being Implemented
Before aerobic granular sludge technology may be implemented further into industry or municipal wastewater treatment the granulation process needs to be predictable and reproducible under different reactor configurations and should be able to treat a wide range of wastewater. It should be further understood how process parameters such as aeration rates and primary
substrate concentrations affect the growth and stability of aerobic granules. Since anaerobic granules were developed before aerobic granules and have been successfully studied and
acetate-fed microbes produce slightly different granules to propionate-fed microbes. So, although the two types of substrate form granules with differing qualities, both types do form granules. This approach would allow research to focus on developing an understanding of how the basic mechanisms, the primary factors, affect granulation.
During lab-scale experiments revolving around the growth and developing stability of aerobic granules, it has been found that the pH of the influent wastewater effects the structure and microorganism dominance of the granules (Xiao et al., 2008). Generally, influent with a low pH and alkalinity produces filamentous and fungi-dominated granules while reactors fed by high-alkalinity influent tend to produce denser granules dominated by rod-shaped bacteria (Xiao et al., 2008). The species that dominates aerobic granules is important because the structure affects the settling velocity and operational parameters. For instance, fungi-dominated granules tend to be larger, looser, and impermeable which leads to settling velocities that are not as fast as denser granules characteristic of bacteria-dominated granules when evaluated using Stokes’ law. Thus far, paying attention to the alkalinity of the influent and regulating pH can help determine the dominant species during the aerobic granulation process (Xiao et al., 2008). To improve the viability of this technology in industry, conditions leading to the consistent formation of granules need to be determined to favor species needed to effectively treat the wastewater to regulation standards.
sludge technology must operate under continuous conditions to meet demand. Future research will need to adapt what is known about aerobic granulation for continuous reactor setups. 2-11 Hypothesis
CHAPTER THREE – Materials and Methods
3-1 Introduction
To address the primary operational variable of hydrodynamic shear variability, four lab-scale sequencing batch reactors were operated in parallel. The control reactor was a tall, narrow, cylindrical Sequencing Batch Reactor (SBR) similar to typical setups prepared where aerobic granules have been developed. The other three reactors were Couette-Taylor bioreactors (CTBs), used to examine reactor conditions where there was a uniform average shear throughout the reactor body. The CTB configuration is also known as an annular gap bioreactor, further
discussed in Section 3-2 of this chapter. One CTB was run at a lower average total shear than the SBR, one at an equal total average shear to the SBR, and one at a higher total average shear to the SBR. Activated sludge, sampled from the North Cary Water Reclamation Facility, was placed in each reactor as inoculum. Influent concentration and flow, discussed in Section 3-5, were the same for every reactor and aeration provided by fine bubble diffusers and stones were adjusted to ensure the desired total average shear in the CTBs was appropriate with the limits of the pottery wheels providing rotation to the CTBs.
3-2 Reactor Setup
This experiment was run using a control sequencing batch reactor (SBR) and three experimental Couette-Taylor Bioreactors (CTBs). The SBR system has been used in other
laboratory studies to reliably form granules and displays the variation in shear that was desired to be explored. Couette-Taylor bioreactors were chosen because of their unique setup with a
clamped aloft within the larger cylinder by an upper shelf. This movement creates small eddys moving in small flow patterns from the inner wall towards the outer wall in a laminar manner. This hydrodynamic behavior of fluid inside a CTB allows even shear to be found throughout the reactor body. In the case of a CTB, hydrodynamic shear originates from both the movement of the reactors and from the provided aeration. Since the SBR had a larger diameter opening than the CTBs, an air stone was placed at the bottom of the SBR to provide compressed air to the reactor. Since the CTBs had a narrower opening and were constantly in motion during the fill and reaction cycles, a thin bubble wand, which had moldable, perforated foam sides, was fit around the curve of the inner cylinder to provide aeration. To compare to the SBR setup, the CTBs were set up to have lower, equal, and higher total average shear to the SBR.
3-3 Experimental Setup Schematics and Configurations
The experimental setup in Broughton Hall Environmental Engineering Lab at North Carolina State University is shown in Figure 06. The height difference between the SBR and CTBs can be seen along with the different relative diameters between the different types of reactors.
Figure 06. Experimental setup showing a) refrigerated influent, b) inline mixers, c) SBR, d) CTB1 with lower average total shear to SBR, e) CTB2 with equal average total shear to SBR, f) CTB3 with higher average total shear
to SBR
A B
The basis of each reactor came from previously designed and used reactors. The CTBs were made of two concentric acrylic cast cylinders to provide the annular gap. Each cylinder had a height of 45.5 cm. The outer cylinders, which became the rotating outer wall, had an outer diameter of 18.4 cm and an inner diameter of 17 cm. To provide rotation, the outer cylinders were connected to a base plate of acrylic that could be connected to a pottery wheel via screws, similar to a pottery throwing bat. The inner cylinders, which were clamped to a shelf to remain stationary, had an outer diameter of 13.8 cm and an inner diameter of 12.5 cm. These cylinders were clamped to the upper shelf by a steel shaft with and inner diameter of 1.5 cm and height of 78 cm that was set into the middle of the inner cylinder with synthetic urethane rubber compound PMC-790, which was poured into the base of the inner cylinder. These dimensions provided an annular gap of 1.6 cm which provided a total available volume of 3.5 L. To prevent accidental overflow due to slight variations in peristaltic pump operation, the working volume was 2.6 L.
Figure 07. Couette-Taylor bioreactor setup
holes in the ports which connected to influent and effluent basins via the Tygon tubing. Aeration was provided by a two-inch limewood airstone (Lee’s Wooden Air diffuser, San Marcos, CA) placed at the base of the reactor tube and was connected to a vacuum pump via tubing that sat through the length of the reactor.
Figure 08. Sequencing Batch Reactor setup
Tubing on each reactor was replaced after about 50 days to prevent excess wear due to the peristaltic pumps from creating a hole in the tubing and to get rid of biofilm growth due to nutrients becoming trapped in the influent lines. Reused tubing connections were cleaned for 10 minutes in a 10% bleach bath and rinsed in deionized water before further use.
3-4 Experimental Matrix (table for aeration and shear levels within reactors)
patterns of CTBs results in laminar eddys, with more even estimates of shear throughout when compared with tall, narrow SBRs with base aeration. In addition, since aeration affects the hydrodynamic shear, each reactor had a different upflow gas velocity, listed in Table 01.
The setup of the reactors included one control Sequencing Batch Reactor (SBR) and three Couette-Taylor bioreactors (CTB): one below the SBR average total shear rate, one equal to the average total shear rate (including that due to aeration and velocity), and one equal to the aeration shear rate above the average total shear rate of the SBR. The average shear rates compared between the control and experimental reactors were determined based on aeration and/or rotation rates, keeping all other parameters constant. The volumetric power dissipation is related to bulk liquid density and standard gravity, in Eq. 3, and mean shear rate is calculated by Eq. 4 (Sánchez Pérez, Rodríguez Porcel, Casas López, Fernández Sevilla, & Chisti, 2006):
𝑃
𝑉= 𝑔𝜌𝑈𝑔 Eq. 3
𝛾 = (1
𝐾𝑔𝜌𝑈𝑔) 1
𝑛+1 Eq. 4
Where n is 1 and K is μ for Newtonian fluids, ρ is density, and g is the acceleration of gravity.
Table 01. Experimental Matrix
Control Higher SBR Shear Rate
Equal Total Shear Rate
Equal Aeration Shear Rate
SBR CTB1 SBR SBR
Mean shear rate (s-1) 204 135 204 249
Ug (cm/s) 0.424 0.123 0.326 0.424
Aeration shear rate (s-1) 204 110 159 204
SBR -- 50 90 90
Rotation shear rate (s-1) -- 25 45 45
Both the SBR and Couette reactors were operated in parallel. 12 L of seed sludge was collected from an aeration basin at the North Cary Water Reclamation Facility during the aeration period to ensure a well-mixed sample was pulled. Prior to the inoculation of each reactor, the seed sludge was aerated in a large bucket and pulse-fed the equivalent of one day’s worth of concentrated influent and allowed to acclimate to the laboratory conditions for two days. After the acclimation period, 2.6 L of the well-mixed seed sludge was poured into each reactor and allowed to settle below the effluent port so 1.3 L of the supernatant could be removed before the addition of the synthetic wastewater. This was to allow the initial biomass
concentration to remain the same after the addition of the synthetic wastewater, rather than have the sludge become diluted to half its original concentration.
3-5 Influent and Mixing Feed Process
To eliminate a previous problem of developing unknown growth in the two-day batches of feedstock kept in a 42 gallon drum at room temperature, the influent feed during this
experiment was concentrated and pumped from a refrigerator kept at 4°C. The original volume of synthetic wastewater fed per cycle was 1.3 L and was adjusted so that the concentrated volume fed to each reactor was 15.6 mL. This concentrated volume of feed was then brought up to a total volume of 1.3 L during the feeding phase of the batch cycle by being mixed with deionized water. Two different peristaltic pumps were used to pull the concentrated media, from the refrigerator, and deionized water, kept in a 55 gallon drum, through a static inline mixer (Cole-Parmer) with 24 turns to ensure that each reactor received the same concentration of feed. Air was pumped through the bottom of the 1 L beaker containing the current batch of
three-way valves were placed just before each reactor to sample the influent COD. Tubes and inline mixers were replaced every 50 days to prevent microbial growth.
Figure 09. Schematic showing the influent mixing process (use of inline mixer) used in duplicate
3-6 Components of Influent Feed
The synthetic wastewater formula used was adapted from Adav et al. (2007) and consisted of the components listed in Table 02. Concentrations for listed macronutrients were adjusted to fit the desired 15.6 mL volume of feed which was then diluted to the original
Table 02. Influent feed components
Macronutrients
Component Name Chemical Formula Concentration [mg/L]
Sodium acetate CH3COONa 600
Ammonium sulfate (NH4)2SO4 500
Sodium chloride NaCl 100
Magnesium sulfate heptahydrate (Epsom salt) MgSO4·7H2O 100
Iron(III) chloride FeCl3 10
Calcium chloride CaCl2·2H2O 5
Dibasic potassium phosphate K2HPO4 825
Potassium dihydrogen phosphate KH2PO4 675
Micronutrients [1 mL/L synthetic wastewater]
Component Name Chemical Formula Concentration [g/L]
Boric acid H3BO3 0.05
Zinc chloride ZnCl2 0.05
Copper(II) chloride CuCl2 0.03
Manganese sulfate MnSO4·H2O 0.05
Ammonium molybdate tetrahydrate Mo7SO4·4H2O(NH4)6 0.05
Aluminum chloride AlCl3 0.05
Cobalt(II) chloride hexahydrate CoCl2·6H2O 0.05
Nickel chloride* NiCl2 0.05
* Note that the original influent feed formula from Adav et al. (2007) incorrectly listed Nickel chloride as NiCl instead of NiCl2.
Theoretical influent COD was 460 mg/L COD and total nitrogen was approximately 110 mg/L. With the influent flow, organic loading rate was 3.6 g COD/day and the hydraulic
retention time was 8 hours. In each cycle 1.3 L of supernatant was decanted and replaced with 1.3 L of fresh synthetic wastewater, consisting of the concentrated and deionized water
components mixed directly before injection into the reactors via static inline mixers. Due to the concentrated nature of the feed, air was bubbled through the concentrated batches of influent to ensure all nutrients were completely mixed prior to the feeding period.
3-7 Novel pH Control
each reactor. If the pH of a reactor was measured as below 6.5 for two consecutive
measurements, a buffer of 1M magnesium hydroxide (Mg(OH)2) was added – generally, no more than 10 mL was necessary – and pH was measured again at the next cycle to ensure that the pH had returned to a near neutral point.
3-8 Measured Parameters During Run
Parameters measured over the run included total suspended solids (TSS), volatile suspended solids (VSS), chemical oxygen demand (COD), pH, nitrate, nitrite, total nitrogen, ammonia, and additional samples were collected for later EPS extraction and 16S rRNA gene sequencing work. Mixed liquor and effluent samples from each reactor were collected every Monday, Wednesday, and Friday for further analysis using the following materials and methods for each parameter:
▪ Total and Volatile Suspended Solids (TSS/VSS): Solids parameters were determined according to Standard methods, test number 2540D (APHA, 2015). 15 mL of mixed liquor was used for each measurement; each sampling point was analyzed in triplicate.
▪ Soluble Chemical Oxygen Demand (COD): HACH (Loveland, CO) COD kits for high range (0-1500 mg/L) and low range vials (0-150 mg/L) were used to measure the COD. Samples were filtered through 0.45 μm membranes held in place by filter holders.
▪ pH: To monitor the pH of each reactor environment, samples of the mixed liquor were taken during the aeration/reaction phase of the batch cycle and analyzed using a pH meter. When the pH was below 6.5 for two consecutive measurements, the pH was adjusted according to Section 3-7.
▪ Nitrate and Nitrite: For this parameter, one mL of collected effluent was filtered through 0.45 μm membranes held in place by filter holders into clean 1.5 mL ion
at 4°C just prior to analysis on a Dionex IC unit (Sunnyvale, CA) using an IonPac AS4A-SC 4 mm column. For every batch, extra sample for a few sampling points were filtered to provide matrix spikes for at least every 10 samples.
▪ Total Nitrogen: Nitrogen was measured using HACH (Test ‘n Tube, Loveland, CO) total nitrogen reagent set (0-25 mg/L). Each vial required 2 mL sample volumes for the total nitrogen test.
▪ Ammonia: For ammonium measurements, HACH (Test ‘n Tube, Loveland, CO) high range ammonium sets (0-40 mg/L) were used. The vials required 100 μL of sample for the ammonium test.
▪ Sludge Volume Index (SVI): The sludge volume index for each reactor was measured three times a week according to Standard Methods, test number 2710D (APHA, 2015). Due to the limited working volume of each reactor, 2.6 L, the volume of mixed liquor required for this test was altered from 1000 mL to 100 mL. Over a period of 30 minutes, the volume occupied by the sludge was measured in milliliters every five minutes and SVI was calculated according to the following equation:
𝑆𝑉𝐼 [𝑚𝐿 𝑔 ] =
𝑠𝑒𝑡𝑡𝑙𝑒𝑑 𝑠𝑙𝑢𝑑𝑔𝑒 𝑣𝑜𝑙𝑢𝑚𝑒 [𝑚𝐿 𝐿⁄ ]×[1000 𝑚𝑔 𝑔⁄ ]
𝑠𝑢𝑠𝑝𝑒𝑛𝑑𝑒𝑑 𝑠𝑜𝑙𝑖𝑑𝑠 [𝑚𝑔 𝐿⁄ ] Eq. 5
To capture the 5-minute SVI (SVI5), Eq. 5 was modified so that the settled sludge volume used was the sludge volume measured after 5, rather than 30 minutes, of settling.
size greater than 200 μm and roundness above 0.6. Roundness was determined by the following equation:
𝑅𝑜𝑢𝑛𝑑𝑛𝑒𝑠𝑠 = 4 𝐴𝑟𝑒𝑎
𝜋×𝑀𝑎𝑗𝑜𝑟 𝐴𝑥𝑖𝑠2 = 1
𝐴𝑠𝑝𝑒𝑐𝑡 𝑅𝑎𝑡𝑖𝑜 Eq. 6
A detailed description of the image analysis techniques used may be found in the Appendix.
▪ Extracellular Polymeric Substance (EPS): Extraction of each EPS component was performed according to the protocol listed by Pellicer-Nàcher et al. (2013), specifically following the sonication methods for both loosely-bound and tightly-bound EPS
extraction. A more detailed description of the extraction and analysis methods are listed in Section 3-9 of this chapter and full procedure is listed in Appendix A-3.
o Protein analysis: Quantification of the protein fraction within the EPS was done by BCA Assay kit from Frølund (1996), adapted for use with 0.2 mL 96-well microplates, incubation in a PCR cycler at 37°C for 30 minutes, and read by a microplate reader (Tecan, Männedorf, Switzerland) at 560 nm.
o Polysaccharide analysis: Carbohydrate analysis was performed using the anthrone-sulfuric acid assay method by Dreywood, 1946 (referenced by Pellier-Nàcher et al., 2013) adapted to be performed on 0.2 mL 96-well microplates (Fisherbrand) and incubated at 90°C in a PCR cycler and cooled on ice before being read by a microplate reader (Tecan, Männedorf, Switzerland) at 620 nm.
3-9 Batch Tests
The following batch tests were performed to analyze reactor performance during a cycle. Mixed liquor samples were taken to perform these tests and returned to the reactors once finished.
• Parameters during a cycle: Towards the end of the run, samples from each reactor were pulled to measure a few of the monitoring parameters, COD, ammonia, nitrite, and nitrate, were over a 4 hour cycle. These parameters were measured to provide insight into the behavior of the reactors.
• Oxygen Uptake Rate: A respirometry test was performed based on the procedure from Eliosov and Ellis to measure the extant kinetic parameters (μ and ks) (Eliosov & Ellis, 2002). Mixed liquor samples were tested within 2 hours of removal from the reactors and were returned to the corresponding reactor after testing.
Note that the growth tests were not conclusive due to the low oxygen levels that were
bubbled through the mixed liquor samples prior to analysis of the injection of COD and analysis of the uptake. Figures A-02 through A-05 in the Appendix show the attempted curve fits for oxygen uptake using Matlab.
3-10 Length of Run
operation, had more issues with wear on the pottery wheel rotors due to the weight of the reactors and continuous operation and needed a replacement wheel to sustain operation. 3-11 Extracellular Polymeric Substance Measurement
To determine whether the excreted extracellular polymeric substances (EPS) from the sludge microbes played a role in the development of more granular biomass, samples from each reactor were regularly taken and analyzed for different EPS components. 15 mL mixed liquor samples were collected every 3-4 days over the course of the run to quantify the three EPS components. The samples were processed to separate soluble, loosely-bound (LB-), and tightly-bound (TB-) EPS according to the method described in Pellicer-Nàcher et al. (2013), though slight modifications were employed to tailor the procedure available lab equipment. Prior to extraction, 1 L batches of extraction buffer, see Table 03, were prepared in deionized water.
Table 03. Extraction buffer components
Component Name Component Formula Concentration
Trisodium phosphate Na3PO4 2 mM (0.327 g/L)
Monosodium phosphate NaH2PO4 4 mM (0.479 g/L)
Sodium chloride NaCl 9 mM (0.5259 g/L)
Potassium chloride KCl 1 mM @ pH 7 (0.0745 g/L)
larger amount of energy per unit volume for TB-EPS extraction, the samples were sonicated for a longer period of time, see Appendix for full extraction procedure (Pellicer-Nàcher, 2013). TB-EPS extraction procedure from sonication to the end of centrifugation was performed in triplicate, resulting in TB-1, TB-2, and TB-3 replicates for each original mixed liquor sample. Previous work done by Pellicer-Nàcher et al. (2013) did not show significant differences in the TB-EPS replicates using the sonication technique but were able to recover more EPS than other extraction methods with minimal cell lysis. All EPS samples were filtered through 0.2 um filter membranes and stored in 1.5 mL microcentrifuge tubes at -20°C prior to analysis. Pellets were resuspended to the original volume in extraction buffer after each procedure.
Previous studies primarily examine the protein and carbohydrate components of EPS and compare the subsequent ratio (PS/PN) as the other EPS components, humic acids, nucleic acids, glycoproteins, and phospholipids, are present in relatively small amounts in comparison. Protein quantification followed the Frølund et al. procedure, adapted for absorbance to be performed on a microplate reader (Tecan, Männedorf, Switzerland) using a BCA kit with albumin as the standard (Frølund, Palmgren, Keiding, & Nielsen, 1996). Carbohydrate quantification followed the protocol listed in the Pellicer-Nàcher et al. (2013) method using anthrone and sulfuric acid to determine polysaccharide content via colorimetric methods and adapted for absorbance
CHAPTER FOUR – Results
4-1 Introduction
Chapter Four will discuss the results obtained from the physical-chemical methods and batch tests detailed in Chapter 3. The performance of the three Couette-Taylor bioreactors will be compared to the control sequencing batch reactor to assess the differences between reactors with varying and homogeneous shear.
4-2 Notes about General Operation
Over the course of the reactor run, the pH was one of the quantitative parameters used to immediately assess the health of the microbes in the reactor. During periods where the pH was consistently lower than 6.5, pH was measured and the magnesium hydroxide buffer was added during multiple cycles per day, as seen in Figure 10.
Figure 10. pH of each reactor during operation
5 5.5 6 6.5 7 7.5 8 8.5
pH
Date
Once the pH had stabilized between 6.5 and 7.25, buffer was no longer added and the pH remained within the desired range, the frequency of measurements taken for monitoring purposes was decreased.
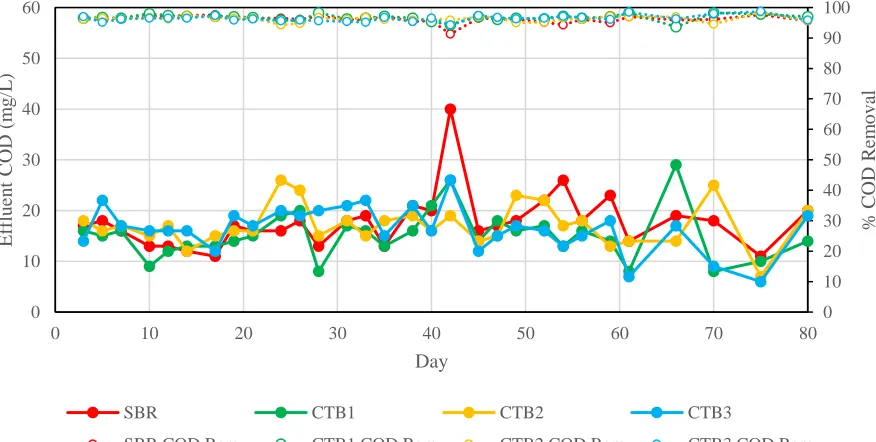
An additional parameter used to assess the performance of reactor was the organics removal, measured as COD removal within each reactor. Given the influent COD of 460 mg/L and tests looking into the actual COD being fed into each reactor the percent COD removed could be calculated. As seen in Figure 11, the percent removal for all reactors remained above 95% for the duration of the run, indicating good performance from all reactors.
Figure 11. COD removal performance
4-3 Mixed Liquor Suspended Solids (MLSS)
During the first two weeks of operation, the total suspended solids (TSS) behavior between all four reactors was about the same. After this point, the solids measurements began to diverge, with the SBR following a decreasing solids trend to approximately 2.5 g/L while the
0 10 20 30 40 50 60 70 80 90 100 0 10 20 30 40 50 60
0 10 20 30 40 50 60 70 80
% C OD R em o v al E ff lu en t C OD (m g /L ) Day
SBR CTB1 CTB2 CTB3
three CTBs tended to remain around or above 3.5 g/L. This difference between the SBR and CTBs could be due to the wasting of smaller particles in the SBR as faster-settling particles were produced.
Figure 12. Total Suspended Solids measured for each reactor
The uptick in TSS seen in the SBR between days 70 and 80 may be due to the growth of the larger particles.
4-4 Sludge Volume Index
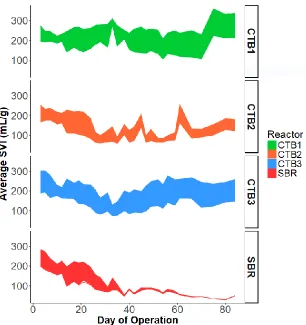
The primary parameter used to assess the settling characteristic of the particles within each reactor was sludge volume index (SVI). Good settling is represented by SVI measurements less than 100 mL/g biomass. Past research and at plants where Nereda® granules have been implemented, the difference between the 5-minute and 30-minute SVI has been increasingly used as a method for monitoring granule formation and stability. The relative simplicity of a SVI test and clear difference between the excellent settling ability of larger, denser granules and slower settling of smaller, lighter particles allows the small difference between measurements at 5 (SVI5) and 30 (SVI30) minutes while the fluffier particles with poor settling ability will display
0 1 2 3 4 5 6 7
0 10 20 30 40 50 60 70 80
T
SS
av
er
ag
e
(g
/L
)
Date
large differences in the two measurements since it will take these particles longer to reach their final settled position (Pronk et al., 2015; S. J. Sarma & Tay, 2018; Wei et al., 2012). This difference is clearly displayed using ribbon plots which graph the difference between two variables at a given x-value, in this case time. The SBR was the only reactor within this
Figure 13. Ribbon plot displaying difference between SVI5 and SVI30
4-5 Effluent Characteristics
Effluent samples from each reactor had COD, total nitrogen, nitrite, and nitrate measurements taken. COD may be seen in the previous Section 4-2. Over the course of the experiment, the total nitrogen (TN) was within the range of 50-150 mg/L for all reactors (Figure 14). During the second half of the experiment, the SBR effluent had a higher TN than the CTBs. This observation may be due to the biofilm buildup only seen on the walls of the Couette