ABSTRACT
GANGWAL, SUMIT. Directed Assembly and Manipulation of Anisotropic Colloidal Particles by External Fields. (Under the direction of Orlin D. Velev.)
The application of external fields to anisotropic particles can be an efficient means of programmed assembly of novel materials and is a rapidly expanding research field. We report a series of studies on the assembly and manipulation of surface patterned anisotropic colloidal particles (whose surfaces are physically or chemically different) by external alternating current (AC) electric and magnetic fields. The fundamental results include the first experimental observation of induced-charge electrophoretic (ICEP) motion of asymmetric metallodielectric microspheres and the formation of novel assembled structures of these particles by dielectrophoresis (particle interaction with external AC electric field gradients) and by magnetophoresis (migration and interaction of particles in an inhomogeneous magnetic field). The experimental and modeling techniques developed and fundamental principles uncovered could be used to engineer the processes of directed and/or programmed assembly of other types of anisotropic particles.
Janus particles were prepared by coating dielectric, polystyrene latex microspheres with a conductive metal layer on one hemisphere. The phase space for AC electric field intensity and frequency was explored for these particles on a glass surface between two electrodes. A rich variety of metallodielectric structures and dynamics were uncovered, which are very different from those obtained from directed dielectrophoretic assembly of plain dielectric or plain conductive particles. The application of low frequency AC fields to aqueous suspensions of the Janus particles leads to unbalanced liquid flows around each half
particles may find applications in liquid-borne microcircuits and materials with directional electric and heat transfer. The electrokinetic motion of the particles may find applications in microactuators and microfluidic devices.
The assembly of magnetic Janus colloids (having 50% surface coating of iron on polystyrene microspheres) under the combined (and sometimes competing) dielectrophoretic
and magnetophoretic forces was investigated. The structures formed by magnetic fields have the advantage that the particle interactions are bistable. They can result in permanent structures, which could be disassembled on demand by remote demagnetization and then reassembled into new stable structures, thus recycling the building blocks. The assembly of magnetic anisotropic particles may find numerous potential applications, among which are bifunctional drug delivery agents and novel flexible displays.
Directed Assembly and Manipulation of Anisotropic Colloidal Particles by External Fields
by Sumit Gangwal
A dissertation submitted to the Graduate Faculty of North Carolina State University
in partial fulfillment of the requirements for the Degree of
Doctor of Philosophy
Chemical Engineering
Raleigh, North Carolina
January 2010
APPROVED BY:
_________________________ _________________________ Saad A. Khan Gregory N. Parsons
_________________________ _________________________ John F. Muth Orlin D. Velev
DEDICATION
this dissertation is dedicated to my parents,
Santosh and Madhu Gangwal,
to my wife, Prachi, and to my daughter, Antara,
BIOGRAPHY
ACKNOWLEDGEMENTS
This work would not have been possible without the help and support of many people. First and foremost, I would like to express utmost gratitude to my research advisor, Professor Orlin D. Velev of the Chemical and Biomolecular Engineering (CBE) department. He has been an exceptional mentor and a wonderful role model. He is one of the most enthusiastic people I have ever met and he is a good motivator. He has always been around to help me whenever I have needed him. Dr. Velev is driven by his basic love of science and possesses very strong human relationship skills that propel him to excel in his field. He is a creative individual whose novel ideas allow him to perform cutting edge research in the field of colloid nanosciene and engineering. I am glad I chose him as my advisor back in Fall 2005 and I have enjoyed the research we have done together. I appreciate the opportunities Dr. Velev provided to present my research at the last three (2007-2009) professional American Chemical Society Colloid & Surface Science Symposiums and recently (Nov. 2009) at the National AIChE meeting.
I respectfully acknowledge Professors John Muth, Saad Khan, and Gregory Parsons for serving on my thesis committee and for helping to guide me. I am thankful to Professor Peter Fedkiw for serving as a substitute on my preliminary defense committee in October 2007. I appreciate the support provided by Professors George Roberts and Carol Hall in our CBE department. Also, the staff members (Kit, Shirley, Sandra, Diane, Saundra and Gwen) from our department have been very helpful and kind during my graduate studies at NC State.
Paunov (University of Hull, UK) for providing me an opportunity to present my work at a symposium he organized in Hull.
I have received much support from the entire Velev research group, both past and present members. I appreciate the advice from and research experience of Dr. Stoyan Smoukov, who has been an excellent colleague to work with. I thank Dr. Suk Tai Chang, Dr. Shalini Gupta, and Dr. Ketan Bhatt for all the knowledge they shared when I joined the lab. I have enjoyed the company of Dr. Sejong Kim, Dr. Lindsey Jerrim and Dr. Daniel Kuncicky. I learned a lot from Dr. Olivier Cayre, who helped to jumpstart my research when I first began. I especially have enjoyed the camaraderie with Vinayak, Jairus, Hyung Jun, Liz, Jess, Burak, and Rachita. I appreciate the efforts of Ankur Sarkar, a high school student that volunteered to work with Burak and I in our lab during the summer of 2009. I also thank my CBE department friends (Arjun, Prutesh and Juan) for making my days light chatting about anything and everything. I acknowledge the productive research interactions with Manish Mittal, Jason McMullan, and Pushkar Lele from the University of Delaware and James Swan from the California Institute of Technology. I thank Dr. Amar Pawar (City College of New York) for the collaborative research project we performed.
TABLE OF CONTENTS
List of Tables ... ix List of Figures ... x
Chapter 1. General Introduction of Particle-localized AC and DC
Manipulation and Electrokinetics ... 1
1.1. Introduction: Major AC and DC Effects in Water-based Systems ... 1.2. Electrophoresis ………... 1.2.1. DC Particle Electrophoresis ……... 1.2.2. Development of Electrokinetic Theory ...
1.3. AC Dielectrophoresis ... 1.3.1. Principles of Dielectrophoresis ...
1.3.2. Applications of DEP in Particle Manipulation ....
1.4. AC Particle Assembly ... 1.4.1. Field-driven Assembly of Regular Particles …...
1.4.2. DEP Assembly of Biocomposite Materials from Live Cells and Particles ..
1.4.3. Field-driven Assembly and Manipulation of Anisotropic Particle ...
1.4.3.1. Background on Janus, Patchy and Other Types of Anistropic Particles ...
1.4.3.2. Assembly of Janus and Patchy Particles by External Fields ...
1.4.3.3. AC Particle Electrohydrodynamics: Principles of ICEP ...
1.5. AC Field in Combination with Semiconductor Diodes ... 1.5.1. Principle of Field Generation along Diode and Self-propellency ...
1.5.2. Diode Velocity Dependence on AC Electric Field and Frequency ...
1.6. Layout of this Dissertation ... 1.7. References ...
2 4 4 5 8 8 13 15 15 22 26 26 29 30 32 32 34 35 36
Chapter 2. Induced-Charge Electrophoresis of Metallodielectric Particles ...
53
2.1. Introduction ... 2.2. Experimental Section ... 2.2.1. Materials and Janus Particle Preparation ...
2.2.2. Experimental Setup ...
2.3. Results and Discussion ... 2.3.1. Effect of AC Field Strength and Electrolyte Concentration on Particle Velocity ...
2.3.2. Effect of AC Field Frequency on Particle Velocity ...
2.3.3. Effect of Size on Particle Velocity ...
2.4. Conclusions ...
2.5. Acknowledgements ...
2.6. References ... 6363
Chapter 3. Dielectrophoretic Assembly of Metallodielectric Janus Particles
in AC Electric Fields ... 65
3.1. Introduction …... 3.2. Experimental Procedures ... 3.2.1. Materials ...
3.2.2. Janus Metallodielectric Particle Preparation ...
3.2.3. Experimental Setup ...
3.2.4. Numerical Simulation ...
3.3. Experimental Results ... 3.3.1. Effect of AC Field Strength and Frequency ...
3.3.1.1. Disordered Particles Region ...
3.3.1.2. Induced Charge Electrophoresis (ICEP) Region ...
3.3.1.3. 3D Bundles Region ...
3.3.1.4. Regular and Staggered Chains Region ...
3.3.1.5. 2D Crystallization Region ...
3.3.2. Characterization of Metallodielectric 2D Crystals ...
3.4. Modeling of Janus Particle Orientation and Staggered Chain Formation in Electrical Field ... 3.4.1. Orientation Angle Simulation ...
3.4.2. Particle Chain Configuration Simulation ...
3.5. Conclusions ... 3.6. Acknowledgement ... 3.7. References ...
66 68 68 68 70 71 71 71 73 73 74 75 76 78 80 82 83 85 86 87
Chapter 4. Reconfigurable Responsive Structures Assembled from Magnetic Janus Particles ... 91
4.1. Introduction …... 4.2. Experimental Section ... 4.2.1. Materials ...
4.2.2. Magnetic Janus Particles Preparation ...
4.2.3. Experimental Setup ...
4.2.4. Numerical Simulation ...
4.3. Experimental Results ... 4.3.1. Structures Assembled by Magnetic Fields ...
4.3.2. Application of AC Electric and Magnetic Fields to Janus Particles ...
4.3.3. Saturation and Residual Magnetization Measurements ...
4.3.4. Modeling of Janus Particle Orientation and Formation of Chain Configurations in Magnetic Field ...
4.4. Discussion ...
4.5. Conclusions ... 4.6. Acknowledgements ... 4.7. References ...
111 111 112
Chapter 5. Programmed Assembly of Metallodielectric Patchy Particles in External AC Electric Fields ... 115
5.1. Introduction ... 5.2. Experimental Section ... 5.2.1. Preparation of Metallodielectric Patchy Particles ...
5.2.2. Experimental Setup ...
5.2.3. Numerical Simulation ...
5.3. Results and Discussion ... 5.3.1. Effect of AC Electric Field Frequency ...
5.3.2. Electric Fields Applied to Higher Concentrations of Patchy Particles ...
5.3.3. Modeling of Patchy Particle Orientation and Chain Formation in Electrical Field ...
5.4. Conclusions ... 5.5. Acknowledgements ... 5.6. References ...
116 118 118 119 120 122 122 125 126 130 131 131
Chapter 6. Summary and Future Outlook ... 134
6.1. Summary ...
6.2. Future Outlook ... 135138
Appendix. ………...…... 140
Appendix A. Electric Energy Definition and Dielectric Subdomain Values Specified in FEMLAB …... 141
A.1. Electric Energy Definition ... A.2. Dielectric Subdomain Values Specified in FEMLAB ... A.3. References ...
LIST OF TABLES
LIST OF FIGURES
Figure 1.1. Schematics of a few categories of particle-localized DC and AC
electrokinetic phenomena. (a) Electrophoresis—upon application of a DC field, particles migrate toward the electrode of opposite charge. (b) Dielectrophoresis—particles are attracted to or repelled from the highest electric field intensity region due to interaction of induced dipole with the gradient of a DC or AC electric field. (c) Dielectrophoretic assembly of anisotropic particles occurring in higher frequency (> 10 kHz) electric fields. (d) Induced-charge electrophoresis (ICEP)—unbalanced electroosmotic flows around the Janus particles surface resulting from different electrical properties of each hemisphere causes the particles to move normal to applied AC electric field direction. (e) Diode rectification of an AC field converted to localized DC electrophoresis—diode self-propels in one direction due to AC field rectification between diodes electrodes. ………... 3
Figure 1.2. Schematic of the origins of electrophoresis of a negatively charged
particle in a DC electric field. The zoomed in area on the right side of the particle reveals the electric double layer at the particle surface with the surface charge, the layer of bound counterions, the Stern layer and the diffuse layer. The variation in electrical potential with distance x away from the surface is also shown. ... 5
Figure 1.3. Simulations illustrating the electric energy density for a pair of
the AC electric field is shown with the double-headed red arrows. …... 12
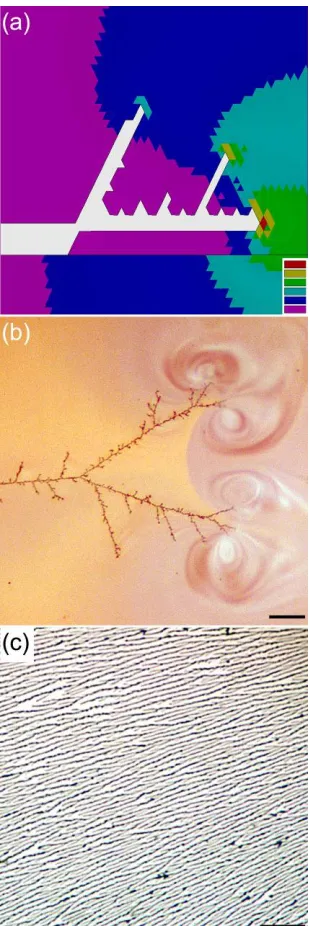
Figure 1.4. Dielectrophoretic-driven assembly of conductive microwires from
gold nanoparticles.14,17 (a) Electrostatic simulation of a growing microwire in the bulk assembly mode. The white area represents the electrode and growing microwire, where the predicted branching pattern by simulations is similar to what is observed experimentally. (b) Optical micrograph of the process of microwire assembly from a suspension of gold nanoparticles. (c) Optical micrograph of a parallel array of surface microwires assembled in a low-voltage, high-frequency electric field. Scale bars: (b) 25 μm, (c) 5 μm.14,17 ………... 18
Figure 1.5. Assembly process of polystyrene microspheres in a thin experimental
cell under an AC electric field. (a) Schematic of a co-planar electrode experimental cell. The spacer can be created using Teflon tape or hydrophobic PAP pen yielding a cell height of 60-100 μm or 10-20
μm, respectively. (b,c) Optical micrographs illustrating the two-stage mechanism of crystallization for latex particles.135 (b) Shortly after the field is applied, the particles align in chains due to dipolar attraction. Simultaneously, the DEP force due to the field gradient attracts the particles to the high field intensity region. (c) The particle chains confined on the surface form 2D-hexagonal crystals aligned with one axis in the direction of the field.135 The particles in the
micrographs are 1.4 μm in size.135 ………. 20
Figure 1.6. (a) Effect of AC field frequency on the field intensity required to
crystallize latex microspheres of three diameters (0.7, 1.0, and 1.4
μm).135 (b) Normalized data from (a) falling onto a single master curve with the radius by the field strength plotted as a function of frequency
for a given particle type.135 ………. 21
Figure 1.7. (a) Chain of live yeast cells and 0.95 μm diameter magnetic particles
cell membrane bound together by Concanavalin-A functionalized
microparticles.210 ……… 24
Figure 1.8. Recently synthesized anisotropic particle building blocks illustrating
anisotropy ‘dimensions’. Particles are classified in rows by anisotropy type and increase in size from left to right according to the scale at the bottom. The key anisotropy attributes include (from top to bottom): branching, colloidal moleculs, faceting into different shape polyhedra, rod-like and ellipsoidal, and surface-patterning.214 ……… 27
Figure 1.9. SEM image of 4.0 μm Janus particles having one dielectric hemisphere and one conductive hemisphere. Janus particles are obtained by partially coating polystyrene particles with 20 nm gold. The gold-coated hemispheres of the particle appear brighter than the
uncoated halves due to their higher conductance. ……….. 28
Figure 1.10. The application of glancing angle deposition (GLAD) to produce
patchy particles. (a) Shadowing effects are caused by neighboring particles within the particle monolayer. (b) A mathematical model is used to study the patch geometry and to calculate the area of the patch. (c) Comparison of experimental (top) and calculated (bottom) gold patches on 2.4 μm sulfated polystyrene particles as a function of the monolayer orientation (α = 0, 18, 29, and 40° from left to right) at an angle of incidence θ = 10º. The scale bars in the experimental images
correspond to 2 μm.238 ……… 29
Figure 1.11. Schematics of propelling diodes suspended in water showing the
localized electro-osmotic flow generated from a DC field rectified from an external AC electric field. The electros-osmotic ionic flux leads to diode motion, which can be in the direction of either the diode’s cathode or the anode, depending on its surface charge. ……… 33
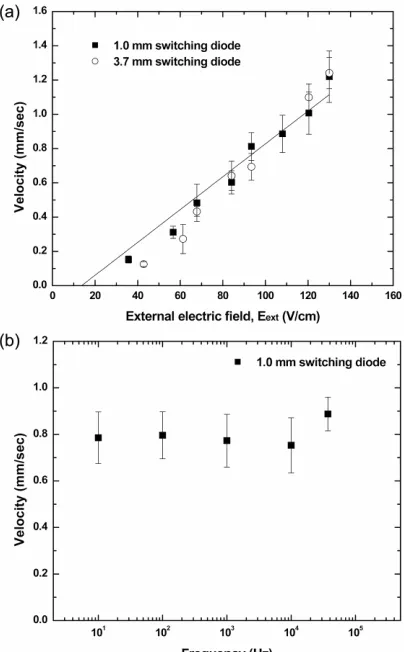
Figure 1.12. Diode velocity dependence on AC electric field and frequency.274 (a)
Diode velocity as a function of the external AC electric field at 1 kHz frequency. The velocities of the two different size diodes are similar even though one is almost four times bigger than the other. (b) Diode velocity as a function of the external AC field frequency at Eext = 93 V cm-1. The error bars reflect the scatter in the data of the experimental
measurements.274 ……… 35
gold. The gold-coated hemispheres appear brighter due to their higher conductance. (b) Schematic of the experimental set-up (not drawn to scale). Two gold electrodes are deposited on the bottom plate. A Teflon spacer sustains a 60-80 gap between the bottom and the top microscope cover slip. The particle suspension is surrounded by a hydrophobic ring and confined in this thin chamber by capillarity. …..
μm
56
Figure 2.2. (a) Optical micrographs from different frames of a recording of the
position and orientation of Janus particles of three different diameters (4.0, 5.7 and 8.7 μ ) in an ac field of amplitude 140 V/cm and frequency 1 kHz. The two particles on the right side in the top image have moved out of the field of view and another particle has moved into view in the bottom image approximately 5 s later. (b) Schematic of a particle in one-half cycle of ac electric field in the stable configuration. The electric double layer on the gold side (black hemisphere) is more strongly polarized and thus drives a stronger ICEO slip (arrows) than the polystyrene side, resulting in ICEP motion in the direction of the dielectric side. ……….
m
57
Figure 2.3. Velocity of 5.7 μ Janus particles as a function of electric field
intensity squared (E02) for various NaCl concentrations at 1 kHz. The linear fits generally agree with the experimental values for low intensities and start deviating for E0 > 280 V/cm. ……...……….…….
m
59
Figure 2.4. Velocity of 5.7 μ Janus particles as a function of frequency at 200
V/cm in 0.1 mM NaCl. The experimental particle velocities were highest at intermediate frequency and decreased at low and high frequencies. The estimated upper and lower characteristic frequencies for electrode and particle charging in the conditions of this experiment
are 20 Hz and
m
τ
1
− e
τ ≈ −1
p ≈12 kHz, respectively. ………... 61
Figure 2.5. Average velocity of different size particles as a function of their
average diameter at 300 V/cm in 0.1 mM NaCl at a field frequency of 1 kHz. The data points were obtained by determining the velocity of 286 particles grouped by diameters within a 1.5 μ range. The line is a fit to equation (2-1) described in the main text. …………...
m
62
Figure 3.1. (a) Schematic illustration of the experimental cell with anisotropic
scale bar in (b) is 4 μm. ……….. 69
Figure 3.2. Dynamic and structural response of Janus particles to AC electric field
intensity versus field frequency in a thin experimental cell. In the optical images, the gold-coated, conductive hemispheres appear dark and the bare, dielectric hemispheres appear light. The electric field direction is between the top and bottom of the optical images. The regions were established on the basis of 28 data points. ……… 72
Figure 3.3. Optical micrographs of (a) staggered chains formed at lower
concentration of Janus particles (5.7 μm diameter) in an AC field of 56 V cm-1 at 40 kHz and (b) concentrated staggered chains formed with a particle concentration enough to form a monolayer in an AC field of 27 V cm-1 at 40 kHz. The gold-coated, conductive hemispheres appear dark and bare, dielectric hemispheres appear light. The electric field direction is between the top and bottom of the images. The scale bars in (a) and (b) are 70 μm and 50 μm,
respectively. ……… 76
Figure 3.4. Optical micrographs of (a) a crystal of staggered chains, (b) a crystal
of two co-existing particle chain arrangements in an AC field of 125 kHz frequency and (c) three-dimensional bundles in an AC field of 50 kHz frequency. The gold-coated, conductive hemispheres appear dark and bare, dielectric hemispheres appear light. The electric field is applied in the vertical direction in the images. The scale bars in (a),
(b), and (c) are 50 μm. ……… 77
Figure 3.5. Number of particles as a function of the particle orientation angle, θ,
where the angle is determined by the angle between the gold/polystyrene interface and the direction of the electric field. Two high peaks in the angle distribution are observed at orientation angles of 0º and 180º, in-line with the direction of the electric field. ………... 79
Figure 3.6. Effect of orientation angle of the particle on the calculated potential
Figure 3.7. Simulations of the electric energy density contours around different
particle configurations (a-d) of four Janus particles in one half-cycle of an AC electric field and the effect of particle configuration of four particles on the potential energy difference (e). The bar to the right indicates the intensity of the electric energy density in a-d (in ) and the direction of the electric field is indicated on each simulation. The yellow arc represents the gold shell in (a)-(d). ………
3
m
J −
84
Figure 4.1. (A) Schematic of Janus particle fabrication by evaporation of a
magnetic coating onto a monolayer of latex colloid spheres on a substrate. (B) Experimental cell used to apply electric and magnetic
fields. ……….. 95
Figure 4.2. The metal coating on the particles was modeled by a crescent-shaped
difference between two circles with diameters equal to those of the particles, and the offset equal to the coating thickness. Schematic not to scale. The offset has been exaggerated for visual clarity. ………….. 98
Figure 4.3. Micrographs of assemblies of Janus particles with 8 nm evaporated Fe
layer on the surface. (A) Before the application of magnetic fields. (B) “Staggered” and (C) “Double” chains that form in a magnetic field of ~0.15 T. Both types of chains in (B) and (C) orient with the magnetic field, and rotate around their center of mass. (C)-(F) illustrate the rotation of an ensemble double chains. ………. 100
Figure 4.4. Dense staggered chains of Janus PS particles (4.1 μm in diameter with 34 nm thick Fe coating). At such high surface concentration, even upon removal of the chain-directing field, the chains largely keep
their orientation due to lack of space. ……… 102
Figure 4.5. Optical micrographs of (A) Particles in the absence of field. (B)
Particles assembled using AC electric fields (400 kHz, 25 V peak-to-peak). (C) Particle assemblies in a magnetic field of ~ 0.15 T. (D) The particles remain in chains after removal of the magnetic field. (D-inset) chains of particles with 8 nm Fe layer broken up by tapping on the experimental cell. (E) Particles with 34 nm Fe layer would not fall apart with tapping on the experimental cell, though (F) they disassemble after demagnetization with an AC coil. All scale bars =
20 μm. ……… 102
Figure 4.6. Modes of the interaction of magnetic, metallodielectric Janus particles
after removal of the electric field. (D) Following system (B) after removal of the magnetic field. The dark thin arc-shaped shell represents the gold coating (for applied electric fields) or iron coating (for applied magnetic fields) on one hemisphere of the polystyrene
core particle. ………... 104
Figure 4.7. (A) Magnetization hysteresis curves for 8 nm and 34 nm Fe coatings
on PS spheres. (B) Zoom of (A) near zero field shows the residual magnetization (MR) and coercive fields HC) for the samples. (C) Magnetization of a flat 8 nm Fe film in the direction parallel and perpendicular to the film. Virtually no magnetization is observed perpendicular to the film. (D) Magnetization of a flat 34 nm Fe film in the direction parallel and perpendicular to the film. ……….. 106
Figure 4.8. Simulations of the magnetic energy density contours in an applied
magnetic field around different magnetic Janus particle configurations: (A) Eight-particle staggered chain; (A-inset) Single particle with iron coating (on right side of particle) aligned in the direction of magnetic field; (B) Eight-particle double chain. The streamlines indicate the direction of the magnetic field and the density of the streamlines is proportional to the magnitude of the field. The yellow arcs represent the iron shell in (A) and (B). The simulations were performed at a low magnetic field strength (100 A/m), so that a higher permeability value of 520 (read from the magnetization hysteresis curve in Fig. 4.7A) in the iron coating could be used, which allowed the magnetic field streamlines around the particles to be
easily distinguished. ………... 108
Figure 5.1. Schematics of the GLAD process and DEP experimental cell with
SEM images of prepared patchy particles and an optical image of structures formed in an electric field. (A) and (B) The patch size is controlled by the angle of vapor deposition and two patches can be deposited on the poles of a particle by inverting the particle monolayer. SEM images of (A) 11% single-patch particles and (B) one two-patch particle with patches of 25% each. (C) Schematic of the DEP chamber with coplanar electrodes. Optical image of regular, straight chains assembled from 11% single-patch particles in an applied AC electric field of ~ 60 V cm-1 at low frequency (1 kHz). The scale bars represent 1 μm in the SEM images in (A), (B) and 20 μm in
Figure 5.2. Optical micrographs of perpendicular chains of single-patch particles
and diagonal chains of two-pole patchy particles. (A) The 11% single-patch particles form perpendicular, parallel, and staggered chains in applied AC electric field of ~ 170 V cm-1 at 400 kHz. (B) An example of a structure formed in an AC field of ~ 150 V cm-1 at 400 kHz. The inset illustrates the hypothesis that these assembly patterns result from interactions between the induced dipoles in the gold patch and the polystyrene core of similar magnitude but in opposite direction. (C) The two-pole patchy particles (25% patch on each pole) form diagonal chains in an AC field of ~ 110 V cm-1 at 400 kHz. The inset illustrates how induced dipoles within the gold and polymer parts might lead to the formation of diagonal chains. In all optical images (A)-(C), the electric field direction is between the top and bottom of the image and
the scale bars represent 20 μm. ……….. 121
Figure 5.3. Optical micrograph of structures assembled from single-patch
particles with smaller diameters. The particles of 2.4 μm diameter have a single patch of 11% and form perpendicular chains in AC electric field of ~ 190 V cm-1 at 400 kHz. The electric field direction is between the top and bottom of the image and the scale bar represents
20 μm. ……… 124
Figure 5.4. Optical micrographs of 2D percolated network structure formed by
11% single-patch particles and 2D lattice of two-pole patchy particles. (A) At a larger surface fraction the 11% single-patch particles form a 2D percolated network with void space in an applied AC electric field
of ~ 200 V cm-1 at 1 MHz. (B) At an even higher particle
concentration the two-pole patchy particles form a close-packed structure of rhombic symmetry in an AC field of ~ 40 V cm-1 at 400 kHz. In both optical images (A) & (B), the electric field direction is between the top and bottom and the scale bars represent 20 μm. …….. 126
Figure 5.5. Simulation results for a single and two 11% single-patch particles and
The two minima correspond to the two experimentally observed configurations in the parallel and perpendicular chains. ……… 128
Figure 5.6. Optical micrograph and simulation results of structures from 11%
single-patch 5 μm particles formed at low frequency AC electric fields. (A) The particles form regular, straight chains in applied AC electric field of ~ 55 V cm-1 at 0.5 kHz. Two-pole patchy particles also form regular, straight chains when such low frequency AC fields are applied. (B) effect of the angle between two 11% single-patch particles on their potential energy difference at an AC field of 1 kHz frequency. The chains parallel to the field direction are the most favorable at low frequency AC fields. In the optical image in (A) the electric field direction is between the top and bottom of the image and
Chapter 1
General Introduction of Particle-localized AC and DC
Manipulation and Electrokinetics*
________________________
1.1. Introduction: Major AC and DC Effects in Water-based Systems
The area of the assembly of sub-micrometer and micrometer-sized particles has seen rapid growth in past decade. Particles can be manipulated and assembled by a variety of forces including hydrodynamic liquid drag, electrostatic repulsion and van der Waals attraction, capillary forces acting on fluid surfaces, and gravitational forces. The recent experimental advances in the areas of microfluidics, nanoscience, Lab-on-a-Chip systems, and microelectromechanical systems (MEMS) have kindled an intense interest in the motion, assembly and manipulation of particles by electrical fields. Colloidal particles suspended in water exhibit a wide range of phenomena when subjected to direct (DC) or alternating current (AC) fields, which arise from particle polarization, motion of the ions in the electric double layer coupled with fluid flow, and forces resulting from gradients in the field.
The primary focus of my graduate research has been to understand fundamental principles of and develop tools and techniques for assembly and manipulation of anisotropic colloidal particles (having physical or chemical properties that are directionally dependent) by applied external electric and magnetic fields. The experimental advancements in the last few years have made possible the fabrication of particles of well-defined shape, anisotropic polarizability or nonlinear conductance. These particles respond to external fields in a variety of ways, which may include directional motion or self-assembly in new types of lattices. This
chapter overviews the different mechanisms by which such particles respond to the fields and
provide examples of how they can be used to assemble new materials and create new self-propelling microdevices.
A summary of the types of systems and effects discussed in this chapter is presented
in Fig. 1.1. We first examine the origin of the conventional electrophoretic motion of particles in DC fields (Fig. 1.1a). The interaction of particles with non-uniform AC electric
section. While regular symmetric particles do not respond to uniform AC fields, asymmetric
particles can move in low frequency alternating electric fields by effects such as
‘‘induced-charge electrophoresis’’ (ICEP) or AC particle electrophoresis (as discussed in Chapter 2), caused by electric field gradients leading to unbalanced liquid flows around the particle
surface (Fig. 1.1d). In the last section of this introduction, we will present a new effect,
where semiconductor diodes acting as particles rectify an external AC field and propel against the liquid by local electroosmotic flows along the particle surface (Fig. 1.1e).
Figure 1.1. Schematics of a few categories of particle-localized DC and AC electrokinetic
phenomena. (a) Electrophoresis—upon application of a DC field, particles migrate toward the electrode of opposite charge. (b) Dielectrophoresis—particles are attracted to or repelled from the highest electric field intensity region due to interaction of induced dipole with the gradient of a DC or AC electric field. (c) Dielectrophoretic assembly of anisotropic particles occurring in higher frequency (> 10 kHz) electric fields. (d) Induced-charge electrophoresis (ICEP)—unbalanced electroosmotic flows around the Janus particles surface resulting from different electrical properties of each hemisphere causes the particles to move normal to
1.2.Electrophoresis
1.2.1. DC Particle Electrophoresis
Electrophoresis and electrokinetic phenomena were first observed by Reuss in the early 19th century.1 He found that liquid water in a tube filled with quartz sand starts moving if an external electric field is applied on both ends. In a second experiment he found that suspended clay particles will directionally migrate under the action of an electric field. The
first phenomenon is known as electro-osmosis while the second as electrophoresis. While Ruess was unable to suggest a quantitative explanation of these phenomena it was clear that the quartz or the clay particles somehow ‘‘electrified’’ the water making it receptive to the externally applied field. The first attempt at quantifying electro-osmosis was done by Widenmann,2 who demonstrated that the electroosmotic bulk flow rate is linearly proportional to the electric current that passes through the channel. Later, Quincke showed that if fluid is forced through a microchannel or porous plug by applying a pressure drop a
potential difference arises between the ends.3 This effect is somewhat inverse to
electro-osmosis and the resulting potential is known as streaming potential. A phenomenon that is in a similar way opposite to electrophoresis was discovered by Dorn.4 When particles settle due
to gravity a potential difference might develop between the top and bottom of the tube where
the settling takes place. This difference is known as sedimentation potential. All the above
observations are part of the so-called electrokinetic phenomena.
solid in a laminar electroosmotic flow. Helmholtz derived the following expression for the electroosmotic velocity Ueo
E U
η εε Ψ −
= 0
eo (1-1)
where Ψ is the potential drop across the capacitor at the interface, ε0 = 8.854×10⁻¹² F m-1 is
the dielectric constant of vacuum, ε is the dielectric permittivity of the solvent (equal to 78.3
for water at room temperature T = 298 K), η is the solvent viscosity and E is the externally
applied electric field magnitude.
Figure 1.2. Schematic of the origins of electrophoresis of a negatively charged particle in a
DC electric field. The zoomed in area on the right side of the particle reveals the electric double layer at the particle surface with the surface charge, the layer of bound counterions, the Stern layer and the diffuse layer. The variation in electrical potential with distance x away from the surface is also shown.
1.2.2. Development of Electrokinetic Theory
field in a straight capillary follows the shape of the potential distribution. Further he showed that for electric double layers that are much smaller than the channel width the precise shape of the electrostatic potential is irrelevant. Finally he pointed out that the important
electrostatic property at the interface is not the potential drop Ψ but rather a different quantity
historically known as ζ (zeta) potential. This is the potential at the plane of shear where the
fluid starts moving relative to the solid surface or vice versa (Fig. 1.2). Smoluchowski has
accounted for the diffusion distribution of the dissolved ions in the vicinity of the solid
surface by relating the local electrostatic EDL potential Ψ to the local charge density ρe via
the Poisson-Boltzmann equation
⎟ ⎠ ⎞ ⎜ ⎝ ⎛− Ψ − = − = Ψ ∇
∑
kT e z n z e i i i i exp 0 0 0 e 2 εε εε ρ . (1-2)For flat (or thin) EDL the velocity field and the electrostatic potential are similar, which means that
(
)
Ev= ∇ Ψ
∇ 2
0 2 εε
η . (1-3)
Note that this approach assumes that the EDL potential Ψ is independent on the external field
E and vice versa. This is a reasonable approximation for the cases where the field in the EDL
is much greater than the externally applied one and works particularly well for straight capillaries where the external field vector is normal to that in the EDL.7
Smoluchowski solved eqn. (1-3) for the case of electrophoretically moving particles with very thin EDL in which case the problem is one-dimensional and reads
E dx d dx v d 2 2 0 2 2 Ψ =εε
η . (1-4)
where ν is the tangential component of the velocity. The boundary conditions are
. 0 at and 0 at , 0 , 0 ep = = Ψ = ∞ → = = Ψ = x v x U v dx d dx dv ζ (1-5)
∞ →
= E R
U κ η ζ εε , p 0
ep . (1-6)
where ζp is the electrokinetic potential (zeta-potential) of the particle and κ-1 is the Debye screening length. Another extreme is the situation where the particle radius is much smaller than the EDL thickness. This case was analyzed by Huckel who obtained a different relationship for the electrophoretic velocity8
0 ,
3 2 0 p
ep = E R→
U κ
η ζ εε
. (1-7)
The difference between expressions (1-6) and (1-7) is due to the fact that in the thin EDL case the main resistance to the particle motion is the electrophoretic retardation while for large EDL the dominant resisting force is viscous friction.7 The intermediate case was studied by Henry9 who suggested the following equation for the electrophoretic mobility
( )
( )
( )
( ) ( ) ( )
( ) ( )
( )
exp( )
.exp 96 8 96 96 48 5 16 1 where 3 2 6 4 5 4 3 2 1 1 p 0 ep ep dt t t R R R R R R R a f R f E U R
∫
∞ − ⎥ ⎦ ⎤ ⎢ ⎣ ⎡ − − + − − + = = = κ κ κ κ κ κ κ κ κ κ η ζ εε μ (1-8)Ohshima suggested the following much simpler empirical formula10 for the correction function f1(κR) which is accurate within 1% when compared to Henry’s result
( )
(
( )
)
31 2 1 2exp
5 1 2 1 1 − ⎭ ⎬ ⎫ ⎩ ⎨ ⎧ ⎥⎦ ⎤ ⎢⎣ ⎡ + + + = R R R f κ κ
κ . (1-9)
Additional complication in the theoretical analysis of electrokinetic phenomena follows from the possibility of EDL polarization from the electric and hydrodynamic velocity fields. In this case the ionic distribution is no longer described by the equilibrium Poisson-Boltzmann eqn. (1-2). Instead one needs to solve the more general Poisson equation
(
)
∑
+ + − − − − = − = Ψ ∇ i i i i i n z nwhere the ionic concentrations ni+ and ni- are determined from the respective mass balance11 v j j ± ± ± ± ± ± ± − ⎟⎟ ⎠ ⎞ ⎜⎜ ⎝ ⎛ ∇ ∇ − = = ⋅ ∇ + ∂ ∂ i i i i i i i n kT e z n D t n ψ m ,
0 . (1-11)
The velocity field v is obtained from solving the Navier–Stokes equations for the flow
around an electrophoretically moving particle.12,13
The electrophoretic motion of particles in DC fields has been used for many years for measuring their ζ-potential. One complication in the experimental implementation of such measurements is the background electroosmotic mobility of the liquid in the channels. Avoiding the electroosmotic drift requires that the velocity of particles is measured in the stagnant layer of fluid situated at a certain distance away from the walls. The manipulation of particles by DC fields is thus always complicated by the background electroosmotic flows. The AC dielectrophoresis described in the next section has proven to be more convenient and straightforward to implement and control.
1.3. AC Dielectrophoresis
1.3.1. Principles of Dielectrophoresis
Almost any type of particle in any type of media can be manipulated using alternating voltage. AC electric fields, as opposed to DC fields, have the advantage of permitting high
field strengths without water electrolysis and largely avoiding electro-osmotic currents.14,15
The forces that the AC electric fields exert on particles can be efficiently controlled by
adjusting field parameters such as magnitude, frequency, wave shape, wave symmetry, and
phase.14,16—18 The origin of the AC effects is the frequency-dependent polarization of
particles in AC fields applied across suspensions. The sign and magnitude of the dipoles induced in the particles are given by the real part of the Clausius–Mossotti function, K
(
)
(
)
2(
2 2)
1 2 1 2 2 1 1 2 1 2 1 2 3 2 Re MW MW K τ ω σ σ τ σ ε σ ε ε ε ε ε + + − + + −
where ε1 and σ1 are the dielectric permittivity and conductivity of the media, and, ε2 and σ2 – of the particles.15,19 Metallic and highly conductive particles are always strongly polarized (with Re(K) > 0) at most AC field frequencies. The Clausius–Mossotti factor for metallic
particles approaches the limit of its maximum value at K=1.
The frequency-dependant polarizability response of dielectrics is given in their
complex permittivity (which is a function of AC field frequency, ω,
ω σ ε ε
ε~= o r −i( )), where
o
ε is the dielectric permittivity of vacuum (8.854×10⁻¹² 2 −1 −2 m N
C ), εr is the relative
permittivity, i is the imaginary unit and σ is the electrical conductivity.15 The electrical
double layer around particles dispersed in water is more polarizable than the media at low field frequencies because of the high conductance of the counterionic atmosphere. Even dielectric particles whose bulk permittivity is lower than the water media, exhibit higher polarizability at low frequencies (Re(K) > 0) because of the strong polarization induced in the
double layer with higher conductivity then the media. For such dielectric particles in water, however, the Clausius–Mossotti function changes sign (i.e., the dielectrophoretic force discussed below changes from attractive with Re(K) > 0 to repulsive with Re(K) < 0) at a
crossover frequency of ωc =τMW−1 ,
16,19 where
MW
τ is the Maxwell-Wagner charge relaxation
time 1 2 1 2 2 2 σ σ ε ε τ + + =
MW . Such a frequency-dependent change of the sign of the interactions is
commonly observed with synthetic microspheres and live cells in water14,16,20—28 and allows a high degree of control of the induced forces. The strength of the electric field-induced dipole in particles has been calculated numerically using the electrokinetic theory of Mangelsdorf and White29,30 and the values for Re(K) have been obtained for both static and
oscillating fields.31 The impedance of the double layer is also frequency-dependent and can alter the electric field strength and distribution shape near the electrodes, shifting the field maxima and minima location as a function of field frequency.32
each homogenous particle, FDEP, is dependent on the gradient of the field squared, ∇E2 and
the radius cubed (effectively volume) of the particle, r3,15,19—22,33,34
2 3
1Re ( )
2 rms
DEP K r E
Fr =
π
ε
ω
∇ (1-13)It is important to note that particles experience DEP force only in a non-uniform electric field and the DEP force does not depend on the field polarity. If the electric field is uniform, then the force acting on each of the poles of the induced dipole within the particles is equal and opposite and there is no net motion of the particle.15 Particle movement in field gradients occurs because the force acting on the two poles is not the same due to the gradient in the field. Particles that are more polarizable than the media (Re(K) > 0) are pulled along
the gradient into the areas of highest field intensities (positive DEP).15,19 Particles that are less polarizable than the media (Re(K) < 0) are pushed away from these areas (negative DEP).
Thus, dielectrophoresis allows for collection of particles or their levitation above the electrodes. DEP forces can occur in both AC and DC electric fields. In principle, DC dielectrophoresis results in the largest magnitude of the induced dipoles in the particles. However, large DC field strengths cannot be applied to aqueous media in an experimental cell as water electrolysis and DC electrophoresis can occur.
The extensive studies of dielectrophoresis originated with the work of Pohl.33 Wang
et al. derived a general expression for the DEP force using the Maxwell stress tensor method
and theoretical relationships to link the dielectric properties of a suspension of colloidal particles to dielectrophoretic behaviour exhibited by a single suspended particle.35—37 Washizu et al. provided multipolar DEP theory to express the net DEP force as the gradient
of a series of scalar electromechanical potential functions.38 Clague et al. recently used the
method of Green’s functions39,40 to develop an analytical solution calculating the gradient in the electric field strength produced by a two-dimensional array of parallel electodes.41 Single phase fluids do not experience DEP force. For multiphase systems however (e.g., particle suspensions) the total flux, ji, for component i with concentration ci is given by42
(
E E)
Ev
The first term on the right hand side of eqn. (1-14) corresponds to diffusion, the second
denotes the convective transport, the third term is the electromigration [μi being the
electrophoretic mobility, see eqn. (1-8)] and the last term is due to the DEP transport. The quantity νi has the equivalency of DEP mobility and for spherical particles obtains the form
πη ε ε ν
12
2 0
m R K
= (1-15)
The dielectrophoretic effects also lead to structuring when higher concentrations of particles are present between the electrodes. The dipoles induced in the particles interact with each other if the particles are close enough. The particles align in chains along the direction of the field lines. This “chaining” force, Fchain, is dependent on the field strength squared, E2
and the radius squared of the particle, r2
2 2 2 1r K E
C
Fchain=− πε (1-16)
where the coefficient C ranges from 3 to > 103 depending on the distance between the
particles and the length of the particle chain.14,16,19 The chaining force acting on particles of similar electrical properties is always positive and attractive. Particles of the same type always align along the field lines, regardless of whether their polarizability is higher or lower than the media, while mixtures of particles of lower and higher polarizabilities than the media could form various types of alternating chains in the perpendicular direction.15,43
the dielectric particles have enough time to follow each change in sign of the field direction and migrate in and out of the double layer to the bulk solution. The particles are attracted to each other (indicated by the high energy density red color) due to positive DEP (Fig. 1.3a).
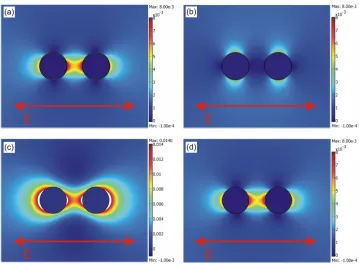
Figure 1.3. Simulations illustrating the electric energy density for a pair of polystyrene
particles with 100 nm thick counterionic atmosphere in (a) low frequency (1 kHz) AC field and (b) high frequency (100 MHZ) AC field and for a pair of conductive particles in (c) low frequency (1 kHz) and (d) high frequency (100 MHZ) AC field. The simulation demonstrates how latex particles subject to low frequency applied AC fields experience positive DEP due to the conductive nature of the induced electrical double layer. However, at high frequency AC fields the induced double layer does not have time to form and thus the particles are less polarizable than the media and experience negative DEP. The conductive particles are more polarizable than the media at the range of frequencies investigated. The bars to the right indicate the intensity of the electric energy density. The scale bar for (a), (b) and (d) are the same, whereas the scale bar for (c) has larger maximum and minimum. The direction of the AC electric field is shown with the double-headed red arrows.
permittivity value (as compared to the water media) determines the particles electrical properties. The particles experience negative DEP and the high field intensity is not at the poles of the particles in the direction of the electric field but rather at the particle equators (Fig. 1.3b).
The simulations also show that two conductive particles (of 5 μm diameter) are attracted to each other due to positive DEP at both the low (Fig. 1.3c) and high (Fig. 1.3d) AC frequency ranges since they are nearly infinitely polarizable and the Clausius–Mossotti factor approaches the limit of its maximum value. The simulation images reveal that at 1 kHz frequency the maximum electric energy density is approximately twice larger for the pair of conductive particles compared to the pair of dielectric particles (see scale bar on the right side of the simulation images in Fig. 1.3a and 1.3c), illustrating the difference in polarizability between the two types of particles. The electric energy density for the conductive particles at 100 MHz is similar to the dielectric pair at 1 kHz. Conductive particles located close to the electrodes will connect to the electrode and extend it further into the cell establishing an electric field gradient toward this particle.14 Other particles from the bulk solution will be attracted toward the particles contacting the electrode resulting in the formation of a conductive chains that will continue to grow toward the opposite electrode until the electrodes become short-circuited.14 The high energy density on the outside of the conductive particles (Fig. 1.3c), as well as between the particles, indicates that the particles could be attracted to near-by walls.
1.3.2. Applications of DEP in Particle Manipulation
research in DEP are focused on the sorting, trapping and manipulation of live cells51—68 and DNA69—80. Similar techniques also encompass the concentration of cells81,82 and molecules like DNA that otherwise would be difficult to detect.74 In one of the few applications of DC field dielectrophoresis, Lapizco-Encinas et al. have selectively concentrated and released live
and dead Escherichia coli bacterium using insulator-based (electrodeless) dielectrophoresis
(iDEP).83
DEP has served as basis of multiple separation techniques. It has been used to sort particle suspensions84 and to separate live cells and polymer spheres.20,51,55,57,63,85 The frequency-dependent cell membrane polarizability can be used to separate an incoming cell suspension into streams of live and dead cells and cells of different genotype in flow-through devices.24,26,52,55,86—91 Kim et al. used a deflection method to separate protein-bound
particles.92 Li et al. have found close agreement between experimental and modeling results
for a dielectrophoretic filter for bacteria, spores, yeast cells, and polystyrene beads.93 Krupke
et al. have used AC dielectrophoresis to develop a method to separate metallic and
semiconducting single-walled carbon nanotubes (CNTs) from suspension where the metallic CNTs experience positive DEP and the semiconducting CNTs experience negative DEP.94 Lee et al. have generated a three-dimensional electric field gradient to filter out and deposit
metallic CNTS from a mixture of semiconducting CNTs.95
More recently, researchers have synergistically combined DEP with other techniques within lab-on-a-chip and microfluidic devices. Chiou et al.96 have deployed optelectronic
Besides the collection and sorting of particles/molecules, the dielectrophoretic force has been used to manipulate and move larger objects such as droplets on high density liquid surfaces and semiconductor diodes (which will be discussed in Section 5 of this chapter). Earlier electrowetting devices move droplets by combining electrocapillarity with dielectrophoresis and effectively changing the contact angle of the droplet.99—111 This technique might have problems with surface fouling as the droplets are in direct contact with solid walls. To avoid that problem, our research group developed a new microfluidic chip based on dielectrophoretic manipulation of freely-suspended microdroplets floating on a denser, immiscible liquid. Each of the microdroplets suspended on the surface of high density fluorinated liquid and manipulated by the field can serve as a microscopic container and reactor.112 Controlled on-chip assembly, drying, encapsulation and polymerization were used to make anisotropic "eyeball" and striped supraparticles, polymer capsules and semiconducting microbeads.14,113 Our research group completed a detailed study on the liquid flow and particle distribution inside single floating microdroplets, combined with simulation of the heat and mass transfer inside the droplets.114 Finally, our group showed how the results of such “droplet engineering” could be used in new types of microbioassays.115
AC dielectrophoresis can also be an efficient tool for the organization and assembly of conductive and dielectric particles into functional structures. The assembly of isotropic particles (both conductive and insulating), live cells and Janus and patchy anisotropic particles is discussed in the next section.
1.4. AC Particle Assembly
1.4.1. Field-driven Assembly of Regular Particles
bilayers, liquid crystals and electric fields.116—133 New materials and devices may be developed by directed assembly of particle structures with electrical functionality.16,129—136 Biosensors and bioassays where particle structures directly interface electronic chips have a number of potential advantages compared to the present assays with optical detection.137—141 Unique opportunities emerge by combining these structures with the rapidly growing field of microfluidics.142—144 One of the major challenges in the particle assembly area is the development of techniques that are rapid and controllable. Many of the forces involved in spontaneous assembly, such as van der Waals, electrostatic and hydrophobic, are difficult to control and modify.145 One of the most effective solutions to this problem is the use of AC electric fields as a means of effecting and guiding the assembly.
The AC field-directed assembly of particles typically combines DEP with dipolar chaining force resulting in particle chains, crystals, and micro- or nanowires. Richetti et al.146
have used alternating electric fields to assemble ordered 2D aggregates of polyvinyl-toluene latex spheres by confining the particles in thin cells. Since this early work, AC fields have been used to organize 2D crystals by induced dipolar repulsion when polystyrene particles are confined into a thin gap of the order of their diameter.146—155 The research groups of Saville151,152 and Marr153—155 have performed similar AC field induced particle assembly studies. Our research group has been among the first to explore the potential and demonstrate the formation of electrically functional microdevices by interfacing colloidal assemblies with on-chip electronic circuits.137 Microscopic electronically readable biosensors were assembled
in situ from latex particles by combining dielectrophoresis with tuning of the colloidal forces.
Our group has previously also used DEP to assemble switchable two-dimensional photonic crystals of silica and polystyrene particles.14,16,134,135,156
protein molecules, gold nanoparticles functionalized with oligonucleotides, and metal nanowires and nanorods.14 Recently, CNTs have been arranged into highly aligned micro-probes for single-cell experimentation and delivery172 and into nanosensors for thermal sensing applications173.
Our research group has shown that 12-15 nm gold nanoparticles can be rapidly assembled from suspension into electrically conductive microwires using AC dielectrophoresis.174 A suspension of nanoparticles is placed in a thin experimental chamber (similar to the one depicted in Fig. 1.5a, but with a height of 0.1 mm) and AC electric fields are applied resulting in microwire growth from one electrode to the other, until the microwire bridges the inter-electrode gap and short circuits the electrodes.
Figure 1.4. Dielectrophoretic-driven assembly of conductive microwires from gold
The microwires possess ohmic conductance for both AC and DC currents and can be used to form self-repairing circuits in liquids.174 These electrically functional structures could have applications as chemical sensors or wet electronic and bioelectronic circuits. Using similar experimental setups, other researchers have studied the formation of microwires of conductive materials including colloidal gold, carbon black, and carbon nanotubes.175—177 Xiong et al.178 have used micro and nanoscale templates with AC electric fields to assemble
polystyrene nanoparticles and gold nanoparticles into nanowires. La Ferrara et al. have used
DEP to assemble palladium nanowires, which can operate as hydrogen sensors.179
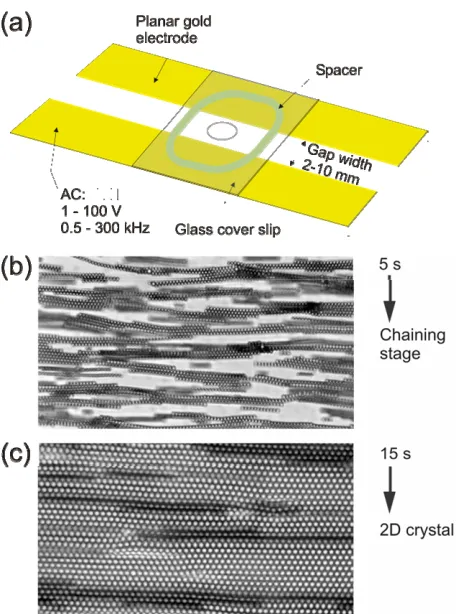
The AC dielectrophoretic assembly of dielectric particles can lead to colloidal crystal formation by the combined action of the dipole-field DEP and dipole-dipole chaining interactions. Our group has previously found that AC electric fields applied to latex or silica particle suspensions in a gap between planar electrodes lead to the rapid and reversible assembly of colloidal crystals.14,16,134,135,156 The experimental cell and the crystallization process are illustrated in Fig. 1.5. The hexagonal crystals that form are up to 25 mm2 in area and always have one axis aligned with the direction of the electric field.135
Figure 1.5. Assembly process of polystyrene microspheres in a thin experimental cell under
an AC electric field. (a) Schematic of a co-planar electrode experimental cell. The spacer can be created using Teflon tape or hydrophobic PAP pen yielding a cell height of 60-100 μm or 10-20 μm, respectively. (b,c) Optical micrographs illustrating the two-stage mechanism of crystallization for latex particles.135 (b) Shortly after the field is applied, the particles align in chains due to dipolar attraction. Simultaneously, the DEP force due to the field gradient attracts the particles to the high field intensity region. (c) The particle chains confined on the surface form 2D-hexagonal crystals aligned with one axis in the direction of the field.135 The particles in the micrographs are 1.4 μm in size.135
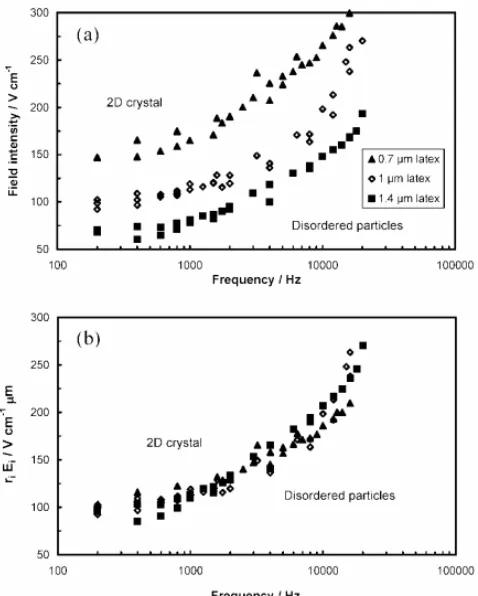
Figure 1.6. (a) Effect of AC field frequency on the field intensity required to crystallize latex
microspheres of three diameters (0.7, 1.0, and 1.4 μm).135 (b) Normalized data from (a) falling onto a single master curve with the radius by the field strength plotted as a function of frequency for a given particle type.135
At the highest frequency (20 kHz) studied, the field strength required to crystallize a given latex particle size was approximately twice larger than the crystallization field strength needed for the lowest frequency (200 Hz) studied.135 Particles could not be crystallized below 100 Hz frequency as their electrophoretic mobility becomes significant and the particles “vibrate”, following the direction of the field electrophoretically.135 At a fixed particle type and field frequency, weak dependence of particle size on the electric field intensity crystallization threshold of the particles is found by plotting riEi(from the chaining force eqn.
regardless of size, where k is the boltzmann constant).135 It is hypothesized that smaller particles (<0.7 μm diameter) could be made to crystallize at higher electric field intensities.135
Mittal et al.180 have recently reinterpreted the order-disorder transition which our
research group previously reported for micrometer-sized polystyrene particles. They have measured forces on the order of piconewtons between micrometer-sized polystyrene latex particles in AC electric fields and have found that the field strength required to assemble latex particles into a crystal increases with increasing field frequency and is dependent on the particle size, decreasing with particle diameter.180 Lele et al.181 have investigated the
transition of ordered structures to disordered bands and vortices formed in colloidal suspension systems under AC electric fields. Hoffman et al. have found experimental
evidence of distinct Stern-layer and diffuse-layer (which comprise the electrical double layer) conductance contributions to the DEP-induced particle polarization of polystyrene particles and have characterized the resulting DEP effects on colloidal assembly.182
Recently, Xie et al.183 have applied alternating electric fields using lithographically
templated electrodes to 3 μm diameter polystyrene particles to reversibly and rapidly assemble the colloidal particles into grid patterns. Herlihy et al. have used DEP to assemble
micrometer-sized monodisperse anisotropic polymer particles with disk, rod, fenestrated hexagon (hexnut), and boomerang shapes and found that these new shapes can result in
interesting packing and crystallization behavior.184 Winkleman et al. have assembled 100 μm
glass microspheres in AC electric field in a dry system that does not require suspending liquid.185 Zhang et al. investigated the pre- and post-nucleation processes of AC electric field
driven assembly on electrode surfaces for colloidal latex microspheres186 and characterized the formation of crystals of different size as a function of frequency187.
1.4.2. DEP Assembly of Biocomposite Materials from Live Cells and Particles
produce devices and materials with a high level of functionality, which cannot be produced by conventional dry microfabrication techniques. The fabrication of patterns and biomaterials from cells is of significant interest.188,189 Traditionally, similar biomaterials are fabricated by adsorbing proteins and live cells onto patterned surfaces.190,191 More recently, cell arrays have been formed on scaffolds made by microcontact printing with oligopeptides192—195, laminar flow patterning196,197 and dielectrophoresis.198 DEP has also been used for on-chip cell patterning.199 This area has attracted significant interest for tissue engineering200,201,202— 206 and development of biosensor technologies.207—209
Our research group demonstrated how AC dielectrophoresis can be used to assemble biocomposites from live cells and functionalized particles.210,211 Baker’s active yeast cells (Saccharomyces cerevisiae) in suspension can be readily organized in chains by the use of
DEP in the two-electrode cell (similar to the setup in Fig. 1.5a). However, cells collected by the field come apart when the voltage is turned off. These cells were bound into permanent structures by using functionalized nano- and microparticles as biocolloidal “glue” (Fig. 1.7a).210 These particles have on their surfaces chemically attached lectins (Concanavalin A), which bind selectively to specific polysaccharides on the outer cell membrane.210,211 The application of the AC fields in the low-frequency domain leads to incorporation of the particles into the cell chains and arrays, where they are trapped in the junctions between the cells and bind permanently to their surfaces. Consecutive application of the field in a second direction perpendicular to the first one in a chip with four point electrodes allows assembling closely packed single-layer cell membranes.
Figure 1.7. (a) Chain of live yeast cells and 0.95 μm diameter magnetic particles assembled
at 17 V mm-1 and 100 Hz, which can readily be rotated by an externally applied magnet. The scale bar size is 20 μm.210 (b) Simulation of the electric field distribution around assembled particle and cell chain at an AC field frequency of 100 Hz. The red color indicates higher field intensity whereas the blue color indicates lower field intensity.210,211 (c) Low microscope magnification optical micrograph of manipulation (folding) of a large magnetic yeast cell membrane by externally applied magnetic fields. The membrane is only one cell layer thick.210 (d) SEM of a closely-packed fixed yeast cell membrane bound together by Concanavalin-A functionalized microparticles.210
To reconstruct the dynamics of cell-particle assembly, our group computed the force on each particle by integration over its volume of the electrostatic force density, f, originating
in each element of the simulation space, =
∫
Particle Particle f dV
F .210,211 The electrostatic field
intensity is obtained from a finite element calculation of the set of PDEs for the system geometry using the COMSOL multiphysics modeling package (Fig. 1.7b), where Gupta et al.
cells.210,211 This force is used to calculate at the next stage the displacement of each particle by calculating the hydrodynamic resistance and the distance traveled per unit time. After the new particle configuration is established, the electrostatic field distribution is calculated again and the new set of forces is established; the loop is repeated iteratively until an equilibrium particle structure is reached. This procedure is broadly similar to a molecular dynamics simulation of the cell/particle motility under complex electrostatic interactions. The simulation was in good agreement with the experimentally observed dynamics of formation of alternating cell-particle structures at a frequency of 100 Hz. 210,211
By using lectin-coated magnetic microparticles as binding units, Gupta et al. were
able to manipulate the chains and membranes by external magnets.210,211 Examples of magnetic cell chains and membranes of size ≈ cm2 are shown in Fig. 1.7c with an SEM image in Fig. 1.7d.210 To potentially apply these materials, it is important to know whether the cells in the assemblies are alive and viable to the same extent as the freely suspended ones before the DEP treatment. Theoretically, fields used of a magnitude 50-100 V/cm should not damage the cells. These fields induce a potential difference of < 100 mV across a
typical 10 μm cell. This field is not lethal to live cells212,213 and is on the order of the ones routinely used in cell levitation experiments and in DEP-based separations of cells of various genotypes in continuous flow devices.22—26 By performing fluorescence tests of cell viability by the FUN-1 dye method, it was found that the proportion of metabolically active cells in
the biomagnetic arrays was approximately the same as the one in the original suspension (≈
90%).210,211
caused by toxins or changes in environment, artificial tissues for microsurgery, advanced vaccines and drugs, smart biomaterials or chemical sensors.210
1.4.3. Field-driven Assembly and Manipulation of Anisotropic Particles
1.4.3.1. Background on Janus, Patchy and Other Types of Anistropic Particles
The assembly of anisotropic particles and colloidal building blocks is a new research area with the goal to form novel materials. For more than 20 years, particle assembly has been achieved using isotropic spherical colloids composed of polystyrene latex or silica. These microspheres yield phases of simple symmetry such as hexagonally close-packed, face-centered cubic, and body-face-centered cubic crystals (sometimes using costly surface templating techniques to assemble the particles). There is growing recognition that anisotropic shape and interactions through "patchiness" could be used in the programmed assembly of engineered nanostructures.214 A plethora of anisotropic particles have been synthesized recently leading
to a variety of building blocks of different shapes, compositions, patterns and functionalities
(Fig. 1.8).214 These particles have yet to find applications because the methods to produce them lack high yields with the exception of natural and synthetic clay (laponite) disc-shaped particles in ceramics and polymer composites and metal oxide rod-shaped particles in magnetic storage materials.
"Janus" particles (whose halves are physically or chemically different) are a class of anisotropic colloids whose name was originally proposed by Casagrande and de Gennes.214— 216 Various methods for the synthesis of such particles have been developed.217—224 Thermal