University of Windsor University of Windsor
Scholarship at UWindsor
Scholarship at UWindsor
Electronic Theses and Dissertations Theses, Dissertations, and Major Papers
5-11-2018
Spark Energy and Transfer Efficiency Analyses on Various
Spark Energy and Transfer Efficiency Analyses on Various
Transistor Coil Ignition Systems
Transistor Coil Ignition Systems
Hua Zhu
University of Windsor
Follow this and additional works at: https://scholar.uwindsor.ca/etd
Recommended Citation Recommended Citation
Zhu, Hua, "Spark Energy and Transfer Efficiency Analyses on Various Transistor Coil Ignition Systems" (2018). Electronic Theses and Dissertations. 7456.
https://scholar.uwindsor.ca/etd/7456
This online database contains the full-text of PhD dissertations and Masters’ theses of University of Windsor students from 1954 forward. These documents are made available for personal study and research purposes only, in accordance with the Canadian Copyright Act and the Creative Commons license—CC BY-NC-ND (Attribution, Non-Commercial, No Derivative Works). Under this license, works must always be attributed to the copyright holder (original author), cannot be used for any commercial purposes, and may not be altered. Any other use would require the permission of the copyright holder. Students may inquire about withdrawing their dissertation and/or thesis from this database. For additional inquiries, please contact the repository administrator via email
Spark
Energy and Transfer Efficiency Analyses on Various Transistor
Coil Ignition Systems
By
Hua Zhu
A Thesis
Submitted to the Faculty of Graduate Studies
through the Department of Mechanical, Automotive and Materials Engineering in Partial Fulfillment of the Requirements for
the Degree of Master of Applied Science at the University of Windsor
Windsor, Ontario, Canada
2018
Spark
Energy and Transfer Efficiency Analyses on Various Transistor
Coil
Ignition Systems
By
Hua Zhu
APPROVED BY:
______________________________________________ X. Chen
Department of Electrical & Computer Engineering
______________________________________________ D. Ting
Department of Mechanical, Automotive & Materials Engineering
______________________________________________ M. Zheng, Co-Advisor
Department of Mechanical, Automotive & Materials Engineering
______________________________________________ X. Xu, Co-Advisor
Department of Civil & Environmental Engineering
iii
DECLARATION OF ORIGINALITY
I hereby certify that I am the sole author of this thesis and that no part of this thesis has
been published or submitted for publication.
I certify that, to the best of my knowledge, my thesis does not infringe upon anyone’s
copyright nor violate any proprietary rights and that any ideas, techniques, quotations, or
any other material from the work of other people included in my thesis, published or
otherwise, are fully acknowledged in accordance with the standard referencing practices.
Furthermore, to the extent that I have included copyrighted material that surpasses the
bounds of fair dealing within the meaning of the Canada Copyright Act, I certify that I have
obtained a written permission from the copyright owner(s) to include such material(s) in
my thesis and have included copies of such copyright clearances to my appendix.
I declare that this is a true copy of my thesis, including any final revisions, as approved by
my thesis committee and the Graduate Studies office, and that this thesis has not been
iv
ABSTRACT
The ever-growing demands to meet the exhaust emission regulations and fuel economy
requirements have driven the development of modern spark ignition (SI) engines towards
lean/diluted combustion strategies and engine downsizing. Currently, the transistor coil
ignition (TCI) system is still the dominant ignition system applied in SI engines. However,
the new development in SI engines demands higher spark energy and longer discharge
duration to overcome the unfavorable ignition conditions caused by the diluted in-cylinder
charge and the increased back pressure. Under these circumstances, higher energy transfer
efficiency of the ignition system is also desirable. Therefore, this work investigates the
factors that affect the spark energy and transfer efficiency of the TCI system.
The primary current, discharge current and spark gap voltage of the TCI system under the
single-coil single discharge and dual-coil offset discharge strategy were measured. Based
on the measurement, the spark energy and transfer efficiency were calculated. A numerical
model was developed and demonstrated the capability to estimate the trend of spark energy
and transfer efficiency of the TCI system. The model was then used to systematically
analyze the effects of coil inductance and charging duration/frequency on the spark energy
v
DEDICATION
This Thesis is dedicated to my parents, Shiming Zhu and Lianxiang Xu, and my brother,
Rong Zhu, who have always been supportive while I pursue my goal.
Also, to my husband, Li Liang and my daughter, Kexin Liang. Without your love and
vi
ACKNOWLEDGEMENTS
I am sincerely grateful to my supervisors, Dr. Ming Zheng and Dr. Xiaohong Iris Xu, for
their support, encouragement, and guidance throughout my Master’s degree studies at the
University of Windsor. Their wisdom and enthusiasms for research have inspired me to
face every challenge encountered throughout the development of this thesis.
Thanks to all my dear colleagues at the Clean Combustion Engine Laboratory, Dr. Meiping
Wang, Dr. Xiaoye Han, Dr. Shui Yu, Dr. Xiao Yu, Kelvin Xie, Dr. Tongyang Gao, Dr.
Pasad Divekar, Shouvik Dev, Zhenyi Yang, Qingyuan Tan, Geraint Bryden, Christopher
Aversa, Mark Ives, Divyanshu Purohit and Navjot Sandhu, your enormous support has
been greatly appreciated. I would like to thank Dr. Shui Yu and Dr. Xiao Yu for their
invaluable advice. I also want to thank Qingyuan Tan for his assistance with the simulation
modeling and programming. I would like to thank Zhenyi Yang and Shouvik Dev for their
help with the experiments.
Finally, I would like to thank my family ̶ my parents, my husband and my daughter for
vii
TABLE OF CONTENTS
DECLARATION OF ORIGINALITY ... iii
ABSTRACT ... iv
DEDICATION ...v
ACKNOWLEDGEMENTS ... vi
LIST OF TABLES ...x
LIST OF FIGURES ... xi
LIST OF SYMBOLS AND ABBREVIATIONS ... xiii
CHAPTER 1. INTRODUCTION ...1
1.1 Background ...1
1.2 Challenges on the ignition system of modern SI engines ...1
1.3 Ignition process in SI engines ...3
1.4 Transistor coil ignition (TCI) system ...5
1.5 Objective of the thesis ...9
1.6 Structure of the thesis...10
CHAPTER 2. EXPERIMENTAL SETUP ...11
2.1 Multi-coil ignition research platform ...11
2.1.1 Constant volume combustion chamber with optical access ...12
2.1.2 Multi-coil ignition system ...12
2.2 Impedance analyzer ...14
viii
CHAPTER 3. TCI SYSTEM WITH SINGLE-COIL SINGEL DISCHARGE...17
3.1 Overview of the TCI system ...17
3.2 Current and voltage measurement and energy transfer calculation ...19
3.2.1 Measurement methods of the current and voltage ...19
3.2.2 Calculation of energy and transfer efficiency of the TCI system ...23
3.3 Modeling of the TCI system ...27
3.3.1 Modeling of the equivalent gap resistance...27
3.3.2 Modeling of the TCI circuit ...30
3.3.3 Validation of the TCI model ...35
3.4 Parametric analyses of impact of coil inductances ...38
CHAPTER 4. TCI SYSTEM WITH ADVANCED DISCHARGE STRATEGIES ...43
4.1 Overview of the advanced discharge strategies ...43
4.2 Single-coil repetitive discharge strategy ...43
4.3 Dual-coil discharge strategy ...45
4.3.1 Dual-coil simultaneous discharge strategy ...45
4.3.2 Dual-coil offset discharge strategy ...46
4.4 Single-coil single discharge vs. dual-coil offset discharge ...48
4.5 Parameter analyses of the dual-coil offset discharge strategy ...51
4.5.1 Impacts of charging duration and charging frequency ...51
4.5.2 Impacts of coil inductances ...56
CHAPTER 5. CONCLUSIONS AND FUTURE WORK ...60
5.1 Conclusions of thesis work ...60
5.1.1 Method for electrical characteristics measurement of TCI system ...60
5.1.2 TCI system with single-coil single discharge strategy ...60
ix
5.2 Future work ...61
REFERENCE ...63
x
LIST OF TABLES
Table 2.1 Specification of E4990A impedance analyzer [24] ... 14
Table 2.2 Parameters of ignition coils used in this study ... 16
xi
LIST OF FIGURES
Figure 1.1 Schematic of the breakdown phase [36] ... 4
Figure 1.2 Waveforms of single-coil repetitive discharge process [14] ... 7
Figure 1.3 Waveforms of dual-coil offset discharge process [14] ... 8
Figure 2.1 Multi-coil ignition research platform ... 11
Figure 2.2 Connection between the coil and spark plug of the multi-coil system ... 12
Figure 2.3 Measurement circuit of the primary /secondary winding inductance ... 14
Figure 2.4 Measurement circuit of the leakage inductance ... 15
Figure 3.1 A simplified schematic of the TCI system ... 17
Figure 3.2 Discharge current and gap voltage waveforms of the glow phase ... 18
Figure 3.3 Electric circuit of the conventional TCI system ... 20
Figure 3.4 Discharge voltage from upstream and downstream measurement ... 21
Figure 3.5 Discharge current from upstream and downstream measurement ... 22
Figure 3.6 Spark energy from upstream and downstream measurement ... 23
Figure 3.7 Charge and discharge characteristics of Coil A and Coil E ... 26
Figure 3.8 Empirically derived results of the equivalent gap resistance ... 29
Figure 3.9 Curve fitting results of the equivalent gap resistance ... 30
Figure 3.10 Electric circuit used for TCI model derivation ... 31
Figure 3.11 Electric circuit of the charging process ... 32
Figure 3.12 Electric circuit of the discharging process ... 33
Figure 3.13 Modeling results of Coil A and Coil B ... 35
Figure 3.14 Spark energy and transfer efficiency of Coil A ... 36
Figure 3.15 Spark energy and transfer efficiency of Coil B ... 36
Figure 3.16 Spark energy and transfer efficiency of Coil D ... 37
Figure 3.17 Spark energy and transfer efficiency of Coil E ... 37
Figure 3.18 Energy transfer efficiency (Primary energy 50 mJ) ... 39
Figure 3.19 Energy transfer efficiency (Primary energy 100 mJ) ... 39
Figure 3.20 Energy transfer efficiency (Primary energy 150 mJ) ... 40
Figure 3.21 Relationship between the turn ratio and transfer efficiency ... 41
Figure 3.22 Relationship between charging duration and primary inductance ... 42
xii
Figure 4.2 Schematic of the dual-coil configuration used in this study... 45
Figure 4.3 Dual-coil simultaneous discharge strategy ... 46
Figure 4.4 Dual-coil offset discharge strategy ... 47
Figure 4.5 Waveforms of the single-coil single discharge ... 49
Figure 4.6 Waveforms of the dual-coil offset strategy ... 50
Figure 4.7 Energy and efficiency analyses of different discharge strategies ... 51
Figure 4.8 Dual-coil offset strategy under flow condition (f=1 kHz) ... 53
Figure 4.9 Dual-coil offset strategy under flow condition (f=2.5 kHz) ... 53
Figure 4.10 Discharge current under different charging frequency ... 55
Figure 4.11 Spark energy and transfer efficiency under different charging frequency .... 56
Figure 4.12 Verification of the dual-coil offset discharge model ... 57
Figure 4.13 Contour map of the spark energy ... 58
Figure 4.14 Contour map of the transfer efficiency ... 58
Figure 4.15 Contour map of the primary energy ... 59
xiii
LIST OF SYMBOLS AND ABBREVIATIONS
Symbols
𝐸𝑝 Electrical energy stored in the primary winding [mJ]
𝐸𝑝,𝑙𝑜𝑠𝑠 Resistive losses in the primary circuit [mJ]
𝐸𝑠𝑝𝑎𝑟𝑘 Electrical energy delivered to the spark gap [mJ]
𝐸𝑠,𝑙𝑜𝑠𝑠 Resistive losses in the secondary circuit [mJ]
𝐼𝑝 Primary current [A]
𝐼𝑠 Secondary current [mA]
𝐿𝑝 Inductance of the primary winding [mH]
𝐿𝑠 Inductance of the secondary winding [H]
𝑅𝑔𝑎𝑝 Equivalent resistance of the conductive plasma channel [Ω]
𝑅𝑝 Total resistance of the primary circuit [Ω]
𝑅𝑝_𝑐𝑎𝑏𝑙𝑒 Cable resistance of the primary circuit [Ω]
𝑅𝑝_𝑤𝑖𝑛𝑑𝑖𝑛𝑔 Resistance of the primary winding [Ω]
𝑅𝑝𝑙𝑢𝑔 Embedded resistance of the spark plug [Ω]
𝑅𝑠 Total resistance of the secondary circuit [Ω]
𝑅𝑠_𝑐𝑎𝑏𝑙𝑒 Cable resistance of the secondary circuit [Ω]
𝑅𝑠_𝑤𝑖𝑛𝑑𝑖𝑛𝑔 Resistance of the secondary winding [Ω]
𝑈𝑔𝑎𝑝 Voltage drop across the spark gap [V]
𝑈𝑝 Voltage drop across the primary winding [V]
𝑈𝑠𝑠 Supply voltage [V]
η Energy transfer efficiency of the TCI system [%]
Abbreviations
CAFE Corporate Average Fuel Economy
CI Compression Ignition
xiv
DCO Dual Coil Offset
EGR Exhaust Gas Recirculation
EPA Environmental Protection Agency
FPGA Field Programmable Gate Array
GHG Green House Gas
IGBT Insulated Gate Bipolar Transistor
NOx Oxides of Nitrogen – NO and NO2
RT Real Time
SI Spark Ignition
TCI Transistor Coil Ignition
1
CHAPTER 1.
INTRODUCTION
1.1 Background
The spark ignited (SI) combustion technology is one of the dominant powertrain
technologies for light duty vehicles. In 2016, non-hybrid gasoline cars powered by SI
engines accounted for 97% of new light duty vehicle sales in the United States [1-2].
SI engines have advantages over compression ignition (CI) engines regarding the exhaust
after-treatment processes but suffering from thermal efficiency losses. Nevertheless, the
legislative requirements for the fuel efficiency and exhaust emissions are continuously
tightened. In the United States, EPA has set up the Corporate Average Fuel Economy
(CAFE) standards to regulate the fuel economy for vehicles in recent years. Furthermore,
some governments around the globe have established or proposed greenhouse-gas (GHG)
emission standards to regulate the CO2 emission. These markets in those countries covered
80% of the global passenger vehicle sales, thus the fuel efficiency and CO2 emission
regulations influence the business decisions of most major vehicle manufacturers [3].
1.2 Challenges on the ignition system of modern SI engines
The enhancement of fuel economy and the reduction of CO2 emission imposed severe
challenges on the development of modern SI engines. Advanced technologies and
strategies have been deployed in recent years to improve the fuel efficiency of SI engines.
Lean and stratified combustion, along with engine downsizing using turbocharging, are
employed to reduce the pumping work by less throttling, especially at lower engine loads.
2
of naturally aspirated engines. The tendency of knocking prevents an optimum combustion
phasing [4-6].
Regarding knocking suppression, different techniques have been proposed, as reported in
literatures. Among them, the exhaust gas recirculation (EGR) is considered to be a
promising technique [7-8]. EGR, by introducing a percentage of exhaust gas to the fresh
charge at the engine intake, was commonly used in diesel engines for the reduction of NOx
because of lowered flame temperature [10]. Nowadays, EGR is also applied in SI engines
to contain the NOx formation and to improve the engine efficiency under partial load. At
high load, EGR could lower the burnt gas temperature by means of charge dilution, which
reduces knocking risks [9-10]. Therefore, engine downsizing, lean/diluted, and stratified
combustion are considered to be the promising techniques for future SI engines.
However, the implementation of the above-mentioned strategies brings unfavorable
conditions for the complete combustion of the cylinder charge. An excessive lean mixture
reduces the opportunities of forming an ignitable composition in the vicinity of the spark
gap; the EGR and/or air dilution reduce the flame propagation speed, which makes ignition
more difficult. All of these cause slower burning rates, leading to partial burns or even
misfires. Significant cycle-to-cycle variations were often observed, because strong air
motion was often implemented to enhance mixing and flame propagation [6] [11-12]. The
increase of the cylinder pressure, which is often associated with turbocharging or
supercharging, also leads to higher gas densities at the ignition site, which in turn requires
3
To ensure stable ignition and fast burn under the above-mentioned conditions, the
stabilization of ignition and initial combustion is of great importance. Therefore, the
current ignition system of SI engines should be improved substantially.
1.3 Ignition process in SI engines
In SI engines, the ignition of the air-fuel mixture is initiated with a spark discharged plasma
which creates a flame kernel. The flame kernel succeeds evolving in a self-sustaining
manner by the energy release of combustion, in addition to the concurrent plasma
expansion. Generally, the spark discharge process of the ignition system is considered in
three phases: the breakdown phase, the arc phase and the glow phase [6].
Breakdown phase
Prior to the breakdown, the electrical field is built up between the electrodes of a spark
plug. The increasing electrical field starts accelerating thermal electrons towards the anode.
If the electrical field strength is high enough, the electrons will ionize molecules in the
collisions and generate an avalanche-like increase in electrons and ions. In addition, low
wavelength UV-radiation is being emitted by the excited atoms. Ionized streamers travel
from one electrode to the other, building up conductive plasma channels between the
electrodes of the spark plug. When the conduction is built between the opposing electrodes,
the impedance in the between would decrease drastically. Figure 1.1 shows the schematic
of the breakdown phase. The energy from the parasitic capacitor inside the spark plug is
released. The breakdown phase proceeds under high-voltage (e.g. ~ 10 kV), high-peak
4
Figure 1.1 Schematic of the breakdown phase [36]
Arc phase
The breakdown phase is always followed by an arc phase. The energy stored inside cable
and coil capacitances are released during the arc phase. The characteristics of the arc phase
are controlled by the external impedance of the ignition circuit. For instance, the voltage
across the electrodes is about 100 V and the current is greater than 100 mA. The arc phase
is sustained by electrons emitted from the cathode hot spots thus it may cause erosion of
electrodes [15].
Glow phase
As the current reduces, e.g. to less than 100 mA, the spark discharge transfers into a glow
phase. The voltage drop between electrodes is typically 300 to 500 V [6] [15]. The glow
energy is dictated mainly by the ignition coil. The glow phase generally lasts for a few
milliseconds. During this long-lasting low-current discharge, the ignition circuit releases
most of the electrical energy ̶ in the order of tens of millijoules or higher[6] [15]. Due to
5
In case of strong air motion involved, the cross flow will stretch the plasma, causing a
longer plasma channel with higher line resistance between the electrodes. If the flow
velocity is high enough, the long plasma channel will be blown out and restrikes across the
gap may occur.
1.4 Transistor coil ignition (TCI) system
Research results have shown that a stronger thermal expansion from a high energy spark
discharge can help ensure that the flame kernel reaches a threshold radius which is believed
to be critical for the flame kernel to evolve to self-sustainability. High energy ignition
experiments have shown the effectiveness of extending the engine lean and dilution
operation limits [12].
Based on this, various high energy ignition concepts and systems are proposed and
developed in recent years. In practice, the improvements of the ignition processes are
employed either by an intensified breakdown discharge, e.g. by seeking a larger ignition
volume or a higher breakdown power, or by an enhanced energy delivery process during
the glow phase e.g. a higher level of discharge current or a longer discharge duration [17].
Despite the progresses achieved in the advanced ignition technology development, the
transistor coil ignition (TCI) system is still the most prevalent system currently applied to
SI engines. It is popular for its simplicity in design, low in cost and robust in performance.
The conventional TCI system mainly consists of a power supply, an inductive ignition coil,
a transistor switch and a spark plug. This type of inductive ignition system can reliably
provide the ignition energy at the selected time within one spark event for engines operated
6
energy delivery from a single coil single discharge event is limited because of the inherent
limit of energy storage. Under highly diluted or lean conditions, the conventional TCI
system may not supply enough electrical energy to the spark gap to realize robust ignition
control. Research results over the past also show that the typical decaying discharge current
profile of a conventional TCI system has drawback regarding combustion stability ̶
especially under high dilution and low load conditions [23]. Thus, the question for the
conventional TCI system arises whether it could be further improved to deliver more
energy to the spark gap and what are the most promising approaches for the future research
and development.
Aside from operating in the single-coil single discharge working mode, the ignition coil of
the TCI system can also work under a high-frequency mode. Based on this concept,
different advanced discharge strategies including single-coil repetitive discharge and
dual-coil offset discharge strategies have been developed and investigated recently [14] [18-21].
A single-coil repetitive discharge strategy is mainly based on the conventional TCI system.
By elevating the charging voltage from DC 12 V to a higher level, the ignition coil can be
charged and discharged several times within a certain duration. Piock [18] demonstrated
the development of a high frequency repetitive discharge ignition system incorporated into
the Delphi powertrain control system. Bae [19] investigated the discharge characteristics
of a high frequency multi-charge ignition strategy in flow conditions. Hese [20]
characterized the impact of the multi-charge ignition system on stratified charge
combustion and suggested that the improvement brought by this strategy was attributed to
the series of high-power breakdown events. Figure 1.2 shows the waveforms of the
7
Figure 1.2 Waveforms of single-coil repetitive discharge process [14]
The dual-coil discharge strategy uses two identical ignition coils connected to a common
spark plug with two diodes. The diodes are used to isolate the high-voltage interference
between the coils. According to different control strategies, these two coils can be charged
simultaneously or in an alternating way. Southwest Research Institute developed a
dual-coil offset (DCO) ignition system. In order to produce a long duration continuous spark
discharge, the two coils are set up to work under a specific time sequence repetitively.
Alger [21] employed the DCO ignition system on a 2.4 L 4-cylinder gasoline engine to
investigate the EGR diluted operation. The results showed that the DCO continuous
discharge extended the EGR tolerance by 5-10% over the conventional coil
single-0 2 4 6 8 Com m a nd (V ) Command Signal 0 1 2 3 4 P ri m a ry Curre nt (A ) Primary Current 0 10 20 30 40 50 S e c onda ry c urre nt (m A ) Secondary Current -6 -4 -2 0 2
-2 0 2 4 6 8 10 12 14
8
spark strategy. Chen [22] tested a variable output ignition system, with a similar
configuration of DCO system, on a 3.5 L V6 turbo-charge direct-injection gasoline engine.
The results showed that a long duration discharge could extend the dilution limit and reduce
the number of misfired cycles. Figure 1.3 is the waveforms of the dual-coil offset discharge
process [14].
Figure 1.3 Waveforms of dual-coil offset discharge process [14]
The advanced discharge strategies mentioned above are able to deliver more electrical
energy into the spark gap as desired. However, the TCI system, no matter the conventional
single-coil single discharge or the high-frequency discharge strategies, all suffer from high
resistive losses because of the high resistance of the components in the system.
0 2 4 6 8 Com m a nd (V )
Command Signal Coil 1
Coil 2 0 1 2 3 4 P ri m a ry Curre nt (A ) Primary Current 0 10 20 30 40 50 S e c onda ry c urr e nt (m A ) Secondary Current -6 -4 -2 0 2
-2 0 2 4 6 8 10 12 14
9
Taking the TCI system under single coil single discharge strategy as an example, the
resistive energy losses will rise non-linearly with the increase of the energy delivered to
the spark gap. For example, if 100 mJ energy is to be introduced into one cylinder and the
overall energy transfer efficiency of the ignition system is 5%, the energy delivered to the
primary winding of the ignition coil needs to be 2 J; for a four-cylinder engine working
under 6000 r/min, the average power demanded for the ignition system will be 400 W. This
means the average current will be more than 30 A if the primary charging voltage is DC
12 V, which will generate an excessive amount of heat in the ignition system [14].
In order to deliver electrical energy to the spark gap more efficiently, an energy analysis
originating from the power supply in the primary side to the remained electrical energy at
the spark gap is important. The electrical energy transfer efficiency, which is defined as
the ratio of the energy delivered to the spark gap to the total energy consumed in the
primary side, is a significant performance indicator for an inductive ignition system. The
higher energy transfer efficiency means more energy is available at the spark gap, and less
resistive losses in the electrical circuit.
1.5 Objective of the thesis
TCI systems are crucial for future high efficiency clean SI engines. The enhancement of
the existing system and the development of the advanced discharge strategies are both of
great importance. The objective of this work is to investigate the effects of coil inductance
and charging duration/frequency on the spark energy and transfer efficiency of the TCI
system under single-coil single discharge and dual-coil offset discharge strategies. The
primary current, discharge current and gap voltage of the TCI system were measured.
10
numerical model was developed and demonstrated the capability to estimate the trend of
spark energy and transfer efficiency of the TCI system. The model was then used to
systematically analyze the effects of coil inductance and charging duration/frequency on
the spark energy and transfer efficiency of the TCI system.
1.6 Structure of the thesis
This thesis is organized as follows:
Chapter 1 is an introduction to the research background along with reviews of relevant
literature in this field.
Chapter 2 introduces the experimental setup of the multi-coil ignition research platform
which is used in this study to measure the primary current, discharge current and gap
voltage of different TCI systems.
Chapter 3 is an investigation of the spark energy and transfer efficiency of the TCI system
under the conventional single-coil single discharge strategy.
Chapter 4 is a further investigation of the TCI system under the dual-coil offset discharge
strategy. Detailed parametric analyses were conducted to identify the influences of coil
inductance and charging frequency on the spark energy and transfer efficiency of the TCI
system.
Chapter 5 summarizes the major findings of this thesis followed by brief comments on
11
CHAPTER 2.
EXPERIMENTAL SETUP
2.1 Multi-coil ignition research platform
To investigate the spark discharge characteristics of a transistor coil ignition (TCI) system,
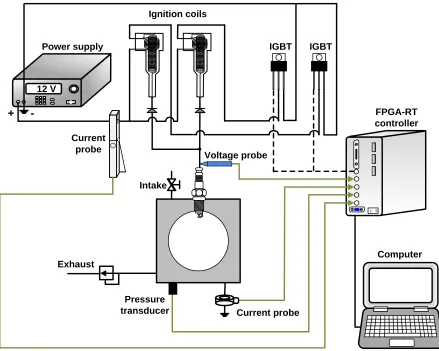
an advanced multi-coil ignition research platform was used. A simplified schematic of the
experimental setup is shown in Figure 2.1. This platform consists of a constant volume
combustion chamber and a multi-coil ignition system. The current and voltage waveforms
were acquired during charging and discharging processes under varied back ground
pressures. The energy and transfer efficiency of the investigated TCI system were
calculated based on the electrical measurement results.
Figure 2.1 Multi-coil ignition research platform
o
noff Power supply
Ignition coils
FPGA-RT controller
Intake
Exhaust
Current probe Pressure
transducer
Voltage probe Current
probe 12 V
Computer
o
n off IGBT IGBT
-12
2.1.1 Constant volume combustion chamber with optical access
The constant volume combustion chamber of the research platform has a working volume
of 30 mL. There are two optical access windows opposite to each other. As shown in Figure
2.1, the spark plug is mounted on the top of the chamber body.
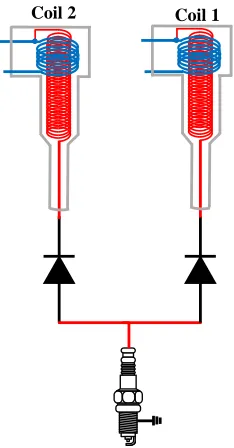
2.1.2 Multi-coil ignition system
A multi-coil ignition system was used to investigate different discharge strategies of a TCI
system in this study. The coils can be charged and discharged simultaneously or in an
alternating manner. As shown in Figure 2.2, the output terminals of the ignition coil are
connected with a high voltage diode in series, and then connect to a common spark plug.
The major function of the inline high voltage diodes is to enable independent discharging
processes of each coil, especially when two coils are not charged and discharged
simultaneously. Another function of the inline high voltage diodes is to prevent unexpected
breakdown during a charging process.
Figure 2.2 Connection between the coil and spark plug of the multi-coil system
13
The multi-coil ignition system is powered by a DC power supply. The charging process of
each coil is controlled by an insulated gate bipolar transistor (IGBT, V3040p) of
automotive ignition type. A National Instruments real time (RT) computer with a field
programmable gate array (FPGA) module was programmed to generate the control signal
to the IGBT for different charging durations.
When the primary winding of each coil was charged, the primary current was measured
with a Tektronix A622 AC/DC current probe. Tektronix A622 is a “long nose” style
clamp-on probe that uses a Hall effect current sensor to provide a voltage output to the
oscilloscope. The range of the current probe is from 50 mA to 100 A, with a frequency
range up to 100 kHz.
The spark discharge voltage was measured through a Tektronix P6015 high voltage probe
that was attached to a socket. The socket is plugged to the top of the spark plug. The P6015
is a ground-referenced 100 MΩ, 3 pF high voltage probe with 1000X attenuation [23].
Because of this high internal resistance of the P6015, the impact of the probe on the spark
discharge process is negligible.
The discharge current was measured with a Pearson 411 current probe, which is a toroid
shaped device. During the spark discharge process, the discharge current of the ignition
circuit would excite inductive current signals within the probe.
All acquired data were recorded by a PicoScope 4824 high-precision oscilloscope. The
recording was externally triggered by a spark energizing command signal from the
14
2.2 Impedance analyzer
A Keysight Technologies E4990A impedance analyzer was used to measure the
inductance, capacitance and resistance of all components of the ignition system, and the
coupling coefficient kcp of the ignition coil. The specifications of the impedance analyzer
are listed in Table 2.1.
Table 2.1 Specification of E4990A impedance analyzer [24]
Spectrum frequency: 20Hz to 20MHz
Measurement accuracy: ±0.08%
When measuring the primary winding inductance or the secondary winding inductance of
the ignition coil, the ends of one winding were connected to the measurement ports of the
impedance analyzer by using a pair of Kelvin clips, whereas the ends of the other winding
were kept open. The measurement circuit is shown in Figure 2.3.
Figure 2.3 Measurement circuit of the primary /secondary winding inductance
1 1 1 1 1 1 1 1 1 1 1 1 1 1 1 1 1 1
1 1 1 1 1 1
1 1 1 1 1 1 1 1 1 1 1 11 1 1 1
1 1 11 11 11 1
Ignition coil
15
The leakage inductance is a self-inductance because of the imperfect coupling of two
windings [25] [34] [43]. It results in a leakage flux. When short-circuiting the ends of the
secondary winding while measuring the inductance of the primary winding, as shown in
Figure 2.4, the leakage inductance of the primary winding was determined.
Figure 2.4 Measurement circuit of the leakage inductance
The coupling coefficient kcp of the ignition coil was calculated from the measured leakage
inductance and the winding inductance by using equation (1) as in previous work [25] [34]
[44].
kcp = √1 −Lss
Lp
⁄ (1)
where Lss is the leakage inductance value and Lp is the primary winding inductance.
The impedance analyzer provides the impedance phase and amplitude spectrum of the
measured objects within a certain frequency range. Because the low current glow phase of
a spark discharge event lasts for a few milliseconds, the measured impedance spectrum
from 20 Hz to 5 kHz was used in this study.
1 1 1 1 1 1 1 1 1 1 1 1 1 1 1 1 1 1
1 1 1 1 1 1
1 1 1 1 1 1 1 1 1 1 1 11 1 1 1
1 1 11 11 11 1
Ignition coil
16
2.3 Spark plugs and ignition coils
An NGK BKR6E spark plug was used in the experiments of the TCI system with
single-coil single discharge, and an iridium in-stock spark plug was used for investigating the
advanced discharge strategies. The gap sizes of both spark plugs were confirmed to 0.86
mm. The resistances of the embedded resistor of the NGK spark plug and the iridium
in-stock spark plug are 5 kΩ and 4.3 kΩrespectively. This embedded resistor is to suppress
the electrical field noise of the spark discharge process.
Five types of ignition coils from different manufacturers were used to investigate the
impact of inductances on the discharge characteristics of the TCI system. The inductance,
resistance and coupling coefficient values of these coils were measured using the
aforementioned methods, the results are shown in Table 2.2. The primary inductances of
the tested coils are in the range from 2 mH to 5.7 mH; the secondary inductances are in the
range from 8 H to 40 H.
Table 2.2 Parameters of ignition coils used in this study
Coil A Coil B Coil C Coil D Coil E
Lp (mH) 5.7 5 2.9 2.37 2
Rp_winding (Ω) 0.7 0.67 0.7 0.7 0.7
Ls (H) 32.5 40.1 15.3 10 8
Rs_winding (kΩ) 5.61 7.2 5 8.2 5.8
17
CHAPTER 3.
TCI SYSTEM WITH SINGLE-COIL SINGEL
DISCHARGE
3.1 Overview of the TCI system
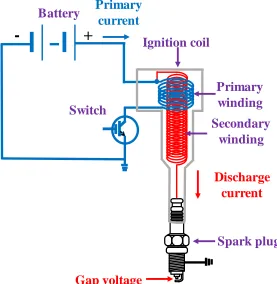
Figure 3.1 shows a simplified schematic of a conventional transistor coil ignition (TCI)
system used in this study. The TCI system is still the most prevalent system to ignite
combustible mixtures in SI engines. It consists of a DC 12 V battery, an inductive coil that
contains a primary winding and a secondary winding, a transistor switch, and a spark plug.
Figure 3.1 A simplified schematic of the TCI system
The primary winding of the ignition coil is connected to the battery through the transistor
switch. The secondary winding of the ignition coil is directly connected to the spark plug.
During the dwell time shortly before the timing of ignition, the transistor switch in the
primary circuit is closed for a few milliseconds, which builds up a magnetic field in the
+
-
Ignition coilSecondary winding Primary winding
Spark plug Switch
Battery Primary
current
Discharge current
18
primary winding. The maximum available electrical energy is stored in the magnetic field.
At the timing of ignition, the primary circuit is interrupted by the opening of the transistor
switch. The magnetic field in the primary winding drops suddenly, which induces a primary
voltage up to 400 V negative for a short time. In accordance with the principle of the
transformer, a high-voltage peak value up to 30 kV positive is induced in the secondary
winding. Due to the high voltage, the mixture between the spark plug electrodes becomes
ionized. Thereby an electric spark jumps over the electrodes [25-26]. Conductive ion
channels then are built up across the spark gap.
When ion channels are built up between electrodes of the spark plug upon breakdown, the
spark discharge process proceeds to the arc and glow phases. Figure 3.2 shows the typical
discharge current and gap voltage waveforms of the glow phase observed in this study. The
measurement was conducted with the experimental setup mentioned in Chapter 2, using
Coil A and the NGK spark plug under atmospheric ambient conditions with a charging
duration of 3 ms.
Figure 3.2 Discharge current and gap voltage waveforms of the glow phase -20 0 20 40 60 80 100 -2 0 2 4 6 8 10
-1 0 1 2 3 4 5 6 7 8
D is ch ar ge c u rr en t (m A ) G ap vo ltage (k V ) Time (ms)
Gap voltage Discharge current
19
3.2 Current and voltage measurement and energy transfer calculation
Within the TCI system, the ignition coil operates as a dual-function device by serving both
as a transformer and an energy accumulator [26]. The inductance and resistance values of
the primary winding and the secondary winding determine the characteristics of the
primary current, gap voltage and discharge current, as well as the energy distribution of the
ignition system. To investigate the spark energy of the TCI system during the glow phase,
for each of the five coils, the primary current, gap voltage and discharge current were
measured. The spark energy and transfer efficiency were calculated based on the
measurements. This section summarizes the measurement methods of the charge and
discharge characteristics (3.2.1), and presents the calculation methods of the spark energy
and transfer efficiency of the TCI system (3.2.2).
3.2.1 Measurement methods of the current and voltage
Figure 3.3 illustrates the electric circuit of a conventional TCI system used in this study.
Table 3.1 is the descriptions of each symbol in the circuit. As shown in Figure 3.3, the
primary voltage (Up) and current (Ip) were measured at the upstream of the primary
20
Figure 3.3 Electric circuit of the conventional TCI system
Table 3.1 Nomenclature of the TCI circuit in Figure 3.3
Symbol Description
Uss Supply voltage
Rp_cable Cable resistance in the primary circuit
Rp_winding Primary winding resistance
Lp Primary winding inductance
Ls Secondary winding inductance
Rs_winding Secondary winding resistance
Rs_cable Cable resistance in the secondary circuit
Rplug Spark plug embedded resistance
Ip Primary current
Up Primary winding voltage
Is_downstream Discharge current measured downstream of the spark plug
Is_upstream Discharge current measured upstream of the spark plug
Us_downstream Discharge voltage of the downstream measurement
Us_upstream Discharge voltage of the upstream measurement
Ugap Discharge voltage across the spark gap
Lp
Rp_winding
Rp_cable
Rs_cable
Uss
Rplug
Ls
Rs_winding
Ugap Ignition coil
Is_upstream Us_upstream
Is_downstream Us_downstream Ip
21
In the secondary circuit (right side in Figure 3.3), the gap voltage can be measured directly
at the tip of the central electrode towards the gap with a high voltage probe. This method
is refereed as “downstream measurement” in this work. However, attaching the voltage
probe to the central electrode of the spark plug during the real engine operation is not
convenient due to the high temperature and pressure of the combustion process. Another
method is to attach the voltage probe to the top of the spark plug. This method is refereed
as “upstream measurement” in this work. By using the upstream measurement, the spark
plug voltage instead of the gap voltage is acquired directly. The gap voltage (Ugap) is then
calculated with equation (2).
Ugap = Us− IsRplug (2)
Figure 3.4 illustrates the voltage waveforms acquired by both downstream and upstream
methods. The difference value of the measured voltage by these two methods is the voltage
drop across the embedded resistors of the spark plug.
Figure 3.4 Discharge voltage from upstream and downstream measurement
-2 0 2 4 6 8
0 1 2 3 4 5 6
D
is
ch
ar
ge
vo
ltage
(k
V
)
Time (ms)
22
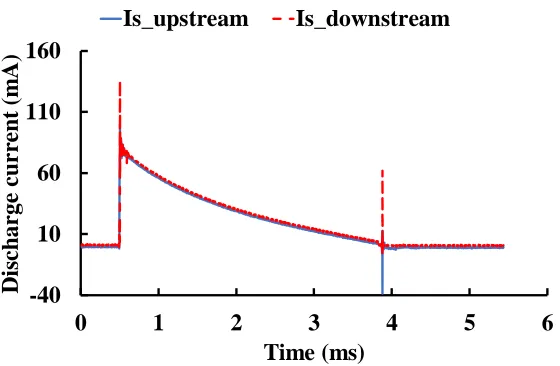
The discharge current was measured by placing the current probe at either upstream or
downstream of the spark plug. As shown in Figure 3.5, the difference of the measured
discharge current between the upstream and downstream measurement within the
discharge duration is very small.
Figure 3.5 Discharge current from upstream and downstream measurement
The spark energy, i.e. the electric energy delivered to the spark gap, is calculated by
integrating the product of gap voltage and discharge current directly over the discharge
duration, as expressed in equation (3).
Espark(t) = ∫ Ugap(t)Is(t)dt
t
0 (3)
For downstream measurement, the measured voltage is the gap voltage, the spark energy
thus is directly calculated according to equation (3). For upstream measurement, the spark
plug voltage instead of the gap voltage is directly measured, thus the spark energy is
calculated with equation (4).
Espark(t) = ∫ Uupstream(t)Is_upstream(t)
t
0 − ∫ Is_upstream
2 (t)R
plugdt
t
0 (4)
-40 10 60 110 160
0 1 2 3 4 5 6
D
is
ch
ar
ge
c
u
rr
en
t
(m
A
)
Time (ms)
23
Figure 3.6 shows the calculated spark energy from upstream and downstream measurement
methods using the NGK spark plug with an embedded resistor of 5 kΩ. It can be seen that
different measuring points of the discharge voltage and current did not affect the calculated
spark energy significantly. Therefore, the gap voltage and discharge current in the
following sections were all measured by the upstream measurement method.
Figure 3.6 Spark energy from upstream and downstream measurement
3.2.2 Calculation of energy and transfer efficiency of the TCI system
The primary energy (Ep), which is defined as the energy stored into the primary winding
during the charging process, is calculated with equation (5) [14] [34].
Ep= 1
2× Lp× Ip_max
2 (5)
where Lp is the primary winding inductance, which is typically within a few mH, and
Ip_max is the cut-off current of the primary circuit [14] [34].
The total resistance of the primary circuit is usually in the order of 0.5 Ω to 1 Ω. Although
this resistance is relatively low, the primary current can be as high as tens of amperes during
0 10 20 30 40 50
0 1 2 3 4 5 6
S
p
ar
k
e
n
er
gy
(m
J)
24
the charging process. This means the primary resistive losses are not negligible. The
primary resistive losses (Ep,loss ) is calculated with equation (6) [14] [34].
Ep,loss(t) = ∫tchargeIp(t)2
0 Rpdt (6)
where 𝑅𝑝 is the total resistance of the primary circuit, and tcharge is the charging duration.
The resistances of the battery and the transistor switch in the primary circuit are not
considered when calculating the primary resistive losses because their values are negligible
compared to the primary winding resistance.
The total energy consumed in the primary circuit is the summation of the primary energy
and the primary resistive losses, as in equation (7) [14] [34].
Ep,total(t) = Ep+ Ep,loss(t) (7)
The energy transfer efficiency of the ignition system, which is defined as the ratio of the
spark energy available at the spark gap to the total energy consumed in the primary side, is
calculated with equation (8) [14] [34].
η =
EsparkEp,total (8)
where 𝐸𝑠𝑝𝑎𝑟𝑘 is the spark energy calculated using equation (3).
The secondary resistive losses (Es,loss) is calculated by integrating the product of the
discharge current (Is) and the total secondary circuit resistance (Rs) over the discharge
25
Es,loss(t) = ∫tdischargeIs(t)2
0 Rsdt (9)
where, Rs is the total resistance of the secondary circuit, including the secondary winding
resistance and the embedded resistance of the spark plug, and tdischarge is the discharging
duration. Because the resistance of the high voltage cable used in the secondary circuit is
negligible compared to the secondary winding resistance, this cable resistance is not
considered in the calculation of the secondary resistive losses.
The primary current, discharge current and gap voltage of five types of coils were measured
by using the experimental setup described in Chapter 2 under atmospheric ambient
conditions. The primary energy and spark energy of the ignition system were calculated
based on the measurement results. Among the five types of ignition coils used in this study
(Table 2.2), Coil A and Coil B have comparatively higher inductances than those of Coil
C to Coil E. Coil E has the smallest primary inductance and secondary inductance.
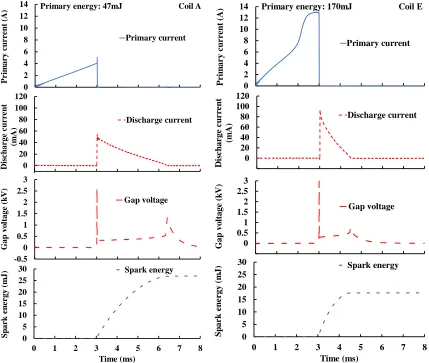
Taking Coils A and E as examples, Figure 3.7 shows the acquired waveforms and the
calculated spark energy with a charging duration of 3 ms. The cut-off current of Coil A is
only one third of the cut-off current of Coil E because the primary inductance of Coil A is
almost three-times that of Coil E. The discharge current of Coil A is half of that of Coil E
26
Figure 3.7 Charge and discharge characteristics of Coil A and Coil E
Figure 3.7 also shows that 27 mJ spark energy was delivered to the spark gap by Coil A
and 17 mJ spark energy was delivered to the spark gap by Coil E. The main reason is that
the coil with both higher primary and secondary inductances has lower cut-off current and
discharge current, resulting in less resistive losses and thus higher overall energy transfer
efficiency.
Also noted in Figure 3.7, Coil E was saturated at 2.8 ms charging duration, thus no more
electrical energy could be charged into the primary winding afterward. This is because the
primary inductance of Coil E is very small (2 mH).
0 2 4 6 8 10 12 14
0 1 2 3 4 5 6 7 8
P ri m ar y c u rr en t (A ) Time (ms) Primary current -20 0 20 40 60 80 100 120
0 1 2 3 4 5 6 7 8
D is ch ar ge c u rr en t (m A ) Time (ms) Discharge current -0.5 0 0.5 1 1.5 2 2.5 3
0 1 2 3 4 5 6 7 8
G ap vo ltage (k V ) Time (ms) Gap voltage 0 5 10 15 20 25 30
0 1 2 3 4 5 6 7 8
S p ar k e n er gy (m J) Time (ms) Spark energy Coil A Primary energy: 47mJ
0 2 4 6 8 10 12 14
0 1 2 3 4 5 6 7 8
P ri m ar y c u rr en t (A ) Time (ms) Primary current -20 0 20 40 60 80 100 120
0 1 2 3 4 5 6 7 8
D is ch ar ge c u rr en t (m A ) Time (ms) Discharge current -0.5 0 0.5 1 1.5 2 2.5 3
0 1 2 3 4 5 6 7 8
G ap vo ltage (k V ) Time (ms) Gap voltage 0 5 10 15 20 25 30
0 1 2 3 4 5 6 7 8
27
Coils with higher inductance (e.g. Coil A) can deliver more energy to the spark gap when
charging for the same duration, as shown in Figure 3.7. However, higher inductance
requires a larger number of windings and a bigger area of winding cross section, thus, lead
to a bigger size of coil.
3.3 Modeling of the TCI system
To further investigate and generalize the impact of coil inductance on the charge and
discharge characteristics of the TCI system, a numerical model was developed to emulate
the primary current, gap voltage and discharge current of the TCI system during the glow
phase. The model includes two sub-models, a transformer sub-model to emulate the energy
transfer of the ignition coils and a spark gap resistance sub-model to describe the dynamic
change of the conductive ion channels between the spark gap during the glow phase.
3.3.1 Modeling of the equivalent gap resistance
During the spark discharge process, conductive ion channels are formed between the spark
gap after a breakdown event occurs. According to the typical discharge current and gap
voltage waveforms during the glow phase, discharge current drops from a maximum value
( Is_max ) to zero; gap voltage is in the order of 400-500 V and increases as the discharge
current decreases. This suggests that the resistance of the conductive ion channel is not a
constant value during the glow phase. According to the previous research results, the
conductive ion channel resistance varies as a function of the discharge current and depends
on the electrode material, gap size and gas type, density, and temperature in the ion channel
[27-29]. Several models have been proposed in the literature to emulate the gap resistance
28
To evaluate different ignition coils reproducibly and to minimize the variability and noise
caused by the spark gap, the researchers in the automotive industry often use a zener diode
instead of a real spark plug to measure and calculate the output energy of different ignition
coils. This test method is defined in SAE J973 [31]. This standard mainly describes the
electrical performance and test methods of ignition systems. In this standard, a zener diode
is connected to the secondary winding of the ignition coil to simulate the gap voltage by
permitting the current to flow through it when the voltage exceeds a certain value [31].
Previously, a simplified circuit model with a constant spark gap voltage and a constant gap
resistance was proposed to approximate the voltage and resistance of the ion channels
during the spark discharge process [34]. The spark energy calculated by this model was
similar as the spark energy measured by the zener diode method. However, this constant
gap voltage and constant gap resistance cannot represent the dynamics in a realistic
discharge.
To describe the dynamic changes of the gap voltage and gap resistance during the glow
phase, an equivalent gap resistance (Rgap) is proposed in equation (10). It is defined as the
ratio of the gap voltage (Ugap) to discharge current (Is).
R
gap=
UgapI𝑠 (10)
Experiments were conducted by using the NGK BKR6E spark plug under atmospheric
ambient conditions. The gap size of the spark plug was 0.86 mm. Air was used as gas media.
Coil A and Coil B were used to investigate how Rgapchanges as Is decreases during the
29
respectively; the secondary winding inductances are 32.5 H and 40.1 H respectively.
During the experiments, the charging durations of both coils were modulated to produce a
peak discharge current (Is_max) within the range of 10 mA to 130 mA. Rgap is derived with
equation (10). The calculated Rgap values are plotted in Figure 3.8 as a function of the
discharge current. When Is increases from 10 mA to 30 mA, Rgap drops from ~ 50 kΩ to
~10 kΩ. However, when Is increases beyond 30 mA, Rgap drops less than a few kiloohms.
Figure 3.8 Empirically derived results of the equivalent gap resistance
Pischinger and Suit [25] [30] have proposed a power function to describe the relationship
between the gap voltage and the discharge current during the glow phase of a spark
discharge. Combining this power function with equation (10), an expression for Rgap is
derived as shown in equation (11).
Rgap(t) = 𝑎 × Is(t)−𝑏 (11)
a and b are two empirical parameters, derived from curve fitting based on the experimental
data. a and b depend on the electrode material, gap size, and gas type, density, and
0 10 20 30 40 50 60
0 25 50 75 100 125 150
Eq
u
ival
en
t
gap
r
es
is
tan
ce
(k
Ω
)
30
temperature across the gap. A non-linear least square method [32] was applied. Upon best
fitting, the derived regression for Rgap is expressed in equation (12).
Rgap(t) = 180.77 × Is(t)−1.19 (12)
Figure 3.9 depicts that the model is an excellent fit of the experimental data.
Figure 3.9 Curve fitting results of the equivalent gap resistance
3.3.2 Modeling of the TCI circuit
A transformer model was adopted from Tan [34], who proposed a simplified model with a
constant gap voltage and gap resistance to describe the charge and discharge characteristics
of the TCI system. However, the equivalent gap resistance model was used to replaced the
constant gap voltage and gap resistance in this study. This model includes the charging and
discharging processes of the TCI system. For simplicity, the parasitic capacitance and
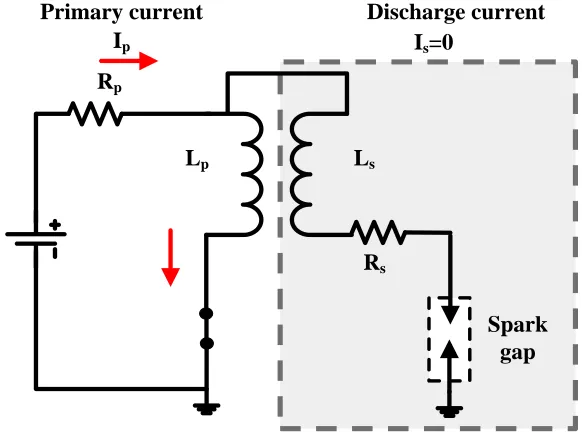
inductance of the system have not been considered. Figure 3.10 shows the electric circuit
used for model derivation.
0 10 20 30 40 50 60
0 25 50 75 100 125 150
Eq
u
ival
en
t
gap
r
es
is
tan
ce
(k
Ω
)
31
Figure 3.10 Electric circuit used for TCI model derivation
Charging process
During the charging process, the switch in the primary circuit is closed for a certain
duration. The primary current flows through the primary circuit and gradually increases.
As the primary current increases, the primary energy gradually stores in the magnetic field
of the coil. In this process, the build-up of the primary current is slow (in the order of
milliseconds). The voltage induced within the secondary winding is not high enough to
generate a breakdown across the spark gap. In this case, the secondary circuit is treated as
an open circuit and the primary circuit of the TCI system is simplified into an L-R charging
circuit as shown in Figure 3.11.
Lp Rp
Rs Uss
Ls
Spark gap Ignition coil
32
Figure 3.11 Electric circuit of the charging process
Therefore, the primary current Ip is estimated according to equation (13) [14] [34].
Ip(t) =Uss
Rp × (1 − e
−Rp
Lpt) (13)
where Rp is the total resistance of the primary circuit.
Discharging process
At the end of the charging process, the switch open of the primary circuit forces the primary
current to drop from a maximum value (Ip_max) to zero immediately. The abrupt
interruption of the primary current induces a high voltage across the secondary winding.
Once the voltage difference between the spark gap reaches the breakdown limit, conductive
ion channels are formed across the spark gap. At this point, continuous current flows
through the secondary circuit and the energy stored in the magnetic field is released through
the secondary circuit. The voltage across the spark gap is often in the range of a few
Lp Rp
Rs Ls
Spark gap
Ip Is=0
33
hundred volts to sustain the continuous flow of free ions across the spark gap. Because the
primary current is forced to zero immediately at the end of the charging process, the
primary circuit is treated as an open circuit and the secondary circuit is simplified into an
L-R discharge circuit, as shown in Figure 3.12.
Figure 3.12 Electric circuit of the discharging process
So Is is described using equation (14) [14] [34].
Is(t) = Is_max− (Is_max+
Ugap
Rs )(1 − e
−Rs
Lst) (14)
where 𝑅𝑠 is the total resistance of the secondary circuit, including the secondary winding
resistance and the embedded resistance of the spark plug. Is_max in equation (14) is derived
by equation (15).
Is_max= kcp× Ip_max× √
Lp
Ls (15)
where kcp is the coupling coefficient between the primary winding and the secondary
winding, which is calculated with equation (1). Lp
Rp
Rs
Ls
Switch Ip=0
Is
Primary current Discharge current
Ugap
34
In equation (14), Ugapis an unknown parameter and related to the change of gap resistance.
Using the equivalent gap resistance model (equation (10) and equation (12)), Ugapis
expressed with equation (16).
Ugap(t) = 180.77 × Is(t)−0.19 (16)
Combining equation (14) and (16), Is is expressed as a function of time, the coil
inductances and the circuit resistances, as in equation (17).
I
s(t) = [
e−1.19RsLst×(−180.77e1.19RsLst+180.77+RsIs_max1.19 )
Rs
]
0.84
(17)
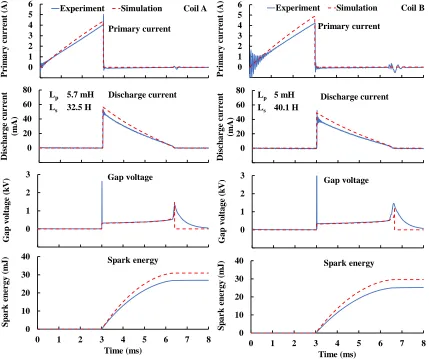
TCI model results
The developed model was applied to Coil A and Coil B. Figure 3.13 shows the modeled
and measured results. The derived model captured the trends of the measured primary
current, discharge current and gap voltage during the charging and discharging processes.
Thus, the model estimated spark energy, by large, agrees with that of the experimental data.
However, the model over-predicated the measured primary current and discharge current,
likely because of the exclusion of the parasitic inductance and capacitance etcetera.
Measurement errors of the coil parameters, especially in the primary inductance, is another
35
Figure 3.13 Modeling results of Coil A and Coil B
3.3.3 Validation of the TCI model
In order to verify that this model can be used to estimate the spark energy and transfer
efficiency for a wide range of ignition coils, four types of ignition coil with different coil
inductances were used for model validation. To calculate the spark energy and transfer
efficiency under different primary energy level, the charging durations of each coil were
modulated from 1 ms to 6 ms progressively with 1 ms increment. The simulated and
experimental results of the spark energy and transfer efficiency for these coils are plotted
in Figure 3.14 to Figure 3.17, one figure for each of the four coils. -1 0 1 2 3 4 5 6
0 1 2 3 4 5 6 7 8
P ri m ar y c u rr en t (A ) Time (ms) Experiment Simulation -20 0 20 40 60 80
0 1 2 3 4 5 6 7 8
D is ch ar ge c u rr en t (m A ) Time (ms) -1 0 1 2 3
0 1 2 3 4 5 6 7 8
G ap vo ltage (k V ) Time (ms) 0 10 20 30 40
0 1 2 3 4 5 6 7 8
S p ar k e n er gy (m J) Time (ms) Lp 5.7 mH
Ls 32.5 H
Coil A Primary current Discharge current Gap voltage Spark energy -1 0 1 2 3 4 5 6
0 1 2 3 4 5 6 7 8
P ri m ar y c u rr en t (A ) Time (ms) Experiment Simulation -20 0 20 40 60 80
0 1 2 3 4 5 6 7 8
D is ch ar ge c u rr en t (m A ) Time (ms) Discharge current -1 0 1 2 3
0 1 2 3 4 5 6 7 8
G ap vo ltage (k V ) Time (ms) 0 10 20 30 40
0 1 2 3 4 5 6 7 8
S p ar k e n er gy (m J) Time (ms) Lp 5 mH
Ls 40.1 H
Coil B
Primary current
Gap voltage
![Figure 1.1 Schematic of the breakdown phase [36]](https://thumb-us.123doks.com/thumbv2/123dok_us/1366638.1169427/19.612.188.467.73.260/figure-schematic-breakdown-phase.webp)
![Figure 1.2 Waveforms of single-coil repetitive discharge process [14]](https://thumb-us.123doks.com/thumbv2/123dok_us/1366638.1169427/22.612.182.465.71.409/figure-waveforms-single-coil-repetitive-discharge-process.webp)
![Figure 1.3 Waveforms of dual-coil offset discharge process [14]](https://thumb-us.123doks.com/thumbv2/123dok_us/1366638.1169427/23.612.183.465.224.560/figure-waveforms-dual-coil-offset-discharge-process.webp)