ABSTRACT
SEVERSIKE, THOMAS MATTHEW. Drought Tolerance Mechanisms in Cultivated and Wild Soybean Species. (Under the direction of Dr. Thomas Rufty).
Soybean [Glycine max (L.) Merr.] is an important source of protein and oil in the current
world market. Soybean yields can drastically decrease when droughts occur, thus subjecting
farmers to significant financial risk. Considering that rainfall and other climate factors are
projected to change in the future, drought tolerant soybean varieties are needed to help
mitigate this risk. Soybean breeders are making progress with drought tolerant varieties by
using exotic soybean germplasm to increase genetic diversity. The wild soybean species,
Glycine soja (Sieb. and Zucc.), is another potential source of genetic diversity for drought
traits. The present research was conducted to explore drought tolerance mechanisms in
cultivated and wild soybean genotypes, with additional attention to temperature effects that
could interact with physiological mechanisms.
In the first series of experiments, a ‘shoot-based’ mechanism was examined in
well-watered plants to determine how plants adjusted their water use patterns in response to a
stressful aerial environment. Second, ‘below-ground’ experiments were conducted to
investigate water use in water-replete and water-deficit soil environments, as well as the root
morphology of plants grown in hydroponics. Last, wild soybean was evaluated in
closed-canopy field experiments for agronomic traits in comparison with cultivated soybean.
Drought tolerant genotypes in soybean appear to possess a suite of traits that allow
them to control water use in response to atmospheric and soil stresses, and now the same is
in its water use in response to both above- and below-ground drought stresses. A layer of
complexity was discovered when wild and cultivated soybean exhibited their drought
tolerance mechanisms exclusively near their optimum growth temperatures of 25 and 30 °C,
respectively. A similar trend was evident in root growth and morphology. Wild soybean had
almost twice as much root length as the cultivated type when grown at 25 °C. However as
temperature increased to 35 °C, cultivated soybean root length was higher than wild soybean.
As expected, cultivated soybean also surpassed the wild type in the field. Domestication of
soybean has lead to higher yields, improved seed quality, and other improved agronomic
characteristics.
The results of this work suggest that wild soybean has potential drought tolerance
traits that could be useful in cultivated soybean genotypes. Our study has revealed challenges
with temperature interactions in integrating traits from wild to domesticated soybean, but it
also offers quantification of the agronomic productivity of wild soybean, which may be
Drought Tolerance Mechanisms in Cultivated and Wild Soybean Species
by
Thomas M. Seversike
A dissertation submitted to the Graduate Faculty of North Carolina State University
in partial fulfillment of the requirements for the degree of
Doctor of Philosophy
Crop Science
Raleigh, North Carolina
2011
APPROVED BY:
_______________________________ ______________________________ Dr. Thomas R. Sinclair Dr. Thomas E. Carter, Jr.
________________________________ ________________________________ Dr. Thomas Rufty Dr. Dean Hesterberg
ii
DEDICATION
This work is dedicated to Mrs. Dr. Seversike, domestic goddess, beloved bride, and mother
iii
BIOGRAPHY
Thomas M. Seversike is a native of Washington State. He grew up in a small town
near Olympia where he spent much of his time in the woods playing with his brothers and
sisters. He is married with three children and now enjoys playing outdoors with them.
Though from a small town where the world revolved around the local gas station and video
store, Tom spent some considerable time as a volunteer in Central America and Africa after
graduating from high school. He earned an A.S. degree from Brigham Young
University-Idaho, a B.S. and an M.S. degree from the University of Arkansas, and he received a
fellowship from the United Soybean Board in 2007 to conduct the present research for his
Ph.D. at North Carolina State University. Tom looks forward to an exciting career in plant
science research where he can contribute his skills and enthusiasm to help solve problems for
iv
ACKNOWLEDGMENTS
So many people have helped me realize this great achievement. Foremost, the
sacrifice, patience, and endless optimism of my lovely wife, Ranie, cannot go unrecognized.
Her bright face and spirited personality pushed me onward toward the goal. My children
helped me water plants in the greenhouse, and they helped me remember that my most
important job is being a father. I have my parents to thank for providing an environment that
enhanced my self-esteem and nurtured the pursuit of truth through hard work and study
during my childhood. My siblings get credit for helping me cultivate problem-solving skills.
It has been my honor to work under the guidance of such an inspiring graduate
committee, chaired by Dr. Tom Rufty. Dr. Rufty gave me ownership of this research, which
demonstrated a great deal of trust and respect for me as a student and scientist. I do not take
that for granted. Along with Tom Rufty, Dr. Tom Sinclair and Dr. Tommy Carter have
worked with me as a colleague and offered invaluable counsel and training that will
undoubtedly elevate my future endeavors to the highest standards. Dr. Dean Hesterberg is
one of the finest instructors I have ever had. If I had his intelligence and enthusiasm, I might
have ended up as a soil chemist!
Special thanks go to my office mates, Shannon Sermons, Laura Vance, and Mandeep
Riar, for your help on projects and for our many conversations from the imponderable to the
imbecilic. I look forward to our future interactions as we advance with our degrees striving to
take on the challenges ahead. Much deserved recognition goes to the staff at the NC State
Phytotron, Boo Blount and Hope Ledford, and the many other people associated with NC
State and the USDA –ARS for their assistance with this work. Last, I would like to
acknowledge the United Soybean Board for sponsoring my Ph.D. fellowship and for having
v
TABLE OF CONTENTS
LIST OF TABLES ... vii
LIST OF FIGURES ... ix
CHAPTER 1 Temperature Interactions with Transpiration Response to Vapor Pressure Deficit Among Cultivated and Wild Soybean Genotypes ...1
Abstract ...1
Introduction ...2
Materials and Methods ...5
Results ...10
Discussion ...13
References ...20
CHAPTER 2 Below-ground Physiological Properties of a Drought Resistant Wild Soybean Genotype: Transpiration Control with Soil Drying and Expression of Root Morphology ...33
Abstract ...33
Introduction ...34
Materials and Methods ...37
Results ...45
Discussion ...47
References ...53
CHAPTER 3 Agronomic Productivity of Wild and Domesticated Soybean under Closed Canopy Conditions in North Carolina ...68
Abstract ...68
Introduction ...69
Materials and Methods ...71
Results and Discussion ...77
Conclusion ...81
References ...82
vi
vii
LIST OF TABLES CHAPTER 1
Table 1. Description of drought resistance characteristics of wild and
domesticated soybean genotypes used in experiments. . ...25
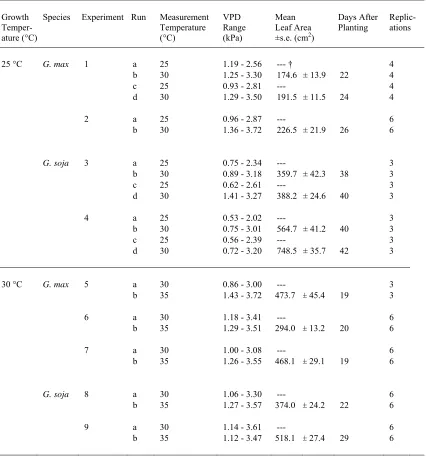
Table 2. Summary of experiments measuring transpiration rate (TR) response to vapor pressure deficit (VPD) at 25 °C and 30 °C growth temperatures. Includes the VPD measurement temperatures, range of VPD during
measurements, and mean leaf area (±s.e.) of Glycine max and Glycine soja
plants. ...26
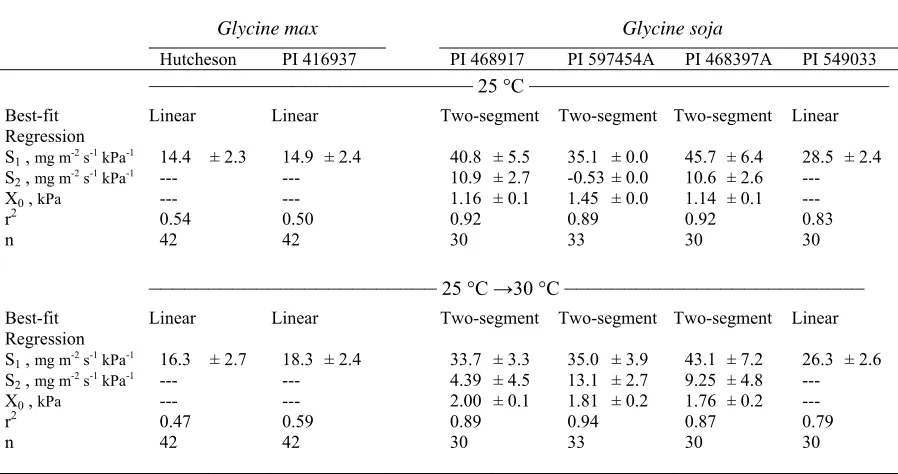
Table 3. Results of regression analysis of transpiration rate (TR) on vapor pressure deficit (VPD). The best-fit regression and corresponding regression coefficients, S1, S2, and X0 (see notes below for meanings of abbreviations), ± standard errors are reported for two Glycine max and four Glycine soja
genotypes grown at 25 °C. Plants were measured for one day at the growth temperature (25 °C) and again the next day immediately after the temperature
was increased 5 °C (25 °C →30 °C). ...27 Table 4. Results of regression analysis of transpiration rate (TR) on vapor
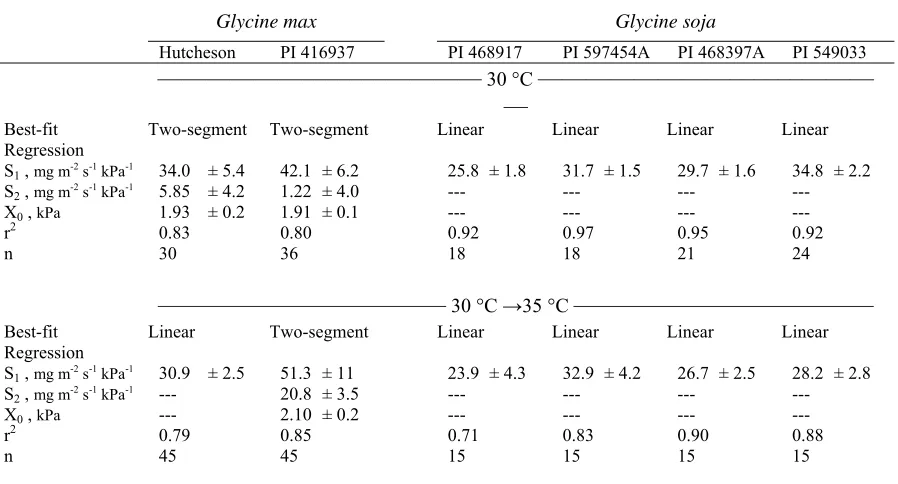
pressure deficit (VPD). The best-fit regression and corresponding regression coefficients, S1, S2, and X0 (see notes below for meanings of abbreviations), ± standard errors are reported for two Glycine max and four Glycine soja
genotypes grown at 30 °C. Plants were measured for one day at the growth temperature (30 °C) and again the next day immediately after the temperature
was increased 5 °C (30 °C →35 °C). ...28
CHAPTER 2
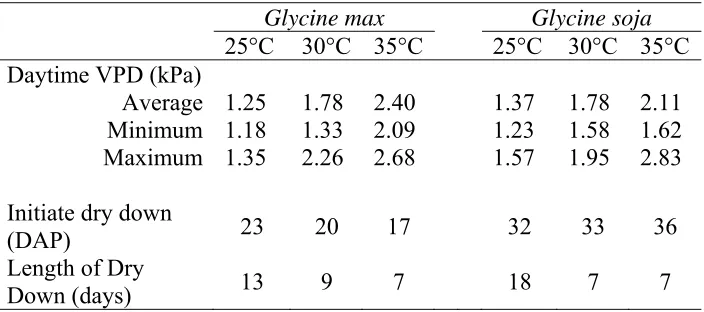
Table 1. Daytime vapor pressure deficit (VPD) during dry down, the number of days after planting (DAP) when dry down experiments were initiated, and the length of the dry down (days) for Glycine max and Glycine soja at 25, 30, and
viii LIST OF TABLES (continued)
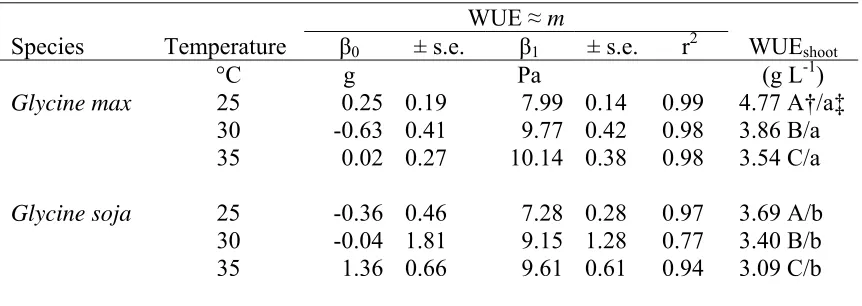
Table 2. Linear regression coefficients and their standard errors (± s.e.) to
determine WUE without confounding effects of environment (WUE ≈ m) for well-watered Glycine max and Glycine soja at 25, 30, and 35 °C growth temperatures. For the regression equation y = β0+ β1(x), y is the total plant mass (g); β1 is the physiological coefficient m (Pa); and x is the water use (g) divided by VPD (Pa). Water use efficiency (WUEshoot) based on shoot dry mass (g) per unit water used (L) for individual plants are given as mean
values.. ...59
Table 3. Linear regression coefficients and their standard errors (± s.e.) to
determine WUE without confounding effects of environment (WUE ≈ m) for drying Glycine max and Glycine soja at 25, 30, and 35 °C growth
temperatures. For the regression equation y = β0+ β1(x), y is the total plant mass (g); β1 is the physiological coefficient m (Pa); and x is the water use (g) divided by VPD (Pa). Water use efficiency (WUEshoot) based on shoot dry mass (g) per unit water used (L) for individual plants are given as mean
values.. ...60
Table 4. Mean root dry mass, root length, and root surface area of Glycine max
and Glycine soja plants grown in hydroponics at different temperatures. ...61
CHAPTER 3
Table 1. Descriptive characteristics of the three North Carolina field
environments, including emergence and transplant dates; seasonal mean daily maximum (Tmax) and minimum temperature (Tmin), cumulative rainfall, and average daily solar radiation (Rs); flowering (R2) and harvest maturity (R8) date, the duration of reproductive growth (Days R2 to R7); and yield, protein
and oil averaged over genotypes. ...88
Table 2. Mean yield, plant mass, photosynthates partitioned to seed yield, seed composition, and 100-seed weight of wild (PI’s) and domesticated (Williams)
soybean averaged over three North Carolina field environments. ...89
Table 3. Analysis of variance of the yield (kg ha-1), seed protein (g kg-1), and seed oil (g kg-1) of domesticated (G. max) and wild (G. soja) soybean grown at 3
ix
LIST OF FIGURES CHAPTER 1
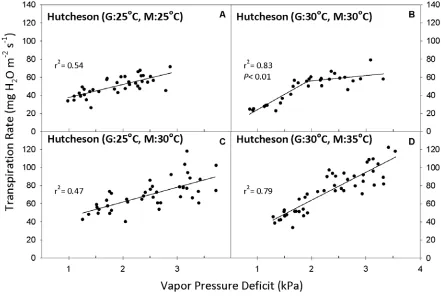
Figure 1. Transpiration rate (TR, expressed per unit leaf area) response to vapor pressure deficit (VPD) for Glycine max genotype Hutcheson. Growth
temperature denoted by “G” and measurement temperature denoted by “M” in parenthesis of panel title. Best-fit regressions are shown with corresponding r2 values. P values are presented in cases where the two-segment model was the
best fit (P <0.05). Regression coefficients can be found in Tables 3 and 4. ...29
Figure 2. Transpiration rate (TR, expressed per unit leaf area) response to vapor pressure deficit (VPD) for Glycine max genotype PI 416937. Growth
temperature denoted by “G” and measurement temperature denoted by “M” in parenthesis of panel title. Best-fit regressions are shown with corresponding r2 values. P values are presented in cases where the two-segment model was the
best fit (P <0.05). Regression coefficients can be found in Tables 3 and 4. ...30
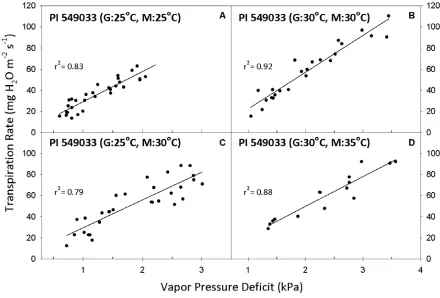
Figure 3. Transpiration rate (TR, expressed per unit leaf area) response to vapor pressure deficit (VPD) for Glycine soja genotype PI 549033. Growth
temperature denoted by “G” and measurement temperature denoted by “M” in parenthesis of panel title. Best-fit regressions are shown with corresponding r2
values. Regression coefficients can be found in Tables 3 and 4. ...31
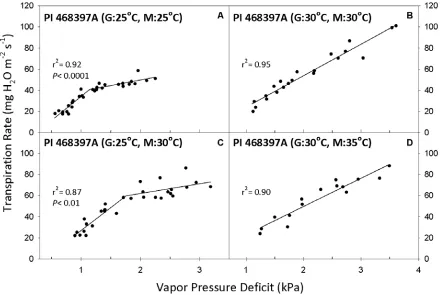
Figure 4. Transpiration rate (TR, expressed per unit leaf area) response to vapor pressure deficit (VPD) for Glycine soja genotype PI 468397A. Growth
temperature denoted by “G” and measurement temperature denoted by “M” in parenthesis of panel title. Best-fit regressions are shown with corresponding r2 values. P values are presented in cases where the two-segment model was the
best fit (P <0.05). Regression coefficients can be found in Tables 3 and 4. ...32
CHAPTER 2
Figure 1. Accumulation of total plant mass over time by Glycine max and Glycine soja when grown at 30 °C. The growth lag for Glycine soja existed for each of
the temperatures used in the current study. ...62
Figure 2. Regression of total plant mass on water use/VPD to estimate the inherent water use efficiency (m) of well-watered Glycine max and Glycine
x LIST OF FIGURES (continued)
Figure 3. Regression of total plant mass on water use/VPD to estimate the inherent water use efficiency (m) of drying Glycine max and Glycine soja
when grown at 25, 30, and 35 °C. ...64
Figure 4. Normalized transpiration of Glycine max and Glycine soja as a function
of soil water status at three temperatures. ...65
Figure 5. Images of Glycine max and Glycine soja root systems that were grown
in a hydroponic solution of 28 °C. ...66
Figure 6. Root length measured for different root diameter classes in Glycine max and Glycine soja plants grown in hydroponics at different solution
temperatures. ...67
CHAPTER 3
Figure 1. Wild soybean A) closed canopy compared to domesticated soybean, B) harvest at physiological maturity, and C) harvested wild and domesticated
1
CHAPTER 1
Temperature Interactions with Transpiration Response to Vapor Pressure Deficit Among Cultivated and Wild Soybean Genotypes
ABSTRACT
A key strategy being pursued in soybean drought research is increased stomatal sensitivity to
high VPD. These experiments were initiated to determine if the aerial temperature of the
growth environment affected the ability of plants to respond to VPD. Two soybean [Glycine
max (L.) Merr.] and four wild soybean [Glycine soja (Sieb. and Zucc.)] genotypes growing at
25 °C and 30 °C were examined. The stability of the VPD response was investigated after
temperature increased by 5 °C. In domesticated soybean, restriction of transpiration rate (TR)
became evident as VPD increased above 2.0 kPa when temperature was near its growth
optimum of 30 °C. Drought resistant genotype PI 416937 exhibited greater TR control at
high VPD compared to Hutcheson, and only PI 416937 restrained TR after the shift to 35 °C.
Three wild soybean genotypes exhibited control over TR with increasing VPD when grown
at 25 °C, which is close to their estimated growth optimum. The TR control became engaged
at lower VPD than domesticated soybean and it was retained to differing degrees with the
upward temperature shift to 30 °C. The results clearly indicated that the TR control systems
in domesticated and wild soybean are influenced by temperature. The results also indicate
that favorable TR control traits are present in wild soybean, but if they are to be used in
soybean breeding for warmer climates like those in the southeastern USA, the regulatory
2
INTRODUCTION
Crop biomass increases as a linear function of water use (DeWit, 1958). The physical
relationship between carbon assimilation and transpiration is controlled by gas exchange
through the stomata in plant leaves. When stomata are open, CO2 is taken in by the plant and
water vapor escapes from the leaf. When water deficits occur and stomata close, the water
status and many physiological functions of the plant are maintained, but carbon fixation and
growth rate decline.
Drought is a problem in all major crops, and certainly in soybean (Purcell and Specht,
2004). Multiple strategies are available to soybean growers to protect crop yield in times of
drought. Although irrigation can be effective, it is not widespread because costs commonly
exceed the revenue gained from the yield increase. Crop phenology can be matched to
seasonal patterns, where sowing occurs early in the season when more water is available (e.g.
early soybean production systems; Heatherly, 1999; Bowers, 1995). However, the approach
is not feasible in every soybean growing region. An option that is cost-effective and available
to most soybean farmers is selection of drought-resistant varieties.
Considerable progress has been made in breeding for improved drought resistance in
soybean based on a “slow-wilting” phenotype that was initially observed in the unusual Plant
Introduction (PI) 416937 (USDA-ARS, 1977) more than 20 years ago (Sloane et al., 1990;
Carter and Rufty, 1993). Since then, breeding lines developed from this PI have
demonstrated relatively high yields in drought conditions without an obvious yield penalty in
3 mechanisms of PI 416937 appears to be enhanced sensitivity to high atmospheric vapor
pressure deficit (VPD), with transpiration being restricted at VPD greater than approximately
2.1 kPa (Fletcher et al., 2007). By limiting transpiration at high VPD, damaging
physiological effects of water-deficit stress in plant tissues are delayed and available soil
water is conserved.
Regulation of maximum transpiration rate (TR) and other drought resistance traits
have been evaluated for their potential effectiveness in improving yields for soybean across
the major growing regions in the USA using a model based on 50 yr of weather data (Sinclair
et al., 2010). Repeated simulations indicated that lowered maximum TR was one of the more
promising traits, especially in the southern USA. The South experiences higher temperatures
than many areas where soybean is grown, however, and temperature interactions with the
trait were not addressed in the model. In a study of stomatal response to CO2 concentrations
at different temperatures with soybean, close inspection of control data indicates that
temperature can influence stomatal conductance in response to VPD (Wilson and Bunce,
1997). If expression of the limited maximum transpiration trait were inhibited at high
temperatures, yield benefits predicted by simulation models would not accrue.
The genetic base for modern-day soybean cultivars in the USA is relatively narrow
and cultivars are relatively uniform in drought response. These observations have led to the
pursuit of drought resistance traits in diverse germplasm (Carter et al., 1993, 1999, 2004).
Drought resistance traits appear to be relatively rare in the germplasm collection, but at least
4 2011, personal comm.). The wild ancestor of soybean, Glycine soja (Sieb. and Zucc.) also
known as wild soybean, is perhaps the most genetically diverse resource available to soybean
breeders that will cross freely with the domesticate (Harlan and de Wet, 1971). An annual
plant, it is commonly found throughout China and most of Asia, including its arid regions
(Hymowitz and Singh, 1987). Wild soybean has been the object of two previous water deficit
studies; drought resistance was found to be superior to soybean in one case (Chen et al.,
2006) but similar to soybean in the other (James et al., 2008). Physiological processes of wild
and domesticated soybean were not compared, so the basis for the putative drought resistance
is unresolved. There are no reports of using wild soybean as a source of drought resistance in
breeding, in large part because no wild soybean accessions have been verified as resistant.
In this manuscript, we describe a series of experiments initiated to investigate
transpiration responses to VPD and their interactions with temperature. The experiments used
a whole plant chamber system that allowed stepwise increases in VPD and monitoring of TR
(refer to Fletcher et al., 2007; Sinclair et al., 2008; Sadok and Sinclair, 2009; Devi et al.,
2010; Gholipoor et al., 2010). The first objective was to determine whether increasing
temperature modified the VPD response in domesticated soybean. The experiments were
conducted with the cultivar Hutcheson (Buss et al., 1988) and PI 416937. Hutcheson has
been widely grown in the Southeast and is among the top ten cultivars most used as parental
stock in soybean breeding in the USA over the past 20 years (Mikel et al., 2010). Hutcheson
responses were compared to those of slow wilting PI 416937 (Sloane et al., 1990; Carter and
Rufty, 1993; Carter et al., 2006). Then, we examined the VPD responses of a selection of
5 types and if their responses were temperature sensitive. This allowed assessment of whether
Glycine soja might become a new source of drought resistance traits for soybean breeding.
MATERIALS AND METHODS
Plant Growth and Genetic Material
A sandy loam soil (73% sand; 17% silt; 10% clay) was sterilized and mixed with
slow-release fertilizer (19%N, 6%P, 12%K) plus lime to obtain a homogeneous soil media with
adequate nutrients and pH. The soil was placed into custom-built PVC pots measuring 32 cm
in height and 10 cm in diameter (2.5-L volume). Before being filled with soil, porous ceramic
cups were inserted in the bottom of each pot and covered by diatomaceous earth (~250 mL).
A vacuum line was connected to the cup within the base of the pot to remove water from the
soil and prevent anaerobic conditions. After each water addition during the experiment, the
bottoms of the pots were subjected to a vacuum of ≈ 33 kPa (1/3 bar) until water pulled from the soil was negligible.
Two domesticated and four wild soybean genotypes were selected for the study based
on results from previous drought studies (Table 1 and references therein). Hutcheson and PI
416937 are both domesticated maturity group (MG) V soybean genotypes. Hutcheson is a
USA cultivar that has intermediate wilting and intermediate water use efficiency (WUE),
while PI 416937 is a plant introduction from Japan that has slow wilting and VPD-sensitive
TR response. Wild soybean genotypes (MG III & IV) were selected based on contrasting
wilting characteristics in a preliminary greenhouse screen. Soybean seed were germinated in
6 held in a dark germination chamber at 30 °C for 48 hours. Wild soybean accessions have a
hard seed coat and were, thus, scarified prior to germination. Germination procedures were
similar to those used for soybean except that germination was extended to 72 h. Two
germinated seedlings of domesticated soybean or four seedlings of wild soybean were
planted in each pot and then thinned to one plant per pot after 7 days.
After planting, pots were placed in walk-in growth chambers at the Southeastern
Plant Environment Laboratory at North Carolina State University. The chambers were set for
10-hour day lengths with a combination of high output fluorescent and 100-watt incandescent
bulbs providing a photosynthetic photon flux density (PPFD) of approximately 800 µmol m-2
s-1. The dark period was interrupted by 3 h of incandescent light (PPFD 40 µmol m-2 s-1) to
repress flowering.
Vapor Pressure Deficit Treatments and Transpiration
Transpiration was measured as incremental VPD treatments were imposed on plants.
Experiments were conducted using a VPD system similar to that widely used and previously
described in the literature (Fletcher et al., 2007; Sinclair et al., 2008; Sadok and Sinclair,
2009; Devi et al., 2010; Gholipoor et al., 2010). Clear plastic containers (28-cm diameter x
30-cm height; 20-L volume) served as VPD chambers for individual plants. Flanges on the
PVC pots secured the VPD chambers in place only during VPD treatment/measurement
periods. The system, which was inside the walk-in growth chamber, accommodated 12 VPD
chambers in total. Quick connect fittings were installed in the tops of chambers so that air
7 measured once per minute by data loggers with built-in sensors (Lascar Electronics,
Whiteparish, UK) that were inserted into the sides of the chambers. A small computer fan
(76-mm diameter; Northern Tool and Equipment, Burnsville, MN) was installed inside each
chamber to keep the air mixed.
Vapor pressure deficit treatments began for soybean when the plant canopy was
approximately 25 cm in diameter. At this size, the plants fit inside the chambers without
making contact with the sides of the chamber. Because of its prostrate growth habit, wild
soybean plants were trained up a 30-cm high stake inserted in the middle of the pot. The
canopy structure of wild soybean was not as defined as domesticated soybean. Therefore,
VPD treatments were started when leaf area was similar for wild and domesticated soybean.
Leaf area estimates for wild soybean were made by destructive harvest of additional plants
grown for this purpose. Genotypes within a species reached the desired size at the same
time, but between the two species, wild soybean took approximately one to two weeks longer
than domesticated soybean to reach a similar leaf area.
Plants were exposed to VPD treatments over two consecutive days and were well
watered each evening prior to the next day’s measurement. On each day of measurement,
three 90-minute VPD treatments were imposed on the plants. The first 90-minute VPD
treatment was targeted for a range of 0.5 to 1.5 kPa. The second and third treatments were
targeted for VPD conditions of 1.5 to 2.5 and 2.5 to 3.5 kPa. Plants were given
8 Vapor pressure deficit inside each VPD chamber was controlled by changing the rate
of air flow through the chamber and/or the dryness of the air flowing into the chamber.
Typically, the airflow was 3-5 L min-1 in the first treatment, 10-15 L min-1 for the second,
and 15-20 L min-1 for the third. Also, in the second and third treatments, the air was dried by
passing through a PVC tube of 5-cm diameter and 115-cm length filled with silica gel
desiccant (Fisher Chemical, Fair Lawn, NJ) before flowing into each of the chambers. Air
flowed out the chambers through small holes in the bottom of the container and a gap
between the VPD chamber and the pot. During measurements, temperature was relatively
constant, being controlled by the walk-in growth chamber. Temperatures were changed as an
experimental treatment on different days and will be discussed later in more detail.
Each pot-plant-VPD chamber unit was detached from air lines for weighing before
and after each VPD treatment. The difference in weight (generally in the 5 to 15 g range) was
used as an estimate of transpiration. Evaporation from the soil surface was blocked by
aluminum foil. After the last VPD treatment of the second day, the shoots of measured plants
were harvested and leaf area measured (LI-3100 Area Meter, LI-COR Inc., Lincoln, NE).
Vapor pressure deficit was calculated for each minute of each 90-min measurement period
using the temperature and relative humidity values recorded inside the chambers by the data
loggers, and the VPD was well-controlled during each 90-min period (standard error of the
mean < 0.02 kPa). Transpiration rate was expressed per unit of leaf area. Experiments were
repeated two to three times for domesticated and wild genotypes and sometimes with
9 the different number of genotypes investigated for each species and the limited space with
the system, but the range was 3 to 6 replications per genotype per experiment.
Temperature Treatments
In summer months in the southeastern USA, high VPD commonly coincides with high
temperatures. Average daily maximum temperatures range between 30 °C and 32 °C
(Sermons et al., 2008; Purcell et al., 2003) and occasionally reach or exceed 35 °C. During a
day, and sometimes from day to day, plants will experience rapid increases in temperature.
Transpiration rate across a range of VPD was measured during exposure to two types of
conditions: 1) a stable temperature, the one at which plants were growing (25 °C or 30 °C)
and 2) following an abrupt upward 5 °C shift in temperature, imposed in the morning of the
measurement day.
Experimental design and data analysis
Domesticated and wild soybean genotypes were arranged in a completely randomized design
for the experiments. Because of space limitations, wild and domesticated soybean genotypes
were run in nine separate experiments (Table 2). For a given run within each experiment, the
TR of each plant was plotted against the mean VPD for each respective 90-min VPD
treatment. A graphing and statistical software package, GraphPad Prism (GraphPad Software
Inc., San Diego, CA, 1996), was used to analyze TR response to VPD. First, two types of
regressions, a linear regression (Eq.1) and a two-segment, non-linear regression (Eq.2), were
10 TR = S1(VPD) + intercept (Eq.1)
If VPD ≤ X0, TR = S1(VPD) + intercept1 (Eq.2) If VPD ≥ X0, TR = S2(VPD) + intercept2
In these equations, TR = transpiration rate, X0 = the breakpoint VPD where the slope
of TR changes, S1 = the slope at VPD lower than the breakpoint (or, the only slope for the
linear model), and S2 = the slope at VPD greater than the breakpoint. After both regressions
were fit to each data set, they were compared using F-tests. The linear equation was accepted
as the best fit unless the two-segment equation fit significantly better (P<0.05).
Experimental Conditions
All VPD and temperature treatments were successfully carried out within 2 °C of their
designated temperatures. Prior to the onset of VPD treatments, plants were acclimated to
mean daytime VPD values of approximately 1.2 kPa for all experiments where plants were
grown at 25 °C. Plants growing at the 30 °C temperature were exposed to mean daytime
VPD values ranging from 1.7 to 2.1 kPa. The maximum VPD achieved during VPD
treatments at 25 °C was 2.9 kPa, somewhat lower than the 3.7 kPa at 30 °C (Table 2). This
was due to the inherent relationship between saturated vapor pressure and temperature;
though a similar minimum relative humidity was achieved by the experimental system at
both temperatures, the vapor pressure deficit differed.
RESULTS
Two approaches were taken in the investigation of VPD and temperature interactions
11 constant temperature conditions. The other was to examine the stability of the response
profiles with short-term temperature increases.
Glycine max
Hutcheson was chosen to represent typical high-performing cultivars in the South, and it was
compared to the drought-resistant PI 416937. At a constant temperature of 25 °C,
Hutcheson’s TR increased as a linear function of VPD (Fig. 1A). There was no evidence of a
limited maximum TR. When grown and measured at a constant 30 °C, Hutcheson’s TR
increased linearly at lower VPD, but with progressive increase of VPD ≥ 1.93 kPa, TR increased at a much slower rate (Fig. 1B). The slope of the regression before the breakpoint
(S1) was 34.0 mg m-2 s-1 kPa-1, and it decreased to 5.85 mg m-2 s-1 kPa-1 after the breakpoint
(S2) (Table 4). This represented a significant leveling off of transpiration rate at high VPD.
When Hutcheson was grown at 25 °C, but then exposed to a higher temperature of 30
°C just before and at the time of VPD measurements, the TR response remained linear (Fig.
1C). However, when Hutcheson was grown at 30 °C and then measurements were made at 35
°C, instead of leveling off at a VPD above 1.9 kPa, TR continued to increase (Fig. 1D). The
TR response over the entire range of VPD was linear, which indicated weak stability of the
maximum-TR response after a temperature increase.
PI 416937, like Hutcheson, had a linear TR response to increasing VPD at a constant
temperature of 25 °C (Fig. 2A), and exhibited TR sensitivity to high VPD at a constant
temperature of 30 °C (Fig. 2B). Although the breakpoint was similar (1.91 kPa), PI 416937
12 When temperature was raised above the growth temperature of 25 °C to 30 °C at the
measurement time, the TR of PI 416937 continued to be a linear function of VPD (Fig. 2C),
like Hutcheson. But, when the 30 °C growth temperature was increased to 35 °C, PI 416937
retained the ability to limit TR when VPD increased above 2.1 kPa (Fig. 2D). However, the
slope of the regression after the breakpoint was noticeably greater after the temperature
change (S2 = 20.8 mg m-2 s-1 kPa-1) compared to that when the growth and measurements
were both at 30 °C (S2 = 1.22 mg m-2 s-1 kPa-1) (Table 4).
Glycine soja
The VPD-temperature interaction of wild soybean was different than that of domesticated
soybean. Results for the four genotypes are shown in Tables 3 and 4. Two genotypes were
used to illustrate the different VPD responses graphically (Figs. 3 and 4).
The TR response to VPD and its temperature interaction were variable within the
wild soybean accessions. One genotype, PI 549033 (USDA-ARS, 1991), had a linear
response to VPD at a constant temperature of 25 °C (Fig. 3A). At that temperature, the three
other genotypes were best fit by the two-segment regression (Fig. 4A, Table 3). PI 468397A
and PI 468917 (USDA-ARS, 1982a, 1982b) had similar breakpoints of 1.14 and 1.16 kPa,
while PI 597454A (USDA-ARS, 1997) had a much higher breakpoint of 1.45 kPa. In
contrast to the responses at 25 °C, at the 30 °C growth and measurement regime, TR of all
genotypes was a linear function of VPD (Figs. 3B, 4B; Table 4).
The wild soybean genotypes exhibited the same general TR responses to VPD when
13 linear response when grown and measured at 25 °C continued to respond linearly after the
shift to 30 °C, while those genotypes with two-segment responses at continuous 25 °C
continued to exhibit breakpoints after the temperature shift. For the genotypes with
breakpoints, some differences were apparent in the VPD response profiles. For example, PI
597454A had an S2 value of -0.53 mg m-2 s-1 kPa-1 when measured at the 25 °C growth
temperature, but S2 increased to 13.1 mg m-2 s-1 kPa-1 when the measurement temperature
was increased to 30 °C (Table 3). Therefore, TR at high VPD was effectively controlled at 25
°C, but after the temperature increased to 30 °C, control was less effective. The other two
wild soybean genotypes with breakpoints had S2 values that were similar to their respective
values before and after the temperature shift (Table 3). There was a consistent trend for the
breakpoint value to increase with the shift in temperature. For example, PI 468397A had a
pronounced shift in its breakpoint from 1.14 to 1.76 kPa (Fig. 4A, C).
When wild soybean was grown at a constant temperature of 30 °C and then switched
to 35 °C for the VPD measurements, the TR responses were consistent, remaining a linear
function of VPD for all wild soybean accessions (Table 4). While the response pattern was
uniform among the genotypes, there were some differences in S1 values.
DISCUSSION
A main purpose for these experiments was to determine if temperature altered TR
responses to VPD. The results clearly indicated that temperature and TR interactions are
present. The interaction was prominent in both domesticated and wild soybean, although it
14 not restrict TR in response to VPD at 25 °C but, when grown at 30 °C, TR increased only
slightly as VPD increased beyond approximately 1.9 kPa. With an abrupt temperature shift
upward from 30 °C to 35 °C, the VPD-sensitive response of the variety Hutcheson was lost,
but it was retained to an extent by drought resistant PI 416937. And TR increased slowly as
VPDs were increased above 1.1 to 2.0 kPa in most wild soybean genotypes at the cooler
growth temperature of 25 °C, but no TR restriction was detected when wild soybean was
grown at the higher temperature of 30 °C. In general, our observations are consistent with
those of Wilson and Bunce (1997), whose work with stomatal conductance (gs) response to
CO2 at different temperatures provided the initial evidence for a temperature and TR
interaction in soybean. In their experiments, soybean plants (cv. Clark; MG IV) were grown
between 30 °C and 35 °C, and single-leaflet measurements of gs were taken at 25 °C, 30 °C,
and 35 °C over a range of VPDs. Although their treatment conditions were not identical to
ours, the results at ambient CO2 levels consistently indicated that the restriction in stomatal
conductance with increasing VPD diminished as temperature increased.
Differential expression of the VPD-temperature interactions in wild and domesticated
soybean appears reasonable when considered within a developmental context. Both species
are thought to originate from the temperate climate of China (Hymowitz and Singh, 1987).
While the temperature optimum of wild soybean is not well documented, the North China
Plain, the source of the wild soybean accessions employed in this study, has average
maximum temperatures near 20 °C (Mo et al., 2009). Previous studies of soybean and
various weed species have suggested that temperature adaptations tend to be a highly
15 in wild soybean in increasing VPD only at 25 °C reflects the temperate climate adaptation.
The soybean variety Hutcheson, on the other hand, is a product of breeding targeted to the
southern USA climate, where a transpiration-related trait of value would be selected under
higher temperature conditions; hence, the ability to limit TR at the higher 30 °C growth
temperature. Indeed, the temperature optimum of southern USA-adapted soybean genotypes
has been reported previously to be near 30 °C (Baker et al., 1989; Tungate et al., 2007). The
exotic genotype PI 416937 displayed somewhat tighter control of TR when plants were
grown at 30 °C, i.e. a lower S2 slope with increasing VPD above 1.9 kPa, and the control
persisted to some extent with the sudden shift to the high 35 °C temperature. This TR control
by PI 416937 helps explain why it is a valued source of genetic traits in development of
drought resistant soybean germplasm (Carter et al., 2006).
An initial hypothesis was that wild soybean might serve as a source for drought
resistance traits for soybean breeding. The results indicated that genetic diversity for the TR
response to VPD is present among wild soybean accessions. Marked differences were
apparent in slopes and breakpoints at 25 °C among the genotypes. The breakpoints for TR
control were at lower VPD than in soybean, a sensitivity trait that could offer an advantage in
water retention. However, because the TR control was limited to the lower temperature
range, expression of the trait appears problematic in the development of soybean germplasm
suited to warmer areas like those in the southern USA, unless the breakpoint/temperature
16 Temperature dependent VPD responses can explain some of the inconsistencies in the
literature for soybean. In experiments with the Monsanto cultivar A5959 (MG V), for
example, a two-segment TR response to VPD was observed in one study when the average
measurement temperature was 30 °C (Sinclair et al., 2008), but a linear TR response to VPD
occurred in another when the average growth temperature was 34.9 °C (Fletcher et al., 2007).
The results measured at 30 and 35 °C thus were similar to those in our experiments with
Hutcheson. The similarities between A5959 and Hutcheson extended further, as S1 and S2
values of 33.2 and 5.7 mg m-2 s-1 kPa-1 for A5959 at 30 °C (Sinclair et al., 2008) were quite
similar to the 34 and 5.8 mg m-2 s-1 kPa-1 observed here with Hutcheson at 30 °C (Table 4).
And the slope of the linear response for A5959 at 35 °C (Fletcher et al., 2007) was similar to
that for Hutcheson. We cannot know with certainty if there is a genetic connection between
A5959 (a proprietary Monsanto variety) and Hutcheson, but Hutcheson was one of the
most-used parents between 1990 and 2008 for the Southern germplasm of Monsanto (Mikel et al.,
2010), so a genetic link seems possible. If true, it would demonstrate that TR control traits
are heritable and available for soybean improvement. A previous greenhouse study focused
on variability in a recombinant inbred soybean population revealed complex heritability of
the TR-VPD trait (Sadok and Sinclair, 2009). Those experiments may have been
compromised, however, by differing growth temperatures which ranged from 20 to 33 °C.
Leaf VPD responses, of course, are just one type of trait that can contribute to drought-stress
resistance in situ, and field studies indicate there may be some differences between A5959
and Hutcheson. In one comparison, A5959 was observed to be a fast-wilting cultivar while
17 While the results of our experiments were clear and repeatable, it should be
mentioned that there may be interactions between TR and CO2 in the VPD chambers. Carbon
dioxide in the entering and exiting air flows was not measured. At the lower flow rates, CO2
concentrations in the chambers may have been lowered considerably by plant photosynthesis.
However, the species and genotype comparisons are likely not compromised for several
reasons. First, recent studies in the greenhouse and field using a portable leaf chamber in
which CO2 was closely controlled (Gilbert et al., 2011a, 2011b) have fully confirmed the
distinctions among soybean genotypes in their response to VPD that were documented using
these whole-plant chambers in previous studies (Fletcher et al., 2007; Sadok and Sinclair,
2009) and in the current experiments. Second, plants in our study were well watered and the
experiments were done under light saturation; thus, one would expect the stomata are already
at or near fully open aperture. Thus, it is unlikely a lowered CO2 concentration in the
chambers would have greatly increased stomatal conductance. And third, the TR steadily
increased in some circumstances and was sharply restricted with breakpoints in others, even
as gas flow rates and VPD were steadily increased, and CO2 likely increased steadily toward
ambient. The TR responses are inconsistent with those that would be expected if TR
(stomata) control were being dominated by CO2.
Mechanistic Implications
The TR response profiles of wild and domesticated soybean offer insights into the
mechanism(s) controlling water release. Two kinetically definable systems appear to be
involved. For example, when TR increases were restricted above a VPD of 1.9 kPa in
18 unaffected. Thus ‘System I’, TRs occurring below 1.9 kPa, exhibited little or no restriction.
In contrast, the segment of the TR response curve above 1.9 kPa was tightly constrained in
both soybean genotypes. Regulation of the second segment, or ‘System II’, controlled the
upper capacity for water movement through the plant. The VPD responses to temperature
indicated that System II is dynamic and influenced by the growth environment. Expression of
System II regulation also appears to become engaged in a temperature range where maximal
growth rates occur, 30 °C for domesticated and 25 °C for wild soybean.
Recognition of the System II response underscores the possible importance of
‘physiological plasticity’ in controlling TR under high VPD. As with all crop plants in the
field, soybean experiences short term changes in VPD during a day as atmospheric vapor
pressure changes. In summer months, the VPD changes most often would be accompanied
(and driven) by increasing temperatures as a day progresses. The absence of a definable
breakpoint with Hutcheson when it was shifted to 35 °C implies that regulation of System II
became inoperable. The presence of a two-phase response to VPD by soybean PI 416937 at
35°C indicates that some degree of System II regulation persisted in this drought-resistant
genotype. All three wild soybean genotypes exhibiting the System II response pattern
retained System II regulation with the shift to the higher temperature above its 25 °C growth
optimum, but S2 values tended to vary (Table 3). Thus, genetic diversity for the ‘plasticity’ of
the System II regulatory response was present in the wild progenitor to soybean when it was
expressed. The exotic soybean PI 416937 obviously has retained elements of the System II
regulatory trait. It was observed previously that PI 416937 exhibited stress responses
19 Rapid changes in the engagement of System II in the soybean species indicate that the
capacity for water movement through the plant probably is not due to a structural limitation
(cf. Sinclair et al., 2008). If the xylem carrying capacity were limiting, for example, then one
might expect TR responses to VPD to remain stable when plants were exposed to short-term
temperature changes. The similarity of S2 values in one of the wild soybean genotypes (PI
468397A) before and after the temperature shift from 25 to 30 °C means the possibility of
structural limitations cannot be dismissed in that instance. So what internal mechanism
regulates System II in domesticated and wild soybean with temperature-sensitive S2 values?
While the results of this study do not offer direct evidence to resolve this question, recent
experiments with soybean PI 416937 indicated hydraulic conductance between the xylem
and guard cells of PI 416937 may be controlled by an aquaporin (AQP) family sensitive to
AQP inhibitor AgNO3 (Sadok and Sinclair, 2010a, 2010b), and aquaporin function seems to
be temperature sensitive (Ionenko et al., 2010; Cochard et al., 2007). If aquaporins were
involved, it opens the possibility that AQP-specific molecular markers could be used to
20
REFERENCES
Baker, J.T., L.H. Allen, K.J. Boote, P. Jones, and J.W. Jones. 1989. Response of soybean to air-temperature and carbon-dioxide concentration. Crop Sci. 29:98-105.
Bowers, G.R. 1995. An early soybean production system for drought avoidance. J. Prod. Agric. 8:112-119.
Buss, G.R., H.M. Camper, and C.W. Roane. 1988. Registration of Hutcheson soybean. Crop Sci. 28:1024-1025.
Carter, T.E., Jr., and T.W. Rufty. 1993. Soybean plant introductions exhibiting drought and aluminum tolerance. p. 335-346. In C.G. Kuo (ed.) Adaptation of food crops to temperature and water stress: Proceedings of an international symposium, Taiwan, 13-18 Aug. 1992. Asian Vegetable Research and Development Center, Taipei, Taiwan.
Carter, T.E., Jr., P.I. De Souza and L.C. Purcell. 1999. Recent advances in breeding for drought and aluminum resistance in soybean. p. 106-125. In H. Kauffman (ed.) Proceedings at the World Soybean Research Conference. VI, Chicago, IL. 4-7 Aug. 1999. Superior Printing, Champagne, IL.
Carter, T.E., Jr., Z. Gizlice, and J.W. Burton. 1993. Coefficient of parentage and genetic similarity estimates for 258 North American soybean cultivars released by public agencies during 1954-88. Rep. USDA Tech Bull no 1814. US Gov Print Office, Washington, DC.
Carter, T.E., Jr., N.L. Nelson, C.H. Sneller, and Z. Cui. 2004. Genetic diversity in soybean. p. 303-416. In H.R. Boerma and J.E. Specht (eds.) Soybeans: Improvement, production, and uses. 3rd ed. Am. Soc. Agron.-Crop Sci. Soc. Am.-Soil Sci. Soc. Am., Madison, WI, USA.
Carter, T.E., Jr., J.H. Orf, L.C. Purcell, J.E. Specht, P.Y. Chen, T.R. Sinclair, T.W. Rufty. 2006. Tough times, tough plants – New soybean genes defend against drought and other stresses. Proceedings of the 33rd Soybean Seed Research Conference. CD-ROM, American Seed Trade Association, Alexandria, VA.
21 Cochard, H., J. Venisse, T.S. Barigah, N. Brunel, S. Herbette, A. Guillot, M.T. Tyree, and S. Sakr. 2007. Putative role of aquaporins in variable hydraulic conductance of leaves in response to light. Plant Phys. 143:122-133.
Devi, M.J., T.R. Sinclair, and V. Vadez. 2010. Genotypic variation in peanut for transpiration response to vapor pressure deficit. Crop Sci. 50:191-196.
DeWit, C.T. 1958. Transpiration and crop yields. Versl. Landbouwk. Onderz. 64:6.
Fletcher, A.L., T.R. Sinclair, and L.H. Allen. 2007. Transpiration responses to vapor pressure deficit in well watered 'slow-wilting' and commercial soybean. Environ. Exp. Bot. 61:145-151.
Gholipoor, M., P.V. Vara Prasad, R.N. Mutava, and T.R. Sinclair. Genetic variability of transpiration response to vapor pressure deficit among sorghum genotypes. Field Crops Res. 119:85--90.
Gilbert, M.E., N.M. Holbrook, M.A. Zwieniecki, W. Sadok, and T.R. Sinclair. 2011a. Field confirmation of genetic variation in soybean transpiration response to vapor pressure deficit and photosynthetic compensation. Field Crops Res. (in press), doi:
10.1016/j.fcr.2011.06.011
Gilbert, M.E., M.A. Zwieniecki, and N.M. Holbrook. 2011b. Independent variation in
photosynthetic capacity and stomatal conductance leads to differences in intrinsic water use efficiency in 11 soybean genotypes before and during mild drought. J. Exp. Bot. 62(8):2875-2887.
Gillen, A.M., and G.W. Shelton. 2008. Uniform soybean tests, southern states. USDA-ARS, Stoneville, MS.
Gillen, A.M., and G.W. Shelton. 2007. Uniform soybean tests, southern states. USDA-ARS, Stoneville, MS.
Gillen, A.M., and G.W. Shelton. 2006. Uniform soybean tests, southern states. USDA-ARS, Stoneville, MS.
22 Heatherly, L.G. 1999. Early soybean production system. p. 103-118. In L.G. Heatherly, and
H.F. Hodges (eds.) Soybean Production in the Midsouth. CRC Press LLC, Boca Raton, FL.
Hufstetler, E.V., H.R. Boerma, T.E. Carter, Jr., and H.J. Earl. 2007. Genotypic variation for three physiological traits affecting drought tolerance in soybean. Crop Sci. 47:25-35.
Hymowitz, T., and R.J. Singh. 1987. Taxonomy and speciation. p. 23-48. In J.R. Wilcox (ed.) Soybeans: Improvement, production, and uses. 2nd ed. Am. Soc. Agron.-Crop Sci. Soc. Am.-Soil Sci. Soc. Am., Madison, WI, USA.
Ionenko, I.F., A.V. Anisimov, and N.R. Dautova. 2010. Effect of temperature on water transport through aquaporins. Biologia Plantarum 54:488-494.
James, A.T., R.J. Lawn, and M. Cooper. 2008. Genotypic variation for drought stress response traits in soybean. I. variation in soybean and wild glycine spp. for epidermal conductance, osmotic potential, and relative water content. Aust. J. Agric. Res. 59:656-669.
King, C.A., L.C. Purcell, and K.R. Brye. 2009. Differential wilting among soybean genotypes in response to water deficit. Crop Sci. 49:290-298.
Mikel, M.A., B.W. Diers, R.L. Nelson, and H.H. Smith. 2010. Genetic diversity and agronomic improvement of North American soybean germplasm. Crop Sci. 50:1219-1229.
Mo, X., S. Liu, Z. Lin, and R. Guo. 2009. Regional crop yield, water consumption and water use efficiency and their responses to climate change in the North China Plain. Agric. Ecosyst. Environ. 134:67-78.
Place, G., D. Bowman, M. Burton, and T. Rufty. 2008. Root penetration through a high bulk density soil layer: Differential response of a crop and weed species. Plant and Soil 307:179-190.
Purcell, L.C., T.R. Sinclair, and R.W. McNew. 2003. Drought avoidance assessment for summer annual crops using long-term weather data. Agron. J. 95:1566-1576.
23 and uses. 3rd ed. Am. Soc. Agron.-Crop Sci. Soc. Am.-Soil Sci. Soc. Am., Madison, WI, USA.
Sadok, W., and T.R. Sinclair. 2010a. Genetic variability of transpiration response of soybean [Glycine max (L.) Merr.] shoots to leaf hydraulic conductance inhibitor AgNO3. Crop Sci. 50:1423-1430.
Sadok, W., and T.R. Sinclair. 2010b. Transpiration response of 'slow-wilting' and
commercial soybean (Glycine max (L.) Merr.) genotypes to three aquaporin inhibitors. J. Exp. Bot. 61:821-829.
Sadok, W., and T.R. Sinclair. 2009. Genetic variability of transpiration response to vapor pressure deficit among soybean (Glycine max [L.] Merr.) genotypes selected from a recombinant inbred line population. Field Crops Res. 113:156-160.
Sermons, S.M., M.G. Burton, and T.W. Rufty. 2008. Temperature response of Benghal dayflower (Commelina benghalensis): Implications for geographic range. Weed Sci. 56:707-713.
Sinclair, T.R., C.D. Messina, A. Beatty, and M. Samples. 2010. Assessment across the United States of the benefits of altered soybean drought traits. Agron. J. 102:475-482.
Sinclair, T.R., M.A. Zwieniecki, and N.M. Holbrook. 2008. Low leaf hydraulic conductance associated with drought tolerance in soybean. Physiol. Plantarum 132:446-451.
Sloane, R., R. Patterson, and T.E. Carter, Jr. 1990. Field drought tolerance of a soybean plant introduction. Crop Sci. 30:118-123.
Tungate, K.D., D.W. Israel, D.M. Watson, and T.W. Rufty. 2007. Potential changes in weed competitiveness in an agroecological system with elevated temperatures. Environ. Exp. Bot. 60:42-49.
USDA-ARS National Genetic Resources Program. 1997. Germplasm Resources Information Network (GRIN) database. Glycine soja Siebold & Zucc. FABACEAE 'PI 597454A'. Available at http://www.ars-grin.gov/cgi-bin/npgs/acc/display.pl?1584255. National Germplasm Resources Laboratory, Beltsville, MD.
24 Available at http://www.ars-grin.gov/cgi-bin/npgs/acc/display.pl?1443969. National Germplasm Resources Laboratory, Beltsville, MD.
USDA-ARS National Genetic Resources Program. 1982a. Germplasm Resources
Information Network (GRIN) database. Glycine soja Siebold & Zucc. FABACEAE 'PI 468397A'. Available at http://www.ars-grin.gov/cgi-bin/npgs/acc/display.pl?1488309. National Germplasm Resources Laboratory, Beltsville, MD.
USDA-ARS National Genetic Resources Program. 1982b. Germplasm Resources
Information Network (GRIN) database. Glycine soja Siebold & Zucc. FABACEAE 'PI 468917'. Available at http://www.ars-grin.gov/cgi-bin/npgs/acc/display.pl?1363853. National Germplasm Resources Laboratory, Beltsville, MD.
USDA-ARS National Genetic Resources Program. 1977. Germplasm Resources Information Network (GRIN) database. Glycine max L. Merr. FABACEAE 'PI 416937'. Available at http://www.ars-grin.gov/cgi-bin/npgs/acc/display.pl?1314868. National Germplasm Resources Laboratory, Beltsville, MD.
25
Table 1. Description of drought resistance characteristics of wild and domesticated soybean
genotypes used in experiments.
Species Genotype MG †
Geographic adaptation
or origin Description Reference
G. max Hutcheson V Southern
USA Intermediate wilting in field King et al., 2009
Intermediate WUE‡ Hufstetler et al.
2007
PI 416937 V Japan Slow wilting in field Sloan et al., 1990;
King et al., 2009
VPD§-sensitive transpiration rate Fletcher et al. 2007
G. soja PI 468917 III Liaoning,
China Variable wilting with soil drying (pot) Preliminary screen
PI 597454A
III Shanxi, China Variable wilting with soil drying
(pot)
Preliminary screen
PI
468397A III Shanxi, China Rapid (pot) wilting with soil drying Preliminary screen
PI 549033 IV Liaoning,
China
Slow wilting with soil drying (pot)
Preliminary screen
†MG, maturity group ‡WUE, water use efficiency
26
Table 2. Summary of experiments measuring transpiration rate (TR) response to vapor
pressure deficit (VPD) at 25 °C and 30 °C growth temperatures. Includes the VPD
measurement temperatures, range of VPD during measurements, and mean leaf area (±s.e.) of Glycine max and Glycine soja plants.
Growth Temper-ature (°C)
Species Experiment Run Measurement Temperature (°C) VPD Range (kPa) Mean Leaf Area ±s.e. (cm2)
Days After
Planting Replic-ations
25 °C G. max 1 a 25 1.19 - 2.56 --- † 4
b 30 1.25 - 3.30 174.6 ± 13.9 22 4
c 25 0.93 - 2.81 --- 4
d 30 1.29 - 3.50 191.5 ± 11.5 24 4
2 a 25 0.96 - 2.87 --- 6
b 30 1.36 - 3.72 226.5 ± 21.9 26 6
G. soja 3 a 25 0.75 - 2.34 --- 3
b 30 0.89 - 3.18 359.7 ± 42.3 38 3
c 25 0.62 - 2.61 --- 3
d 30 1.41 - 3.27 388.2 ± 24.6 40 3
4 a 25 0.53 - 2.02 --- 3
b 30 0.75 - 3.01 564.7 ± 41.2 40 3
c 25 0.56 - 2.39 --- 3
d 30 0.72 - 3.20 748.5 ± 35.7 42 3
30 °C G. max 5 a 30 0.86 - 3.00 --- 3
b 35 1.43 - 3.72 473.7 ± 45.4 19 3
6 a 30 1.18 - 3.41 --- 6
b 35 1.29 - 3.51 294.0 ± 13.2 20 6
7 a 30 1.00 - 3.08 --- 6
b 35 1.26 - 3.55 468.1 ± 29.1 19 6
G. soja 8 a 30 1.06 - 3.30 --- 6
b 35 1.27 - 3.57 374.0 ± 24.2 22 6
9 a 30 1.14 - 3.61 --- 6
b 35 1.12 - 3.47 518.1 ± 27.4 29 6
27
Table 3. Results of regression analysis of transpiration rate (TR) on vapor pressure deficit
(VPD). The best-fit regression and corresponding regression coefficients, S1, S2, and X0 (see notes below for meanings of abbreviations), ± standard errors are reported for two Glycine max and four Glycine soja genotypes grown at 25 °C. Plants were measured for one day at the growth temperature (25 °C) and again the next day immediately after the temperature was increased 5 °C (25 °C →30 °C).
Glycine max Glycine soja
Hutcheson PI 416937 PI 468917 PI 597454A PI 468397A PI 549033 ——————–––––––———— 25 °C ————————––––––———— Best-fit
Regression Linear Linear Two-segment Two-segment Two-segment Linear S1 , mg m-2 s-1 kPa-1 14.4 ± 2.3 14.9 ± 2.4 40.8 ± 5.5 35.1 ± 0.0 45.7 ± 6.4 28.5 ± 2.4
S2 , mg m-2 s-1 kPa-1 --- --- 10.9 ± 2.7 -0.53 ± 0.0 10.6 ± 2.6 ---
X0 , kPa --- --- 1.16 ± 0.1 1.45 ± 0.0 1.14 ± 0.1 ---
r2 0.54 0.50 0.92 0.89 0.92 0.83
n 42 42 30 33 30 30
–––––––––––––––––––––––– 25 °C →30 °C ––––––––––––––––––––––––– Best-fit
Regression Linear Linear Two-segment Two-segment Two-segment Linear S1 , mg m-2 s-1 kPa-1 16.3 ± 2.7 18.3 ± 2.4 33.7 ± 3.3 35.0 ± 3.9 43.1 ± 7.2 26.3 ± 2.6
S2 , mg m-2 s-1 kPa-1 --- --- 4.39 ± 4.5 13.1 ± 2.7 9.25 ± 4.8 ---
X0 , kPa --- --- 2.00 ± 0.1 1.81 ± 0.2 1.76 ± 0.2 ---
r2 0.47 0.59 0.89 0.94 0.87 0.79
n 42 42 30 33 30 30
S1= the slope of a linear regression, or the slope of the segment before the breakpoint of a two-segment regression.
S2=the slope of the segment after the breakpoint of a two-segment regression.
X0=the breakpoint of a two-segment regression.
28
Table 4. Results of regression analysis of transpiration rate (TR) on vapor pressure deficit
(VPD). The best-fit regression and corresponding regression coefficients, S1, S2, and X0 (see notes below for meanings of abbreviations), ± standard errors are reported for two Glycine max and four Glycine soja genotypes grown at 30 °C. Plants were measured for one day at the growth temperature (30 °C) and again the next day immediately after the temperature was increased 5 °C (30 °C →35 °C).
Glycine max Glycine soja
Hutcheson PI 416937 PI 468917 PI 597454A PI 468397A PI 549033 ——————–––––––———— 30 °C ————————––––––———
— Best-fit
Regression
Two-segment Two-segment Linear Linear Linear Linear
S1 , mg m-2 s-1 kPa-1 34.0 ± 5.4 42.1 ± 6.2 25.8 ± 1.8 31.7 ± 1.5 29.7 ± 1.6 34.8 ± 2.2
S2 , mg m-2 s-1 kPa-1 5.85 ± 4.2 1.22 ± 4.0 --- --- --- ---
X0 , kPa 1.93 ± 0.2 1.91 ± 0.1 --- --- --- ---
r2 0.83 0.80 0.92 0.97 0.95 0.92
n 30 36 18 18 21 24
–––––––––––––––––––––––– 30 °C →35 °C ––––––––––––––––––––––––– Best-fit
Regression
Linear Two-segment Linear Linear Linear Linear
S1 , mg m-2 s-1 kPa-1 30.9 ± 2.5 51.3 ± 11 23.9 ± 4.3 32.9 ± 4.2 26.7 ± 2.5 28.2 ± 2.8
S2 , mg m-2 s-1 kPa-1 --- 20.8 ± 3.5 --- --- --- ---
X0 , kPa --- 2.10 ± 0.2 --- --- --- ---
r2 0.79 0.85 0.71 0.83 0.90 0.88
n 45 45 15 15 15 15
S1= the slope of a linear regression, or the slope of the segment before the breakpoint of a two-segment regression.
S2=the slope of the segment after the breakpoint of a two-segment regression.
29
Figure 1. Transpiration rate (TR, expressed per unit leaf area) response to vapor pressure
30
Figure 2. Transpiration rate (TR, expressed per unit leaf area) response to vapor pressure
31
Figure 3. Transpiration rate (TR, expressed per unit leaf area) response to vapor pressure
32
Figure 4. Transpiration rate (TR, expressed per unit leaf area) response to vapor pressure
deficit (VPD) for Glycine soja genotype PI 468397A. Growth temperature denoted by “G” and measurement temperature denoted by “M” in parenthesis of panel title. Best-fit
33
CHAPTER 2
Below-ground Physiological Properties of a Drought Resistant Wild Soybean Genotype: Transpiration Control with Soil Drying and Expression of Root Morphology
ABSTRACT
Wild soybean accession PI 468917 [Glycine soja (Sieb. and Zucc.)] was examined for
possible water-use and root morphology traits that could potentially be beneficial in the
development of drought resistant soybean cultivars. Experiments were carried out in
controlled environment chambers maintained at different temperatures (25, 30, and 35 °C).
Temperature was considered an important experimental variable because droughts in the
USA often occur concurrent with high temperatures in summer months. Results indicated
that water use efficiency (dry weight per unit of water transpired) of wild soybean was lower
than that for the domesticated soybean cultivar Hutcheson at all temperatures. In experiments
where transpiration was monitored as soil dried, wild soybean decreased water use at a
higher soil water content than domesticated soybean, but transpiration control occurred only
at 25 °C. Examination of root morphology with plants growing in hydroponics under optimal
conditions indicated that wild soybean had much greater root length than the modern
soybean, with the greater length expressed in roots with diameters between 0.25 and 0.50
mm. Greater length was most apparent at 25 °C, and the wild soybean advantage dissipated
as the growth temperature increased. The results indicated that wild soybean populations may
well possess traits that can be used to improve drought resistance of modern soybean.
34 strategies found to be advantageous to drought resistant soybean in field experiments, and the
potential for greater root length could enhance water acquisition from the soil profile. But,
use of the traits in breeding programs will depend upon breaking their linkage with cool
temperature.
INTRODUCTION
Drought is one of the most intractable problems for soybean [Glycine max (L.) Merr.]
production systems in much of the USA. Severe drought occurs once out of every three or
four years and moderate drought once out of every two years (Carter et al., 1999). This has
led to large-scale plant breeding efforts to develop drought resistant soybean cultivars.
The soybean breeding programs in the USA have been successful in producing
agronomically acceptable genotypes with improved performance under drought conditions.
One of the important elements in the breeding process has been utilization of genetic traits
originating from exotic germplasm. In particular, it was found some years ago that the
Japanese Plant Introduction (PI) 416937 maintained leaf turgor longer into drought periods
than standard cultivars (Sloan et al., 1990), and the response translated into higher soybean
yields under drought conditions. Later experiments revealed that the ‘slow-wilting’
phenotype reflected regulation of transpiration rate at high vapor pressure deficits (VPD)
(Fletcher et al., 2007; Sinclair et al., 2008). This regulation, presumably involving stomatal
closure, is expressed as temperatures increase (Seversike et al., 2011) and might be linked
with the activity of aquaporins (Sadok and Sinclair, 2009). Other research has shown that PI
35 1999), which evidently allows more thorough exploration of field soils (Hudak and Patterson,
1996) and access to soil water. And, importantly for the many regions in Asia and the
southeastern USA with highly weathered, acid soils (von Uexkull and Mutert, 1995), the root
system of PI 416937 is more tolerant of higher levels of soil aluminum than most modern
soybean cultivars (Campbell and Carter, 1990; Silva et al., 2001a). The advantageous traits,
either singly or collectively, are the basis for enhanced performance of PI 416937 under
drought conditions.
The presence of multiple advantageous traits in PI 416937 for abiotic stress
underscores the value of examining the whole-plant physiology of high performing exotic
genotypes. Resistance to limitations in major resources like water and nutrients invariably
will involve many layers of regulation integrated with one another. In the case of PI 416937,
natural and human assisted selection over time evidently resulted in the group of favorable
traits.
In the research described in this manuscript, we examine the physiological traits of a
‘wild soybean’ [Glycine soja (Sieb. and Zucc.)] genotype, PI 468917, that could possess
traits advantageous for the development of drought-resistant soybean. Wild soybean
originating from China are the progenitor to modern soybean (Hymowitz and Singh, 1987)
and possess greater genetic diversity than domesticated soybean (Nichols et al., 2007; Lam et
al., 2010). This particular wild soybean genotype was identified as having enhanced drought
36 soybean genotypes with enhanced control over transpiration with increasing VPD (Seversike
et al., 2011).
This study begins with a comparison of water use efficiencies (WUE) of the wild
soybean and the domesticated soybean cultivar Hutcheson under replete and
water-deficit conditions. Water use efficiency is often defined as the ratio of dry matter
accumulation for a given amount of water used. However, WUE ratios tend to only be
relevant to the environment in which the measurements are taken because atmospheric VPD
influence water use in combination with the inherent genetic water use characteristics of
plants. There is need for a measurement that provides a basis for making genotypic
comparisons without the possible interference of different environmental conditions. In this
work, the coefficient ‘m’, as introduced by deWit (1958) in the classical WUE literature, is
used to characterize the physiology that determines how much mass is accumulated per unit
water transpired by a plant. This m value is an inherent water use efficiency since it takes
VPD into account. This is critical for the present work because comparisons will be made
between plants grown at different temperatures/VPD. After determining whether the wild
species possesses higher m, the focus of this study moves to below-ground properties. One is
transpiration regulation during soil drying. Past experiments have indicated that hydraulic or
chemical signals originating in root systems evidently trigger stomata closure and decrease
transpiration rate (Sadras and Milroy, 1996; Davies and Zhang, 1991; Comstock, 2002;
Steudle, 2000). This type of response mechanism, potentially, could be part of the
aboveground slow-wilting trait (Sinclair et al., 2010). The second belowground property