EFFECT OF MICROSTRUCTURE EVOLUTION DUE TO PROCESSING
HISTORY OF PIPING ON RESIDUAL STRESS DISTRIBUTION IN
AUSTENITIC STAINLESS STEEL
Ryohei Ihara1, T.Hashimoto1, M.Mochizuki1
1Division of Material and Manufacturing Science, Graduate School of Engineering, Osaka University
E-mail of corresponding author: [email protected]
ABSTRACT
Stress corrosion cracking (SCC) have been observed near the heat affected zone (HAZ) of the primary loop recirculation pipes made of austenitic stainless steel type 316L in nuclear power plants. For the non-sensitization material such as a type 316L, residual stress is important factor for SCC. In the joining process of pipes, butt-welding is conducted after machining. Machining is performed to match the inside pipe diameter. Residual stress is generated by both machining and welding. In the case of welding after machining as processes of pipes, it can be considered that residual stress due to machining is varied by welding thermal cycle. In this study, the effect of welding thermal cycle on residual stress and microstructure is investigated. Residual stress variation caused by processing history is examined by X-ray diffraction method. Residual stress distribution generated by welding after machining has a local maximum stress in the HAZ. Vickers hardness also has a local maximum hardness. By using FE-SEM/EBSD, it is clarified that microstructure shows recrystallization and recovery in the high and middle temperature range of HAZ where residual stress and hardness decrease. However, in local maximum point, recrystallization and recovery do not occur. Moreover, work hardening due to welding is added to it due to machining. Residual stress distribution is determined by microstructure evolution and superposition effect of processing history. The local maximum stress in HAZ agree that SCC has been observed near the HAZ of pipes. Therefore, not only any part of manufacturing processes such as welding or machining but also treating all processes as processing history of pipes are important to evaluate accurate residual stress distribution for SCC.
INTRODUCTION
Recently, electric generation in nuclear power plants is demanded in terms of electrical power needs and environmental problems. However, nuclear power plants have some problems for safety use. One of the important problems is stress corrosion cracking (SCC). SCC have been observed near the heat affected zone (HAZ) of the primary loop recirculation pipes made of low-carbon austenitic stainless steel type 316L[1-3]. SCC is caused by three factors; they are material, environment and mechanical factors. For the non-sensitization material such as a low carbon austenitic stainless steel type 316L, it can be considered that the effect of residual stress on SCC is more important. In the joining process of pipes, butt-welding and machining is conducted. Machining is performed to match the inside pipe diameter, and provide smooth surface finishing. Residual stress is generated by both machining and welding. SCC initiates as a transgranular SCC (TGSCC) in the machined layer, and SCC propagates through the pipe thickness as an intergranular SCC (IGSCC). It is said that machining has a large contribution on SCC initiation [4-7]. However, in a manufacturing process of pipes, welding often conducted after machining. It can be considered that residual stress distribution generated by machining is varied by welding thermal cycle.
In order to make a detailed discussion of SCC, accurate evaluation of residual stress in actual pipes is required. To achieve this, not only residual stress generated by machining or welding but also residual stress variation induced by welding after machining as a manufacturing process of pipes is important. Moreover, machined layer has a different material structure from base material. In this manufacturing process, machined layer is changed by welding thermal cycle. In this study, the effect of welding thermal cycle on residual stress and microstructure is investigated.
EXPERIMENTAL PROCEDURE AND NUMERICAL ANALYSIS
Machining and Welding Conditions
mm, and feed rate is 0.1 mm/rev. The bead on plate welding using TIG arc is performed. As a welding condition, welding currents I are 120 A and arc length is 3 mm. The traveling speed is 2 mm/s, and welding length is 130 mm. Argon was used as the shielding gas at a flow rate of 15 l/min. There are three process types specimens. They are machined specimen, welding specimen and welding specimen after machining. They are named specimen M, specimen W and specimen M + W, respectively, as shown in Fig. 1.
Machining Welding
cutting speed feed rate tool
Initial
Welding
weld metal
Specimen W
Specimen M Specimen M+W
Fig. 1: Preparation of only machining, only welding and welding after machining specimens.
Measurement and Microstructure Observation
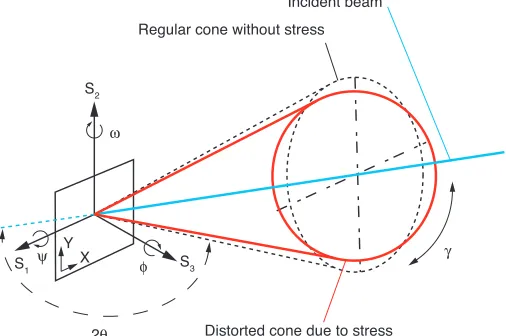
Residual stress distributions are measured by X-ray diffraction using the 2D method. Measurement device used is D8 discover with GADDS (Bruker AXS products). 2D method calculates stress from whole strain of debye cone [8]. This method can measure residual stress with accuracy. The measurement condition is presented in Table 1, and schematic illustration of measurement using two-dimensional detector is shown in Fig. 2. Generally, it is said that residual stress measurement for weld metal is difficult because of grains growth in the HAZ and orientation of weld metal. For this case, measurement with multi-axial rocking is efficient [9]. Multi-axial rocking can increase number of grains contributing diffraction. Moreover, welding residual stress have steady region at center in a longitudinal direction. In this study, for these reason, rocking is conducted for ω axial and Y axial. To evaluate
characteristics of residual stress distributions, Vickers hardness measurement is performed. The measurement device used is HMV-FA with automatic measurement system from Shimadzu. As a measurement condition, indentation load is 25 gf, and loading time is 15 seconds. Microstructure observation is performed using FE-SEM with EBSD detector (JEOL products) in order to confirm effect of welding thermal cycle on machined layer. Accelerating voltage is 25 kV. In grain orientation analysis, measurement step is 0.25 mm.
S2
S1 YX S3
2θ ω
ψ φ
Distorted cone due to stress Regular cone without stress
Incident beam
γ
Table 1: X-ray diffraction condition.
Wave length (nm) 0.2291 (CrKα)
Power (kV, mA) 36, 88
Beam size (mm) φ1
Diffraction peak (deg) 128 (220)
Measuring time (s) WM: 80, BM: 30 / 1 frame
Rocking (deg) ω: ±4, Y: ±2
WM: weld metal, BM: Base metal
RESULTS AND DISCUSSIONS
Residual Stress Variation by Manufacturing Processes
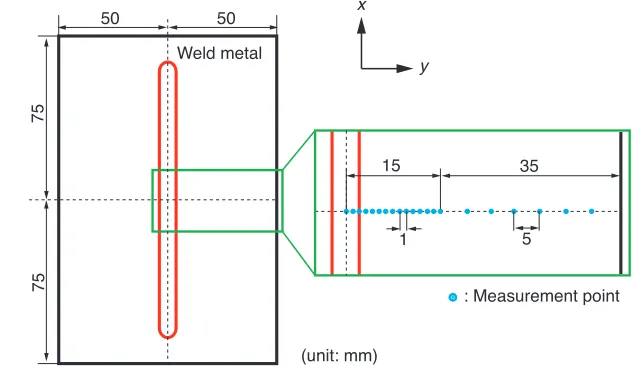
Residual stress measurement is performed for each specimen. It is well known that residual stress distribution due to welding is not uniform and have steady region near center in welding direction. Therefore, measurement is performed for center region in a longitudinal direction. Schematic illustration of measurement points for specimen W and M+W is shown in Fig. 3. Measurement is performed at 1 mm intervals until 15 mm from welding center line, and at 5 mm intervals after 15 mm.
Weld metal
15
1 5
35
: Measurement point
(unit: mm)
x
y
50 50
75
75
Fig. 3: Measurement points for residual stress distribution using X-ray diffraction method.
-200 0 200 400 600 800 1000
0 10 20 30 40
Specimen W
Ave. of specimen M
Specimen M+W
Residual stress,
! x
(MPa)
Distance from welding center line, d (mm)
Fusion boundary -200
0 200 400 600 800 1000
0 10 20 30 40
Specimen W
Ave. of specimen M
Specimen M+W
Residual stress,
! y
(MPa)
Distance from welding center line, d (mm) Fusion boundary
(a) x direction (b) y direction
Fig. 4: Comparison of residual stress distribution generated by specimen W (welding), M (machining) and M+W (welding after machining).
Vickers Hardness Variation by Manufacturing Processes
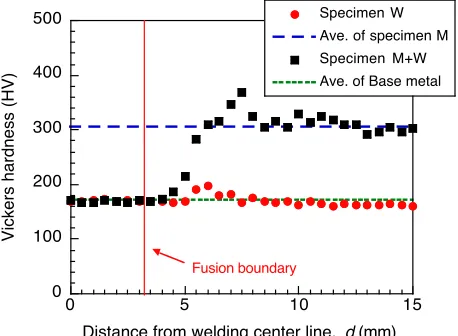
Vickers hardness measurement is performed to discuss characteristic of residual stress distribution induced by welding after machining. Measurement is conducted range of 0 to15 mm from welding center line at 0.5 mm intervals. For specimen M, measurement is conducted for arbitrary 15 points, and average of Vickers hardness is used. Comparison of Vickers hardness distributions is shown in Fig. 5. The average of base metal in Fig. 5 is result of arbitrary 10 points measurement, and this is 171.2 HV. Result of Vickers hardness of specimen W has a hardening region near 6 mm from welding center. This is caused by work hardening due to welding. The other points show almost the same hardness as average of base metal. Result of specimen M shows high hardness in whole region. This average is 306.9 HV. This is caused by work hardening induced by machining. Result of specimen M + W shows the average of base metal near the weld metal. However, it has a local maximum hardness at 7.5 mm from welding center. This indicates about 370 HV. Since, this decreases slightly, and agrees with average of specimen M after 8 mm from weld center. Therefore, the local maximum hardness in specimen M + W is caused by superposition effect of work hardening due to machining and welding. This superposition effect occurs near 7 mm, but do not occur since 8 mm.
0 100 200 300 400 500
0 5 10 15
Specimen W Ave. of specimen M Specimen M+W Ave. of Base metal
Vickers
hardness
(HV)
Distance from welding center line, d (mm)
Fusion boundary
Microstructure Evolution by Welding Thermal Cycle
Microstructure observation using FE-SEM with EBSD is performed for specimen M + W. Observation is conducted for 3 regions near the surface in y-z cross-section. They are 3.5, 5.5 and 7.5 mm from welding center line. A schematic illustration of microstructure observation is shown in Fig. 6. In this microstructure observation, they are named region A, B and C, respectively, as shown in Fig. 6. Region A locate is near the fusion boundary, and region C locate the local maximum point of residual stress and Vickers hardness. Region B locate intermediate between region A and C.
z y x
welding center line weld metal 3.5
5.5 7.5
(unit: mm)
: measurement region using EBSD
A B C
Fig. 6: Schematic illustration of microstructure observation for specimen M+W using FE-SEM/EBSD.
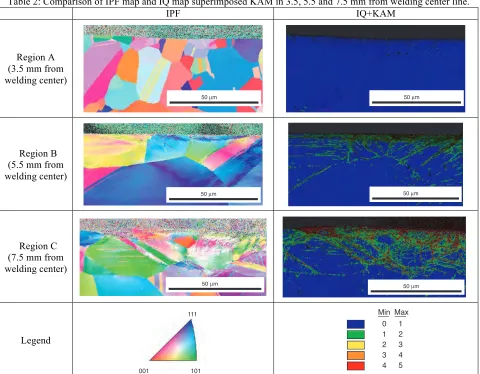
Table 2: Comparison of IPF map and IQ map superimposed KAM in 3.5, 5.5 and 7.5 mm from welding center line.
IPF IQ+KAM
Region A (3.5 mm from welding center)
50 µm 50 µm
Region B (5.5 mm from welding center)
50 µm 50 µm
Region C (7.5 mm from welding center)
50 µm 50 µm
Legend
111
001 101
Min 0 1 2 3 4
Results of microstructure observation in each region are shown in Table 2. They show inverse pole figure (IPF) map and image quality (IQ) map superimposed kernel average misorientation (KAM). IQ map shows reliability. KAM shows misorientation in adjacent pixels, and is used as a barometer of dislocation density. KAM map correlate with plastic strain distribution [10]. IPF map in region A shows no effect of plastic deformation due to welding and machining. By the same token, KAM shows low value. In IPF map of region B, there are orientation rotations and slip lines near the surface. KAM shows higher value than region A. IPF map in region C shows many orientation rotations and slip lines rather than other regions, and they exist deeply from surface. Moreover, there are random pattern points near the surface. They mean difficult points of measurement. They are results affected by plastic deformation due to machining. KAM in region C shows the highest value. This result means that region C have the largest plastic deformation in these regions.
From these results, it can be considered that recrystallization and recovery due to welding thermal cycle occurs in machined layer. Machined layer after machining have many damages like region C. However, in region A, dislocation induced in machining is disappeared perfectly by welding thermal cycle, and grain size decrease. These results show that recrystallization is occurred in welding. Therefore, residual stress of specimen M + W shows similar value with residual stress due to welding without machining, and Vickers hardness shows the value of base metal. This is because grains grow after nucleation with no plastic strain. In region B, dislocation density decrease rather than region C, but grain size isn’t decrease. Therefore, recrystallization is not occur, but recovery occurs partly. Then, work hardening due to machining decrease, and residual stress and Vickers hardness shows lower value than only machining. In region C, recovery doesn’t occur, and dislocation is not disappeared. Moreover, the plastic deformation is generated by welding as shown in Fig. 5. This is small rather than plastic strain generated by machining, but results a local maximum hardness due to superposition effect. As a result, residual stress and Vickers hardness distribution due to welding after machining have a local maximum point resulting from superposition effect of manufacturing processes.
CONCLUSION
In this study, residual stress variation due to manufacturing processes of pipe is investigated using X-ray diffraction method. Residual stress distributions generated by welding after machining have local maximum stress in the HAZ. Vickers hardness distribution shows same tendency as residual stress distribution, and have local maximum hardness. These stress and hardness are higher value than only welding or only machining. Microstructure observation using FE-SEM/EBSD is performed in order to clarify the local maximum stress. The dislocation near the fusion boundary is disappeared perfectly by recrystallization due to welding thermal cycle. However, dislocation in local maximum point is not disappeared. As a result, stress and hardness have a local maximum point resulting from the superposition effect of machining and welding in the region that recrystallization and recovery is not occurred. The location of the local maximum stress correspondents the region that SCC has been observed. Therefore, in order to evaluate initiation and propagation of SCC, not only one process but also all processes are important.
ACKNOLEDGEMENT
This study is supported by global COE program “Advanced Structural and Functional Materials Design” in Osaka university.
REFERENCES
[1] Y. Okamura, A. Sakashita, T. Fukuda, H. Yamashita and T. Futami, “Latest SCC Issues of Core Shroud and Recirculation Piping in Japanese BWRs”, International Conference on Structural Mechanics in Reactor Technology, Prague, Czech Republic, WGO1-1, August, 2003.
[2] S. Suzuki, K. Kumagai, C. Shitara, J. Mizutani, A. Sakashita H. Tokuma and H. Yamashita: “Damage evaluation of SCC in primary loop recirculation system pipe”, Maintenology, Vol. 3, No. 2, 2004, pp. 65-70.
[4] J. Kuniya, S. Kasahara, H. Anzai and H. Fujimori, “Stress Corrosion Cracking Susceptibility of Various Solution Annealed Austenitic Stainless Steels in High Temperature Water”, Journal of Zairyo-to-Kankyo, Vol. 56, 2007, pp. 22-28. (in Japanese)
[5] T. Masuoka, M. Mayuzumi, T. Arai and J. Tani, “Effect of Work Hardening on Stress Corrosion Cracking Propagation in SUS316L Stainless Steel”, Journal of Zairyo-to-Kankyo, Vol. 56, 2007, pp. 93-98. (in Japanese)
[6] J. Isselin, A. Kai, K. Sakaguchi and T. Shoji, “Assessment of the Effect of Cold Work on Crack Initiation in a Light Water Environment Using the Small-Punch Test”, Journal of Metallurgical and Materials Transactions A, Vol. 39A, 2008, pp.1099-1108.
[7] K. Takeda, A. Taniyama, T. Kudo, H. Uchida and J. Mizuki, “SCC Behavior at Hardened Surface Layer of 316(LC) in Water on High Temperature”, Journal of Zairyo-to-Kankyo, Vol. 58, 2009, pp. 228-233. (in Japanese)
[8] B. B. He, “Introduction to two-dimensional X-ray diffraction”, Powder Diffraction, Vol. 18, 2003, pp. 71-85.