Copyright to IJIRCCE DOI: 10.15680/IJIRCCE.2017. 0508021 13983
Simulation of Cloud Computing Environment
and Evaluation of Resource Provisioning
Algorithm using Improved Max-Min
Monika Mishra
Research Scholar, Dept. of Computer Science & Engineering, Gyan Ganga College of Technology, India
ABSTRACT: A major performance issue in large-scale decentralized distributed systems, such as grids, is how to ensure that jobs finish their execution within the estimated completion times in the presence of resource performance fluctuations. Previously, several techniques including advance reservation, rescheduling and migration have been adopted to resolve/relieve this issue; however, they have some non-negligent practicality hurdles. The use of clouds may be an attractive alternative, since resources in clouds are much more reliable than those in grids. This paper investigates the effectiveness of rescheduling using cloud resources to increase the reliability of job completion. Specifically, schedules are initially generated using grid resources, and cloud resources (relatively costlier) are used only for rescheduling to cope with a delay in job completion. A job in our study refers to a bag-of-tasks (BoT) application that consists of a large number of independent tasks; this job model is common in many science and engineering applications. We have devised a novel rescheduling technique, called rescheduling using clouds for reliable completion (RC 2 ) and applied it to three well-known existing heuristics. Our experimental results reveal that RC 2 significantly reduces delay in job completion. A unique modification of Improved Max-min task scheduling algorithm is proposed. The algorithm is built based on comprehensive study of the impact of Improved Max-min task scheduling algorithm in cloud computing. Improved Max-Max-min is based on the expected execution time instead of completion time as a selection basis. Enhanced (Proposed) Max-min is also based on the expected execution time instead of completion time as a selection basis but the only difference is that Improved Max-min algorithm assign task with Maximum execution time (Largest Task) to resource produces Minimum completion time (Slowest Resource) while Enhanced Max-min assign task with average execution time (average or Nearest greater than average Task) to resource produces Minimum completion time (Slowest Resource).
KEYWORDS: Cloud Computing, Job Scheduling, Makespan, Load balancing, Minimum completion time, Minimum execution time, Service response time.
I. INTRODUCTION
Cloud Computing is getting advanced day by day. Cloud service providers are willing to provide services using large scale cloud environment with cost effectiveness. Also, there are some popular large scaled applications like social- networking and e-commerce. These applications can benefit to minimize the costs using cloud computing. Cloud computing is considered as internet based computing service provided by various infrastructure providers on an on- demand basis, so that cloud is subject to Quality of Service(QoS), Load Balance(LB) and other constraints which have direct effect on user consumption of resources controlled by cloud infrastructure [1] [2].
Copyright to IJIRCCE DOI: 10.15680/IJIRCCE.2017. 0508021 13984
II. RESEARCH METHOD
This review aims at summarizing the current state of the art of various job scheduling techniques in cloud computing.
III. SOURCE OF INFORMATION
The Search was widely conducted in the following electronic sources to gain a broad perspective
ScienceDirect (www.sciencedirect.com) ACM Digital Library (portal.acm.org) IEEE eXplore (ieeexplore.ieee.org) Springer LNCS (www.springer.com/lncs)
These sources cover the most relevant journals, conferences and workshop proceedings. The searches in the selected
sources resulted in overlap among the papers, where the duplicates were excluded by manual filtering.
IV. SEARCH CRITERIA
The initial search criteria included the titles (Job scheduling in cloud computing), (job scheduling techniques in cloud computing), (job scheduling in clouds) and (job scheduling in datacentres). The start year set to 2001, and the end year was 2012. Only papers written in English were included.
V. IMPROVED MAX-MIN TASK SCHEDULING ALGORITHM [3]
Copyright to IJIRCCE DOI: 10.15680/IJIRCCE.2017. 0508021 13985
Flowchart:
Algorithm:
1. For all submitted tasks in Meta-task; Ti 1.1. For all resources; Rj
1.1.1. Cij = Eij + rj
2. Find task Tk costs maximum execution time (Largest Task).
3. Assign task Tk to resource Rj which gives minimum completion time (Slowest resource). 4. Remove task Tk from Meta-tasks set.
5. Update rj for selected Rj. 6. Update Cij for all j. 7. While Meta-task not Empty
7.1. Find task Tk costs maximum completion time.
7.2. Assign task Tk to resource Rj which gives minimum execution time (Faster Resource).
7.3. Remove Task Tk form Meta-tasks set. 7.4. Update rj for Selected Rj.
Copyright to IJIRCCE DOI: 10.15680/IJIRCCE.2017. 0508021 13986
The algorithm calculates the expected completion time of the submitted tasks on each resource. Then the task with the overall maximum expected execution time (Largest Task) is assigned to a resource that has the minimum overall completion time (Slowest Resource). Finally, this scheduled task is removed from meta-tasks and all calculated times are updated and then applying max-min algorithm on remaining tasks. Selecting task with maximum execution time leads to choose largest task should be executed. While selecting resource consuming minimum completion time means choosing slowest resource in the available resources. So allocation of the slowest resource to longest task allows availability of high speed resources for finishing other small tasks concurrently. Also, we achieve shortest makespan of submitted tasks on available resources beside concurrency.
"Select task with the overall maximum expected execution time (Largest Task) then assign to be executed by resource with minimum expected completion time (Slowest Resource)".
VI. ENHANCED MAX-MIN TASK SCHEDULING ALGORITHM (PROPOSED)
Sometimes largest task is too large compared to other tasks in Mata-task, in that kind of case overall makespan is increased because too large task is executed by slowest resource first while other tasks are executed by faster resource OR when there is major difference among slowest and fastest resource in context of processing speed or bandwidth in that case largest task is executed by slowest resource cause increasing in Makespan and load imbalance across resources.
Therefore, instead of selecting largest task if we select Average or Nearest greater than average task then overall makespan is reduced and also balance load across resources.
Algorithm:
1. For all submitted tasks in Meta-task; Ti 1.1. For all resources; Rj
1.1.1. Cij = Eij + rj
2. Find task Tk costs Average or nearest Greater than Average execution time.
3. Assign task Tk to resource Rj which gives minimum completion time (Slowest resource). 4. Remove task Tk from Meta-tasks set.
5. Update rj for selected Rj. 6. Update Cij for all j.
7. While Meta-task not Empty
7.1. Find task Tk costs maximum completion time.
7.2. Assign task Tk to resource Rj which gives minimum execution time (Faster Resource). 7.3. Remove Task Tk form Meta-tasks set.
7.4. Update rj for Selected Rj. 7.5. Update Cij for all j.
So in Enhanced Max-min, task selection scenario is changed, it is stated as "Select task with Average or Nearest
greater than average execution time (Average or Nearest greater than average task) then assign to be executed by resource with minimum completion time (Slowest resource)".
VII. THEORETICAL ANALYSIS
Copyright to IJIRCCE DOI: 10.15680/IJIRCCE.2017. 0508021 13987
Cloudlet
ID STATUS
Data
Centre ID VM ID Time
Start
Time Finish Time
0 SUCCESS 3 0 320 0 320
5 SUCCESS 3 0 320 0 320
1 SUCCESS 3 1 320 0 320
6 SUCCESS 3 1 320 0 320
2 SUCCESS 3 2 320 0 320
7 SUCCESS 3 2 320 0 320
4 SUCCESS 3 4 320 0 320
9 SUCCESS 3 4 320 0 320
3 SUCCESS 3 3 320 0 320
8 SUCCESS 3 3 320 0 320
101 SUCCESS 3 101 320 200 520
106 SUCCESS 3 101 320 200 520
103 SUCCESS 3 103 320 200 520
108 SUCCESS 3 103 320 200 520
100 SUCCESS 3 100 320 200 520
105 SUCCESS 3 100 320 200 520
102 SUCCESS 3 102 320 200 520
107 SUCCESS 3 102 320 200 520
104 SUCCESS 3 104 320 200 520
109 SUCCESS 3 104 320 200 520
Copyright to IJIRCCE DOI: 10.15680/IJIRCCE.2017. 0508021 13988
Fig. 1.0 Existing System Simulation Result Graph
0 100 200 300 400 500 600 SUC C ES S SUC C ES S SUC C ES S SUC C ES S SUC C ES S SUC C ES S SUC C ES S SUC C ES S SUC C ES S SUC C ES S SUC C ES S SUC C ES S SUC C ES S SUC C ES S SUC C ES S SUC C ES S SUC C ES S SUC C ES S SUC C ES S SUC C ES S
0 5 1 6 2 7 4 9 3 8 101106103108100105102107104109
Data Centre ID
VM ID
Time
Start Time
Copyright to IJIRCCE DOI: 10.15680/IJIRCCE.2017. 0508021 13989
Data canter
ID STATUS
Data Centre
ID VM ID Time Start Time Finish Time
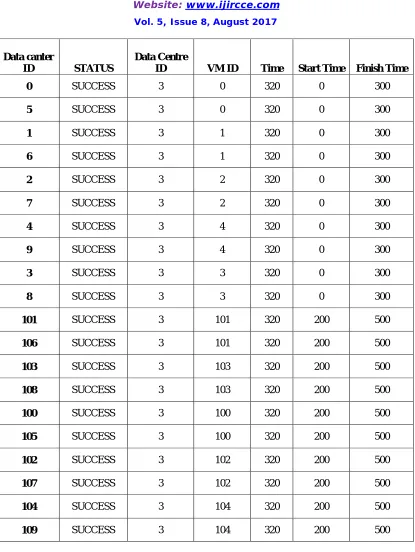
0 SUCCESS 3 0 320 0 300
5 SUCCESS 3 0 320 0 300
1 SUCCESS 3 1 320 0 300
6 SUCCESS 3 1 320 0 300
2 SUCCESS 3 2 320 0 300
7 SUCCESS 3 2 320 0 300
4 SUCCESS 3 4 320 0 300
9 SUCCESS 3 4 320 0 300
3 SUCCESS 3 3 320 0 300
8 SUCCESS 3 3 320 0 300
101 SUCCESS 3 101 320 200 500
106 SUCCESS 3 101 320 200 500
103 SUCCESS 3 103 320 200 500
108 SUCCESS 3 103 320 200 500
100 SUCCESS 3 100 320 200 500
105 SUCCESS 3 100 320 200 500
102 SUCCESS 3 102 320 200 500
107 SUCCESS 3 102 320 200 500
104 SUCCESS 3 104 320 200 500
109 SUCCESS 3 104 320 200 500
Copyright to IJIRCCE DOI: 10.15680/IJIRCCE.2017. 0508021 13990
Fig 1.2 Proposed System Simulation Result Graph
0 50 100 150 200 250 300 350 400 SUC C ES S SUC C ES S SUC C ES S SUC C ES S SUC C ES S SUC C ES S SUC C ES S SUC C ES S SUC C ES S SUC C ES S SUC C ES S SUC C ES S SUC C ES S SUC C ES S SUC C ES S SUC C ES S SUC C ES S SUC C ES S SUC C ES S SUC C ES S
0 5 1 6 2 7 4 9 3 8 101106103108100105102107104109
Data center ID VM ID
Time
Copyright to IJIRCCE DOI: 10.15680/IJIRCCE.2017. 0508021 13991
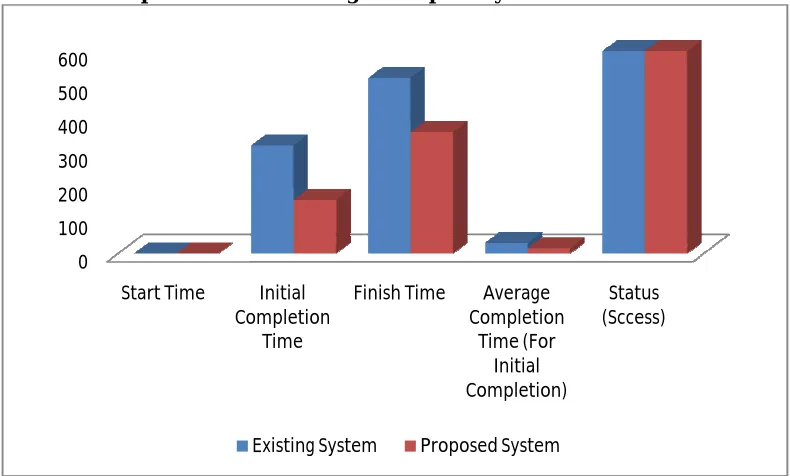
7.2 COMPARISONS
Parameters used in the simulation include the following based on which performance of algorithm is being measured. Table shows parameter on the basis of which comparison is done.
7.2.1 Comparison Table of Energy Efficient Cloud with Existing System
Parameters Existing System Proposed System
Start Time 0 0
Initial Completion Time 320 300
Finish Time 520 500
Average Completion Time (For Initial Completion)
32.00 30
Status Success Success
Table 1.3 Comparison Table of Energy Efficient Cloud with Existing System
7.2.2 Execution Time Comparison between Existing and Proposed System
Fig 1.3 Execution Time Comparison between Existing and Proposed System
0 100 200 300 400 500 600
Start Time Initial
Completion Time
Finish Time Average
Completion Time (For
Initial Completion)
Status (Sccess)
Copyright to IJIRCCE DOI: 10.15680/IJIRCCE.2017. 0508021 13992
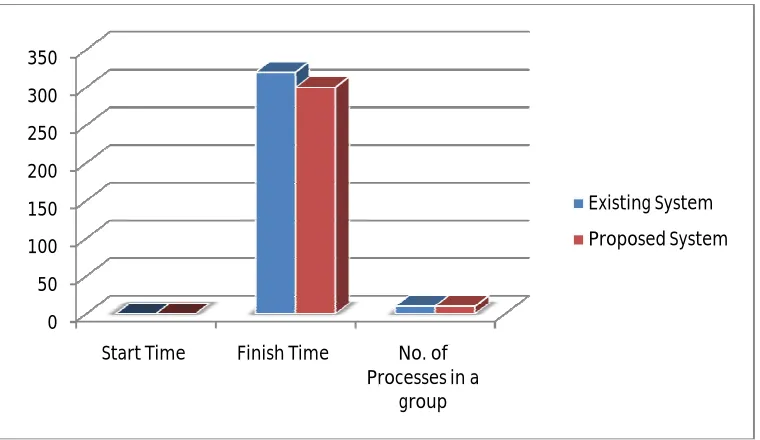
4.2.3 The Comparison of process finished time of the batch of 10 number of processes
Parameters Existing System Proposed System
Start Time 0 0
Finish Time 320 300
No. of Processes in a group 10 10
Table 1.4 Comparison of process finished time of the batch of 10 numbers of processes
Fig 1.4 Graph of Comparison of process finished time based on ten processes
VIII. CONCLUSIONS AND FUTURE WORKS
When we schedule tasks using improved max-min task scheduling technique then in case, largest task is too large compared to other tasks in Mata-task, in that kind of case overall makespan is increased because too large task is executed by slowest resource first while other tasks are executed by faster resource OR when there is major difference
0 50 100 150 200 250 300 350
Start Time Finish Time No. of
Processes in a group
Existing System
Copyright to IJIRCCE DOI: 10.15680/IJIRCCE.2017. 0508021 13993
among slowest and Fastest resource in context of Processing speed or Bandwidth in that case largest task is executed by too slow resource cause increasing in Makespan and load imbalance across resources.
Therefore, a unique modification of Improved Max-min task scheduling algorithm is proposed. The algorithm is built based on comprehensive study of the impact of Improved Max-min task scheduling algorithm in cloud computing. Improved Max-min algorithm assign task with Maximum execution time (Largest Task) to resource produces Minimum completion time (Slowest Resource) while Enhanced Max-min assign task with average execution time (average or Nearest greater than average Task) to resource produces Minimum completion time (Slowest Resource). This reduces overall makespan and balance load across resources.
For simulation, we will use CloudSim which is java based simulation toolkit that enables modeling, simulation and experimenting on designing cloud computing infrastructures.
REFERENCES
[1.] Salim Bitam, “Bees Life algorithms for job scheduling in cloud computing”, International Conference on computing and Information Technology, 2012.
[2.] Saeed Parsa and Reza Entezari-Maleki, “RASA: A New Grid Task Scheduling Algorithm”, International Jour nal of Digital Content Technology and its Applications, Vol.3, pp. 91-99, 2009.
[3.] O. M. Elzeki, M. Z. Reshad and M. A. Elsoud, "Improved Max-Min Algorithm in Cloud Computing", International Journal of Computer Applications (0975 – 8887).
[4.] Braun, T.D., Siegel, H.J., Beck, N., Boloni, L.L.,Maheswaran, M., Reuther, A.I., Robertson, J.P., et al. “A comparison of eleven static heuristics for mapping a class of independent tasks onto heter ogeneous distributed computing systems”, Journal of Parallel and Distributed Computing, Vol. 61, No. 6, pp.810–837, 2001.
[5.] He. X, X-He Sun, and Laszewski. G.V, "QoS Guided Minmin Heuristic for Grid Task Scheduling," Journal of Computer Science and Technology, Vol. 18, pp. 442-451, 2003.