Transactions,SMiRT-23
Manchester, United Kingdom - August 10-14, 2015
Division V, Paper ID 467
HYDRODYNAMIC LOAD EFFECTS ON FUNCTIONALITY OF VALVE
ACTUATORS
Yigit Isbiliroglu1, Cagri Ozgur2, Evren Ulku3, Nish Vaidya4and Kristofor Paserba5
1
Engineering Associate, Rizzo Associates, USA
2
Project Engineer, Rizzo Associates, USA
3Technical Director, Rizzo Associates, USA 3
Vice President, Rizzo Associates, USA
5Principal Engineer, Westinghouse Electric Company, USA
ABSTRACT
In-line valves are qualified for static as well as dynamic loads from seismic and hydrodynamic (HD) events. HD loads generally result in spectral accelerations significantly in excess of those due to the design basis seismic events above 33 Hz. Current regulatory guidelines do not specifically address the evaluation of equipment response to high frequency loading. In order to compare with the qualification test requirements, this paper investigates the response of skid and line mounted valve actuators of piping systems resulting from HD loads by using several independent rigorous finite element analysis solutions for various piping system segments. First, valve responses are examined on the basis of displacements since HD loads are generally characterized by high frequencies and small durations. Second, the damage potential of the loads on the valve actuators are evaluated by means of the energy imparted to the actuator quantified in terms of Arias intensity. The rationale for using the energy content for qualifying the valve actuators is based on the fact that damage due to dynamic loading is related not only to the amplitude of the acceleration response but also to the duration and the number of cycles over which this acceleration is imposed. This proposed hybrid approach significantly reduces the amount of individual analysis and testing needed to qualify the valve actuators.
INTRODUCTION
HD loads are generally characterized by high frequency content and relatively short durations and are resulted from valve closure, jet impingement, depressurization, thrust and pipe whip. In this study, response of in-line valves of the AP1000® Standard Plant to HD loads are presented in order to contrast the HD loading response with the dynamic testing requirements on valve actuators. For this purpose, the dynamic response of valve actuators located on selected segments of the Chemical and Volume Control System (CVS), Steam Generator System (SGS), and Reactor Coolant System (RCS) to HD loads are developed. In addition to above piping segments, generic parametric systems are also considered so that the results and conclusions can be extended to the entire population of AP1000®piping systems, valves, and HD loading conditions.
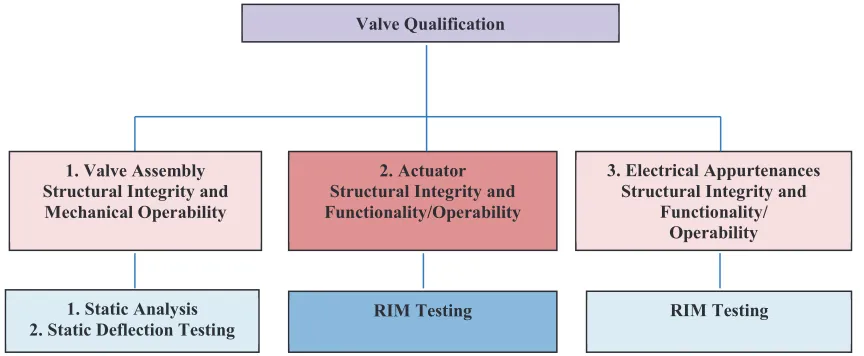
Qualification methods for three key characteristics of valve performance are illustrated in Figure 1. This paper only discusses the assessment of dynamic tests of valve actuators. As seen in Figure 1, the functionality and operability of valve actuators are demonstrated by shake table testing (required input motion (RIM) testing) in accordance with in IEEE 344 (1987).
tests is defined by Service Level D seismic acceleration limits of at least 6.0g in each direction over the frequency range of 10 Hz to 64 Hz.
Figure 1. Valve qualification methods. Qualification by RIM test is analysed here for valve actuator structural integrity and functionality/operability.
REGULATORY AND INDUSTRY POSITION
The HD loads are similar in frequency content and displacements to the shock loads used in the SAFEGUARD program Cover et al. (1985) for performing the fragility tests. However, because of differences in the type of equipment tested, the fragility information in SAFEGUARD program is useful only in a qualitative sense. Earthquake Experience Based Qualification discussed in ASME QME-1 (2007) Article QR-A7400 and the Experience methods of IEEE 344 (1987) are not deemed to be acceptable methods for seismic qualification of AP1000® safety-related equipment.
In more recent studies, EPRI (2007a) and EPRI (2007b) show that additional response stress in typical nuclear plant Structures, Systems, and Components (SSCs) due to high frequency (>10 Hz) spectral accelerations can be considered as negligible. However, components, such as relays, switches, contactors, and other Electrical and Instrumentation and Control (I&C) devices are considered as vibration sensitive and their functional performance may be affected by high frequency excitation.
In another recent study, EPRI (2014) examined the high frequency capacity of a diverse sample of 153 vibration sensitive power plant components via random multi-frequency input motions with an amplified region between 20 Hz to 40 Hz range. Most of the components were tested to the shake table limits (15g to 20g spectral acceleration) without chatter or malfunction. EPRI (2014) found that some components are sensitive to vibration regardless of the frequency of motion; however, no unique high frequency sensitivity was identified in the tests performed.
These previous studies mainly focus on the seismic response of the nuclear plant SSCs. This study, on the other hand, considers HD loading in addition to seismic loading to address the structural integrity and mechanical operability of valve actuators.
2. Actuator Structural Integrity and Functionality/Operability
3. Electrical Appurtenances Structural Integrity and
Functionality/ Operability Valve Qualification
1. Valve Assembly Structural Integrity and Mechanical Operability
1. Static Analysis 2. Static Deflection Testing
23rd Conference on Structural Mechanics in Reactor Technology Manchester, United Kingdom - August 10-14, 2015 Division V
DESCRIPTION OF PILOT PIPING MODEL AND LOAD CHARACTERISTICS
In order to verify the mechanical operability of the valve actuators of AP1000®, CVS piping system is investigated in detail first. For this purpose, the response of valve actuators due to seismic and HD loads are examined relative to actuator shake table test requirements. Afterwards, the remaining piping segments (original and generic SGS and RCS models) are evaluated utilizing the same frequency-based procedures developed for the CVS system.
Details and analysis results of the CVS piping are provided in the subsequent sections along with the discussion of the frequency-based approach for qualifying the functionality of valve actuators. This is followed by the results from the parametric study.
CVS Piping Model
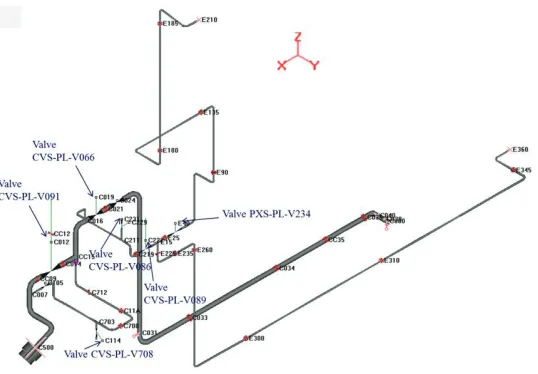
The selected segment of the CVS is the 3 inch makeup line extending from the containment penetration to the regenerative heat exchanger. This line has two in-line active valves. Valve 091 is an AP1000® Class B, seismic category I motor operated isolation valve, and Valve 066 is an air operated stop check valve, classified as Class D. Several 1 inch diameter sampling and monitoring lines terminate on the 3 inch main piping. The flow in these lines is controlled by the remaining 4 valves, which are either Class D or Class E. Figure 2 shows the finite element model of the selected segment of the CVS, including the location of the in-line valves.
Figure 2. Finite element model of the CVS piping segment and specified valve locations.
Seismic and HD Load Characteristics
CVS piping segment is subjected to 23 separate HD load time histories applied simultaneously. These HD loads are due to a single design basis pipe break event and are generally located close to elbows or intersection points with sub-segments.
Most HD load time histories exhibit multiple isolated peaks, and each peak damps out in milliseconds. On the other hand, one load time history is defined with a step function, which lasts 1s.
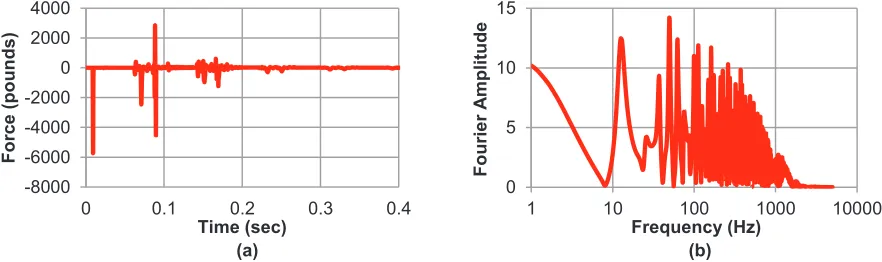
As an example, Figures 3a and 3b show a representative HD load time history—designated as THL004—
in the time and the frequency domains, respectively. The isolated spikes seen in Figure 3a lead to the high frequency content (> 100 Hz) observed in Figure 3b. This high frequency content associated with HD loads is well in excess of that of the seismic motions.
Seismic demand, on the other hand, is represented by a total of 18 time histories (3 vicinity nodes near the highest support elevation x 3 orthogonal directions x 2 soil conditions = 18 time histories). Most of the energy of these time histories is concentrated in the frequency range of 15 Hz to 25 Hz. Separate dynamic analysis is performed for each time history by assuming that all of the piping supports undergo the same excitation simultaneously, and then the results are enveloped.
(a) (b)
Figure 3. Representation of an example HD load (THL004) in the time (a) and the frequency (b) domains.
QUALIFICATON OF VALVE ACTUATORS ON CVS PIPING
Dynamic shake table tests (RIM tests) are utilized to demonstrate the mechanical function (structural integrity, mechanical connections, and misalignment/binding) of all actuators. This approach is based on the requirement that RIM envelops the seismic demand on all actuators for the AP1000® Standard Plant. This study verifies that the combined seismic and HD response is also enveloped by the specified RIM.
The description of the input motion for the shake table testing is presented in the subsequent subsections along with the discussion of different methods used for qualifying the actuators. Results, supplemented with figures, are presented for the actuator response due to both seismic and HD loads.
Required Input Motion (RIM) Testing of Actuators
The AP1000® valve actuators are shake table tested by the single frequency, single-axis sine-beat RIM dwell accelerations in compliance with the requirements IEEE 344 (1987). Dynamic characteristics of the actuator, such as frequency and mode shapes, come into play during the shake table testing. This testing, therefore, addresses the seismic and other vibratory loads to which the valves may be subjected.
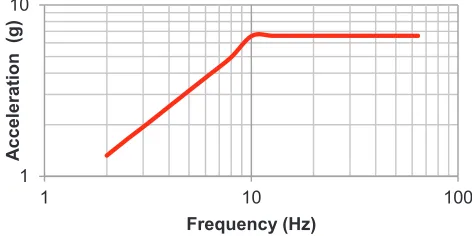
The single-frequency sine-beat (12 cycles per beat) tests are performed at frequencies at one-third octave interval over the frequency range of 2 Hz and 32 Hz, and at one-sixth octave interval over the frequency range of 32 Hz and 64 Hz. Figure 4 illustrates the plot of required maximum input accelerations at the test frequencies, which is also referred to as the RIM curve. As seen in Figure 4, input accelerations are ramped up from 1.32g to 6.6g between 2 Hz and 10 Hz, and 6.6g acceleration limit is employed at frequencies beyond 10 Hz during the testing.
-8000 -6000 -4000 -2000 0 2000 4000
0 0.1 0.2 0.3 0.4
Fo
rce
(po
un
ds
)
Time (sec)
0 5 10 15
1 10 100 1000 10000
Fo
urie
r
A
m
pl
itu
de
23rd Conference on Structural Mechanics in Reactor Technology Manchester, United Kingdom - August 10-14, 2015 Division V
Although the total valve response is the superposition of responses at different modal frequencies, the single frequency RIM testing is commonly utilized in the qualification of line-mounted valves and actuators. This approach is reasonable because the piping usually has sharp resonance in the significant frequency range of the seismic ground motions.
The table motion also represents the input to the actuator without any amplification. Thus RIM amplitudes are compared with the response due to the HD and seismic loading obtained at the mass point (actuator) of the valves in the global piping model on a mode by mode basis at the respective modal frequencies.
Maximum Displacements vs Maximum Accelerations in Actuator Motion
The seismic qualification is usually confirmed if the respective response accelerations due to seismic input are enveloped by the RIM acceleration magnitudes. This approach is more convenient for seismic loads which cause dominant response in the frequency range of about 8 Hz to 20 Hz and are sustained over several cycles of motion. However, the response due to the HD loads is generally associated with high frequencies and small durations as illustrated in Figure 3. Also, as noted in ASME (2007), damage due to dynamic excitations above about 15 Hz is usually controlled by velocity or displacement, not acceleration. Thus, the methodology utilized here examines the response modal displacements relative to the RIM displacements. RIM curve displacements are obtained by dividing the acceleration values by
(2πf)2 for each frequency. The modal response displacements due to seismic and HD loads, on the other hand, are obtained as a function of time at valve mass points utilizing the modal superposition technique.
Seismic displacements in the modal response time histories typically exhibit several cycles of vibration, whereas the HD load displacements occur over very short duration. Therefore, instead of combining the maximum seismic and HD load displacements (using SRSS) when comparing with RIM displacements, they are examined individually in Figure 5 to Figure 8.
Figure 4. RIM acceleration curve from sine-beat input motion.
Evaluation of Energy Content in Actuator Motion with Arias Intensity
In this study, energy content of the actuator motion is evaluated to assess damage (against structural integrity and operability) due to dynamic loading considering that the damage can be both related to the amplitude of the acceleration response and the number of cycles over which this acceleration is imposed.
The energy imparted to a single degree freedom (SDOF) system is calculated as the product of the input motion and the response of the SDOF (Equations 9 and 13 in Uang and Bertero (1990)). The imparted energy, thus, is a function of the dynamic characteristics of the system, and also the duration and
1 10
1 10 100
A
c
c
e
le
rati
on
(g
)
frequency content of the input motion. Manfredi (2001), also, shows that the imparted energy is proportional to the effective duration and the product between the dimensionless Arias intensity (Arias, 1970), peak ground acceleration (PGA) and peak ground velocity (PGV) ratio.
It was shown in a companion study Ozgur et al. (2013) that the energy content of the seismic and HD load response above 64 Hz is relatively small. Based on this principle, the energy content of the actuator motion in each mode is adopted as the measure of the intensity of shaking. If the energy content of the actuator motion due to the HD and seismic loads is less than the RIM energy, then, in a sense, this suggests that RIM envelops the seismic and HD load response. Provided this condition is satisfied, the actuator is qualified for the combination of expected seismic and HD response.
Arias intensity is regarded here as the quantifying parameter for examining the energy content of the actuator motion. It generally correlates well with liquefaction and seismic slope stability (e.g., Travasarou et al. (2003)). In addition, Cabanas et al. (1997) presents that Arias intensity of the seismic inputs show a relationship with the observed damage in structures. To the authors’ knowledge, there is not any study that specifically investigates correlation between Arias intensity and destructiveness of high frequency signals. However, since Arias intensity is related to total energy of signals, it is regarded as an efficient parameter to predict damage potential of signals at valve actuators due to HD loads.
Arias intensity of input motion is defined in Arias (1970) as the cumulative energy per unit weight absorbed by an infinite set of SDOF oscillators with frequencies uniformly distributed in the range (0,λ). For the case of zero damped oscillators, this reduces to the form shown in Equation 1:
ൌଶ ሺሻୢ ଶ (1)
where a(t) is the acceleration time history, g is the acceleration due to gravity, and Td is the duration of signal.
The RIM test is performed as 12 cycles per beat and is sustained for about 30 seconds at each frequency of testing. Thus, the Arias intensity of the RIM at each frequency of testing is derived from the test acceleration history of each sine-beat motion. The Arias intensity of the seismic and HD load response, on the other hand, is obtained from the separate modal acceleration time history contributions in each mode. In the case of seismic input, the absolute accelerations, which are used in the calculation of Arias intensity, are obtained by adding the support acceleration to the relative acceleration response. It turns out that, for most frequencies, the total seismic acceleration response is mostly due to the contribution from support acceleration. Therefore Arias intensity of the seismic response is constant as seen in Figure 6 and Figure 8.
Calculation Tool for Developing the Seismic and HD Load Response
The dynamic response is obtained here utilizing the modal superposition method of linear elastic dynamic analysis in the frequency domain. This method obtains the modal response by expressing the input time history by its Fourier transformation. The resulting Fourier transformation of the response is converted back into the time domain for further processing such as developing the respective Arias intensities.
23rd Conference on Structural Mechanics in Reactor Technology Manchester, United Kingdom - August 10-14, 2015 Division V
RIM vs Seismic and HD Load Response of CVS Piping
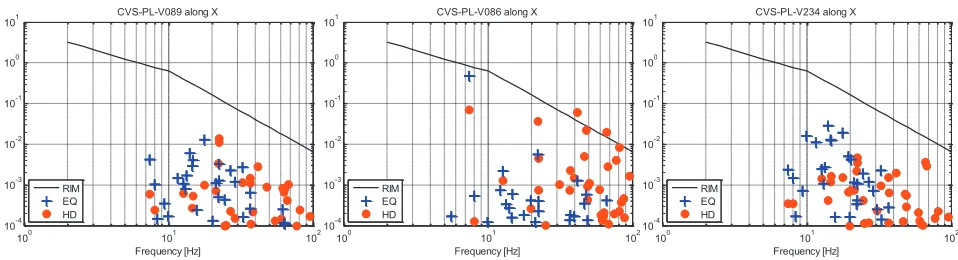
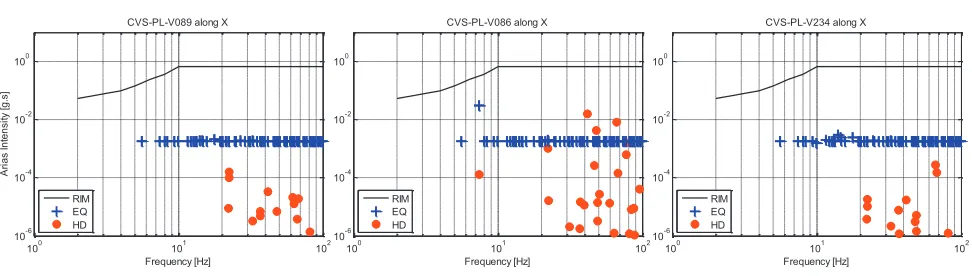
This subsection presents the seismic and HD load response of the actuators on the CVS piping in comparison with the response to the RIM. Figure 5 illustrates the maximum modal displacements in the X direction at the selected mass points of valves on CVS piping due to seismic and HD loads, and compares them with the respective RIM displacements. In Figure 6, on the other hand, the Arias intensities of the actuator response to seismic and HD loads are compared to that of the RIM motion in the X direction. For both the displacement and Arias intensity response, the corresponding results in the other directions (Y and Z) and at other three actuator points show similar characteristics with the ones presented in Figure 6 and Figure 7, respectively.
Figure 6 shows that the Arias intensity derived from the seismic and HD loading is at least 10 times less than the RIM Arias intensity for the actuators in CVS piping. Similarly, the modal displacements are generally below the RIM displacement curve for all of the valves, all of the loading conditions and in all directions for CVS piping. There are, however, exceptions where the RIM displacement curve is slightly exceeded by the HD load response displacements (6 cases out of 1386 data points). These exceedances primarily appear as spikes in high frequency modes, and typically occur in excess of 40 Hz. For example, in Figure 5, maximum HD over RIM displacement ratio is 1.6 and occurs around 40 Hz for valve CVS-PL-V086. However, these isolated spikes are associated with a low energy content of the motion. This can be seen in Figure 6, which shows that the energy content of the seismic and HD load responses is at least an order of magnitude less than the energy imparted during actuator testing.
In view of the results above, it can be concluded that the relatively high accelerations due to the HD loads are non-damaging and the combined seismic and HD response of all actuators on CVS piping is enveloped by the RIM test.
Figure 5. Comparison of displacement RIM curve with HD and envelope seismic (EQ) response at 3 valve mass points (actuators) for CVS along X direction.
10 10 10 10 10 10 10 10 10
100 101 102
10-4 10-3 10-2 10-1 100 101
Frequency [Hz]
D
isp
la
ce
m
e
n
t
[i
n
]
CVS-PL-V089 along X
RIM EQ HD
100 101 102
10-4 10-3 10-2 10-1 100 101
Frequency [Hz] CVS-PL-V086 along X
RIM EQ HD
100 101 102
10-4 10-3 10-2 10-1 100 101
Frequency [Hz] CVS-PL-V234 along X
Figure 6. Comparison of Arias intensities derived from RIM curve, from HD and envelope seismic (EQ) response at 3 valve mass points (actuators) for CVS along X direction.
PARAMETRIC STUDIES
Parametric studies have been performed on several additional piping systems other than the CVS model previously described with the purpose of extending the conclusions developed above to the broad array of AP1000® piping and valve systems. These piping systems consist of segments of SGS-10, RCS-10, and RCS-20, and other additional models developed by adding and/or removing pipe supports on the SGS-10 and RCS-10 segments for obtaining a more flexible and a more rigid system segment for each case. These additional systems with different dynamic characteristics are assumed to represent the entire population of AP1000® piping systems. The SGS-10 segment of the SGS is a 20-in.-diameter feedwater line running from the discharge side of the feedwater pump to the steam generator in the reactor building, and is anchored at the auxiliary building/turbine building interface. RCS-10 is part of the pressurizer safety and relief valve module. It includes two 14 in. lines from the pressurizer head to safety valves, and two Automatic Depressurization System (ADS) modules. Each ADS module includes one 4 in. line and two 8 in. lines. RCS-20, on the other hand, consists of the 4 in. diameter pressurizer spray lines from the reactor coolant cold legs up to the spray nozzle on the pressurizer. Unlike the CVS piping system in which only one HD loading event is considered, there are multiple HD loading events associated with the other piping systems described above.
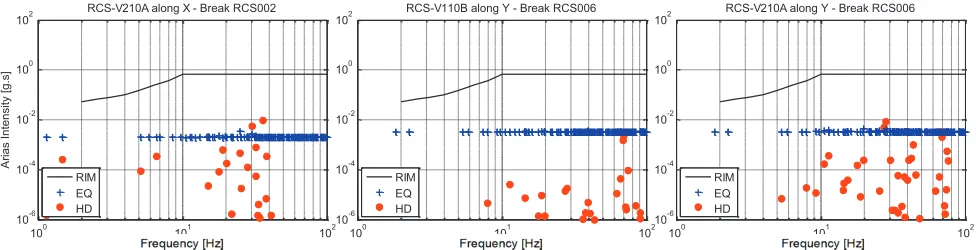
The results of the parametric studies show that the modal displacements due to seismic and HD loads are generally below the RIM displacement curve for all of the valves and all of the loading conditions and all of the systems. For instance, Figure 7 presents the maximum modal displacements at the mass points of selected critical valves (where HD response displacements exceed RIM curve), due to seismic and HD loads in comparison with the corresponding RIM displacements for the RCS-20 piping system. Figure 8, alternatively, compares the Arias intensities of the actuator motion derived from the seismic and HD loads to that of the corresponding RIM motion at the same critical valve locations presented in Figure 7.
There are, however, 11 instances out of 3,105 cases (total number of cases is the sum of 3 (direction) ൈ
total events ൈ total valves for each system) in which the modal displacements due to HD load exceed the RIM displacements (11 exceedances out of 817,236 data points). For instance, in Figure 7, maximum HD over RIM displacement ratio is 1.41 and occurs around 36 Hz for valve RCS-V210A in the X direction for break RCS-002. Conversely, Figure 8 suggests that the energy imparted to the critical actuators, estimated in terms of the Arias intensity of the response, due to seismic and HD loads is at least 65 times less than that of the RIM. Thus, it can be concluded that these exceedances do not affect the operability of the actuators owing to the small durations over which the exceedances in Figure 7 occur relative to the RIM.
10 10 10 10 10 10 10 10 10
100 101 102
10-6 10-4 10-2 100
Frequency [Hz]
A
ri
a
s
In
te
n
si
ty
[g
.s]
CVS-PL-V089 along X
RIM EQ HD
100 101 102
10-6 10-4 10-2 100
Frequency [Hz] CVS-PL-V086 along X
RIM EQ HD
100 101 102
10-6 10-4 10-2 100
Frequency [Hz] CVS-PL-V234 along X
23rd Conference on Structural Mechanics in Reactor Technology Manchester, United Kingdom - August 10-14, 2015 Division V
Figure 7. Comparison of displacement RIM curve with HD and envelope seismic (EQ) response at selected critical valve mass points (actuators).
Figure 8. Comparison of Arias intensities derived from RIM curve, from HD and envelope seismic (EQ) response at selected critical valve mass points (actuators).
CONCLUSIONS
Piping system response resulting from HD loads is generally associated with high frequency content and corresponding response accelerations may be relatively high with respect to qualification testing limits. However, these high frequency accelerations are typically characterized by very small durations. Therefore, in this study, instead of focusing on non-damaging accelerations, maximum modal displacements due to HD and seismic loads for various piping systems are calculated which are shown to be less than the respective single frequency amplitudes of the RIM tests IEEE (1987) except for 11 out of 3,105 cases (11 exceedances out of 817,236 data points). These exceedances are associated with small test displacements in the range of frequencies in excess of 20 Hz, and occur over a very short duration relative to the test input motion. Based on this principle, the corresponding energy, in terms of the Arias intensity of the modal time histories of actuator motion due to the HD and seismic loading, is calculated and found to be significantly less than the Arias intensity of the test RIM (20 times less for HD). This demonstrates the functionality and operability of the valve actuators against the HD loads.
In summary, it can be concluded that, based on the analysis of eight piping models of representative dynamic characteristics, various seismic and HD load conditions, and assessment of actuator response of numerous AP1000® valves, the current dynamic qualification tests of valve actuators provide sufficient
margins relative to the expected seismic and HD load response.
100 101 102
10-4 10-3 10-2 10-1 100 101 Displa ceme nt [ in]
RCS-V210A along X - Break RCS002
RIM EQ HD
100 101 102
10-4 10-3 10-2 10-1 100 101
RCS-V110B along Y - Break RCS006
RIM EQ HD
100 101 102
10-4 10-3 10-2 10-1 100 101 Frequency [Hz] RCS-V210A along Y - Break RCS006
RIM EQ HD
1 RCS-V110A along Z - Break RCS006 1 RCS-V210A along Z - Break RCS006
100 101 102
10-6 10-4 10-2 100 102 Arias Int ens ity [g .s]
RCS-V210A along X - Break RCS002
RIM EQ HD
100 101 102
10-6 10-4 10-2 100 102
RCS-V110B along Y - Break RCS006
RIM EQ HD
100 101 102
10-6 10-4 10-2 100 102 Frequency [Hz] RCS-V210A along Y - Break RCS006
AP1000 is a trademark or registered trademark of Westinghouse Electric Company LLC, its affiliates and/or its subsidiaries in the United States of America and may be registered in other countries throughout the world. All rights reserved. Unauthorized use is strictly prohibited. Other names may be trademarks of their respective owners.
REFERENCES
Arias, A. (1970). “A Measure of Earthquake Intensity” R.J. Hansen, ed., Seismic Design for Nuclear Power Plants, MIT Press, Cambridge, USA.
Cabanas, L., Benito, B., Herraiz, M. (1997). “An Approach to the Measurement of the Potential Structural Damage of Earthquake Ground Motions”, Earthquake Engineering and Structural Dynamics, 26, 79-92, USA.
Cover, L. E., M. P.Bohn, R. D., Campbell, and D. A. Wesley. (1985). “Handbook of Nuclear Power Plant Seismic Fragilities,” Seismic Safety Margins Research Program, NUREG/CR-3558, University of California Radiation Laboratory (UCRL)-53455, Lawrence Livermore National Laboratory, Livermore, CA, USA.
Electric Power Research Institute (EPRI) 1015108. (2007a). “Program on Technology Innovation: The Effects of High Frequency Ground Motion on Structures, Components, and Equipment in Nuclear Power Plants”, USA.
Electric Power Research Institute (EPRI) 1015109. (2007b). “Program on Technology Innovation: Seismic Screening of Components Sensitive to High-Frequency Vibratory Motions”, USA.
Electric Power Research Institute (EPRI) 1015109. (2014). “High Frequency Testing Summary
(3002002997)”, Palo Alto, USA.
Institute of Electrical and Electronics Engineers (IEEE). (1987). “IEEE Recommended Practice for Seismic Qualification of Class 1E Equipment for Nuclear Power Generating Stations,” IEEE-344, IEEE Power Engineering Society, New York, NY, USA.
Manfredi, G. (2001). “Evaluation of Seismic Energy Demand”, Earthquake Engineering and Structural Dynamics, 30:4, 485-499, USA.
Ozgur, C., Ulku, E., Vaidya, N., Paserba, K., Bazan, E. (2013). “High Frequency Cutoff Analysis for Evaluating Valves Subjected to Hydrodynamic Loads”, 22nd Int. Conf. on Structural Mechanics in
Reactor Technology, SMiRT-22, San Francisco, USA.
The American Society of Mechanical Engineers (ASME) QME-1. (2007). “Qualification of Active Mechanical Equipment Used in Nuclear Power Plants”, USA.
Travasarou, T., Bray, J. D., Abrahamson, A. (2003). “Empirical Attenuation Relationship for Arias Intensity”, Earthquake Engineering and Structural Dynamics, 32, 1133-1155, USA.