Tweet Clustering Using Bisecting K-means
Shameena Banu P
1, Anju C.R
2M. Tech, Department of Computer Science, KMCT College of Engineering, Kozhikode, Kerala, India1
Assistant Professor, Department of Information Technology, KMCT College of Engineering, Kozhikode, Kerala, India2
ABSTRACT: Tweet covers wide variety of social information that changes frequently over time. How to efficiently cluster events from continuous tweet streams remains challenging. Commonly used tweet clustering approach is single-pass incremental clustering. This approach does not track the evolving tweets, nor does it address the issue of efficient monitoring of events in the presence of a large number of emerging tweets. Tweet has some unique characteristics like it comprises of real-life conversations, uniform length (140 characters), rich variety, and real time data streams. So it is difficult to cluster an event from these tweet streams. In this paper, wecluster the similar tweets by using bisecting K-means clustering algorithm, that can effectively monitor the evolving tweets, and also tweet relationship can be identified.A real-world tweet dataset is collected to evaluate the effectiveness of our method. The result shows the method performs favourably against state-of-the art methods.
KEYWORDS: Events, K-means clustering, Incremental clustering, Bisecting k-means.
I. INTRODUCTION
Twitter is one of the most popular social networking service,it is fast emerging in recent years, it has a large number of users and posts. Users are using twitter for real-life event reporting,those events can be detected by analyzing the text streams in twitter. Tweets cover wide variety of events happening around us and around the world. These events unfold important informations about breaking news, hot discussions, public opinions, etc,and also these events are typically evolving over time. Evolution of events means that, it changes dynamically over time. Event Evolution provides an opportunity to give the timely responses at different stages, for example the opinion for any popular public events(example: U.S presidential election) may changes over time. Thus, how to monitor effectively and efficiently the evolving tweets from tweet streams is a difficult task. Here an event means,
“Event:An event is defined as a cluster of tweets sharing similar textual information”
Tweet clustering is an unsupervised method of clustering the tweets based on the similarity of the tweets. In unsupervised technique there is no need of training dataset, and also the categories are not known in advance, that means the nature of the incoming tweet is not known priorly, they are unspecified. Unsupervised clustering is used to automatically discover group of similar documents within a collection of documents.
II. RELATED WORK
In most of the existing work, they made considerable effort for summarizing online textual streams such as tweets in the form of event [6], [7], [8], [9].Taxonomy for all these related work can be given by various ways. Retrospective event detection (RED)[11] and new event detection(NED)[12] are two techniques according to detection task as in [10]. According to the event type, they are categorized into specified [13] and unspecified [14] detection of events. The firstspeaks about the interest of event availability,while the later detects events from the trends or bursts in Twitter streams. Depending on the detection method, there are unsupervised[16] and supervised [15] algorithms. In this paper, we focus on NED, unspecified and unsupervised event detection. We refer a brief review of several representative studies in the similar category. The emerging events is captured by [17] identifying the locally dense sub-graphs from a streaming model’s graph. In[16], wavelet analysis is applied for the construction of daily signals. Graph partitioning algorithmis used for clustering words into events. The daily detected events of this kind lose track of their developments over multiple days. The single-pass incremental clustering algorithm in [19] is adopted for event detection and dynamically generated the threshold by the statistics of existing clusters. The cluster center shifting is missed in their work, they cannot capture the dynamics of events also.
Most of the existing event evolution work tracks the details of one specified event in real time. For example, in[1], the authors track mine geographical diffusion trajectory on the map and the representative tweets of an event. To our knowledge, [5] only effort to monitor event evolution. In their work, for event monitoring, subgraph-by-subgraph incremental tracking framework is proposed. The information within a fading time window in a dynamic network is summarized by designing a skeletal graph. By treating each event snapshot as a node and the trajectory between snapshots as paths they construct the evolution graph. So, when the time window moves, only at that time they capture the event. This is one of the main drawback of their method. Also highly dynamic events are losing in long-time window and short time window length will lead to storing redundant snapshots for steady events is the problem that is being faced.
III. PROPOSED SYSTEM
A tweet is a small piece of text, contains maximum of 140 characters.Tweet clustering means clustering oftweets in different clusters in which each cluster have similar tweets(in some way or other). First step in clustering process is cleaning the tweets that we wish to cluster. Then represent the tweets by vector space model. Thisvector space representation helps to find the importance of a word in a corpus,here a vector is a numerical representation of a word.Here we use tf-idf for this purpose, because it shows best performance in representing short, dynamic and noisy tweets. In this paper, a two-steps process is proposed, based on
Tweet information extraction.
Tweet data analysis via clustering.
A. Tweet clustering steps:
1. Stopword removal.
2. Tokenizing and stemming each tweet.
3. Transforming the corpus into vector space using tf-idf.
B. Description of the Proposed system: Step 1: Stopword removal:
It is used to eliminate irrelevant words from the tweet, like “the, is, was, then etc”, and symbols. These symbols and words will not convey any important information, and make the clustering difficult. Tweets consist of somany irrelevant words, so inorder to make proper clustering these datas need to be removed from tweets.
Step 2: Tokenizing and stemming:
The process of splitting the text into meaningful terms like symbols, words or phrases is called tokenizing, which form tokens from the text files. Next these tokens are further processed by inputting to text mining or parsing. Stemming is the process of finding the root words, this is commonly used in information retrieval. Here we use tokenizing and stemming inorder to make the tweet comparison effectively.
Step 3: Transforming the corpus into vector space using tf-idf
:
We extract the features using tf-idf. Tf-idf is the term frequency-inverse document frequency, and this weight isoften used in text mining and information retrieval. Tf-idfis used to measure the importance of a word in a corpus. The importance of a word is increased by number of times the word appears in the document,but that is offset by its frequency in the entire corpus. It contains two parts, term frequency (tf) and inverse document frequency (idf). Here theTf (term frequency) is the number of times a word occurs in document divided by the total number of word in that document. TheInverse Document Frequency (IDF), is calculated by the logarithm of the number of the documents in the corpus divided by the number of documents contains the specific term.
Tf.Idf
(t,d,D)=
𝐓𝐟
(t,d)⋅ 𝐈𝐝𝐟
(t,D)Where t denotes the terms, d denotes each documents and D denotes collection of documents.The first part of the formula Tf(t,d) is calculated simply by the number of times each word appeared in each document. And the second part Idf(t,D) can be calculated using the following formula,
Idf
(t,D)=
𝐥𝐨𝐠
|𝐃| 𝟏+| 𝐝∈𝐃:𝐭∈𝐝 | Step 4: Calculating Cosine distance:
After extracting the features using tf-idf, we use that value to measure the cosine similarity. Here we use cosine similarity inorder to find the similar tweets. Two documents are exactly similar when the cosine similarity is one, and they are dissimilar when cosine similarity is 0.It measures the cosine of the angle between two vectors inorder to find their similarity. We know cosine of 00 is 1, and less than one for any other angle. It gives the orientation not the magnitude, two vectors with same orientation have cosine similarity,1.If two vectors are perpendicular to each other that is 900,have similarity 0.The values of cosine similarity ranges between [0,1]. Thus Cosine similarity helps to measure how two documents are similar in terms of subject matter.Using thiscosine similarity we can identify the similar tweets and thatcan be used to cluster the similar tweets.
Sim(A,B)=Cosθ=
𝐀.𝐁 ∥𝐀∥∥𝐁∥Step 5: Clustering tweets:
Clustering is the process of making a group of objects in such a way that the object in one group (cluster) is more similar (in some way or another) than object in another group. Here in this paper we use bisecting k-means clustering algorithm, the bisecting K-means algorithm is a divisive hierarchical clustering algorithm, it starts with all objects in a single cluster.
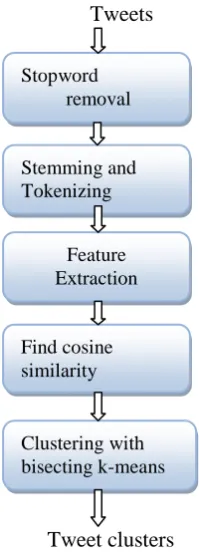
C. Flow diagram
:
Tweets
Tweet clusters
Fig 1:Proposed frameworkIV. PSEUDO CODE
Step 1: repeat
Step 2: Choose the parent cluster to be split C. Step 3: repeat
Step 4: Select two centroids at random from C.
Step 5: Assign the remaining points to the nearest subcluster using a pre-specified distance measure. Step 6: Recompute centroids and continue cluster assignment until convergence.
Step 7: Calculate inter-cluster dissimilarity for the 2 subclusters using the centroids. Step 8: until I iterations are completed.
Step 9: Choose those centroids of the subclusters with maximum inter-cluster dissimilarity. Step 10: Split C as C1 and C2 for these centroids.
Step11: Choose the large cluster among C1 and C2 and set it as the parent cluster. Step12: until K clusters have been obtained.
V. SIMULATION RESULTS
In order to show the effectiveness of clustering similar tweets (events) using bisecting k-means, we compare it with k-means clustering.
Clustering with bisecting k-means Stopword removal
Stemming and Tokenizing
Feature Extraction
A. Dataset:
We collected 13k tweets using Twitter Search API. We use list of search terms in order to get “meaningful” tweets. The collected tweets are preprocessed by stop word elimination, stemming and then tokenize the tweets. The tweets are then processed incrementally.
B. Performance indicators:
Entropy:Used to measure the goodness of clustering by measuring the amount of disorder in clustering. Smaller value of entropy indicates less disorder in clustering. It is based on the following formula,
𝐄 = − 𝐩 𝐱
𝐢⋅ 𝐥𝐨𝐠
𝟐 𝐧−𝟏𝐢=𝟎
𝐩 𝐱
𝐢Here p is the probability of terms in each cluster.The entropy of overall cluster is the weighted sum
of the cluster entropies,which is given by
E
overall=
𝐧𝐣 ⋅ 𝐄𝐣
𝐧 𝐦 𝐣=𝟏
Where m is the number of cluster, nis the total number of data points, njis the size of cluster j and Ejis
the entropy of cluster j.
Overall similarity:The cohesiveness of clusters can be used as a measure of cluster similarity.Cluster cohesiveness can be computed by weighted similarity of the internal cluster similarity which is equal to the square of the magnitude of the cluster centroid,and is given by,
𝟏
|𝐬|𝟐
𝐜𝐨𝐬𝐢𝐧𝐞 𝐝
′
, 𝐝
𝐝∈𝐬𝐝′∈𝐬
=
𝟏|𝐬| 𝐝∈𝐬
𝐝
⋅
𝟏|𝐬| 𝐝∈𝐬
𝐝
=
∥ 𝐜 ∥
2Where s is the set of documents, c is the centroid.
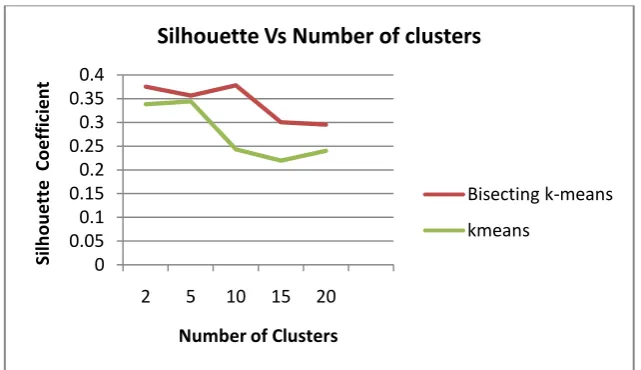
Silhouette coefficient:It is the method of interpretation and validation of consistency within clusters of data.It is calculated using mean intra cluster distance(a) and the mean nearest cluster distance(b).Silhouette coefficient is given by,
Fig 2: comparison of similarity and entropy between k-means and bisecting k-means
The performance of clustering against the above performance indicators is shown in fig.2 and fig.3.These graphs showthat bisecting k-means clustering is more efficient than k-means clustering. That means the similarity is high in clusters formed using bisecting k-means, entropy or disorder is less in clusters formed using bisecting k-means, and the value of silhouette coefficient shows that bisecting k-means clustering forms good clusters.
Fig 3: comparison of Silhouette coefficient between k-means and bisecting k-means
VI. CONCLUSION
In this paper, we have presented a tweet clustering method to efficiently and effectively monitorthe evolving tweets from continuous tweet streams. An efficient hierarchical clustering technique, bisecting k-means clustering algorithm is used to cluster the tweets. We have conducted experiments on real-life tweet datasets to verify our methods. The result shows that bisecting k-means clustering effectively and efficiently cluster the similar tweets and also shows that its performance is higher than K-means clustering.
0.500 0.700 0.900 1.100 1.300 1.500 1.700 1.900
2 5 10 15 20
En
tr
o
p
y
Number of Clusters
Entropy Vs Number of clusters
Bisecting k-means Kmeans 0 0.05 0.1 0.15 0.2 0.25 0.3 0.35 0.4
2 5 10 15 20
Si lh o u e tt e C o e ff ic ie n t
Number of Clusters
Silhouette Vs Number of clusters
Bisecting k-means kmeans 0 0.1 0.2 0.3 0.4 0.5 0.6 0.7 0.8
2 5 10 15 20
Si
m
ilar
ity
Number Of Clusters
Similarity Vs Number of clusters
Bisecting k-means
REFERENCES
1. J. Allan, R. Papka, and V. Lavrenko, “On-line new event detection and tracking,” in SIGIR, 1998, pp. 37–45.
2. H. Becker, M. Naaman, and L. Gravano, “Learning similarity metrics for event identification in social media,” in WSDM, 2010, pp. 291-300. 3. Y. Jie, L. Andrew, C. Mark, R. Bella, and P. Robert, “Using social media to enhance emergency situationawareness,” IEEE Intelligent Systems,vol. 27, no. 6, pp. 52–59, 2012.
4. A. Marcus, M. S. Bernstein, O. Badar, D. R. Karger, S. Madden, and R. C. Miller, “Twitinfo: Aggregating andvisualizing microblogs for event exploration,” in CHI, 2011, pp. 227–236.
5. P. Lee, L. V. S. Lakshmanan, and E. E. Milios, “Incremental cluster evolution tracking from highly dynamicnetwork data,” in ICDE, 2014, 6. H. Abdelhaq, C. Sengstock, and M. Gertz, “Eventweet: Online localized event detection from twitter,” PVLDB,vol. 6, no. 12, pp. 1326– 1329, 2013.
7. T. Sakaki, M. Okazaki, and Y. Matsuo, “Tweet analysis for real-time event detection and earthquake reportingsystem development,” IEEE Trans. Knowl. Data Eng., vol. 25, no. 4, pp. 919–931, 2013.
8. C. Li, A. Sun, and A. Datta, “Twevent: segment-based event detection from tweets,” in CIKM, 2012, pp. 155–164.
9. R. Li, K. H. Lei, R. Khadiwala, and K. C.-C. Chang, “Tedas: A twitterbased event detection and analysis system,”in ICDE, 2012, pp. 1273– 1276.
10.F. Atefeh and W. Khreich, “A survey of techniques for event detection in twitter,” Computational Intelligence,2013.
11.H. Gu, X. Xie, Q. Lv, Y. Ruan, and L. Shang, “Etree: Effective and efficient event modeling for real-time onlinesocial media networks,” in Web Intelligence, 2011, pp. 300–307.
12. R. Lee and K. Sumiya, “Measuring geographical regularities of crowd behaviors for twitter-based geo-socialevent detection,” in GIS- LBSN,2010, pp. 1–10.
13.K. Massoudi, M. Tsagkias, M. de Rijke, and W. Weerkamp, “Incorporating query expansion and qualityindicators in searching microblog posts,”in ECIR, 2011, pp. 362–367.
14.H. Becker, M. Naaman, and L. Gravano, “Beyond trending topics: Real world event identification on twitter,” inICWSM, 2011. 15. A.-M. Popescu, M. Pennacchiotti, and D. Paranjpe, “Extracting events and event descriptions from twitter,” inWWW, 2011. 16. J. Weng and B.-S. Lee, “Event detection in twitter,” in ICWSM, 2011, pp.401–408.
17. A. Angel, N. Koudas, N. Sarkas, D. Srivastava, M. Svendsen, and S. Tirthapura, “Dense subgraph maintenance under streaming edge weight updates for real-time story identification,” VLDB J., vol. 23, no. 2.
BIOGRAPHY
Shameena Banu.P received her B.Tech. degree in Information Technology from University of Calicut, and currently pursuing M.Tech in Computer Science at KMCT College of Engineering, Calicut. She has one year of teaching experience. Her research interest include data mining and information retrieval.