Manchester, United Kingdom - August 10-14, 2015 Division VII, Paper ID 611
DEVELOPMENT OF EVALUATION METHOD FOR SEISMIC
ISOLATION SYSTEMS OF NUCLEAR POWER FACILLITIES
-FRAGILITY EVALUATION METHODS OF SEISMICALLY ISOLATED
NUCLEAR POWER PLANT BUILDINGS-
Takahide Akimoto1, Shin-ichi Yoshida2, Takao Adachi3, Tetsuo Imaoka4, Kunihiko Sato5,
Masakazu Jimbo6, Tsutomu Hirotani7, Koichi Yabuuchi8, and Yasuo Okouchi9
1Engineering Dept., Nuclear Facilities Division, Obayashi Corporation, Japan
2Senior Manager, Engineering Dept., Nuclear Facilities Division, Obayashi Corporation, Japan 3Deputy Manager, Engineering Dept., Nuclear Facilities Division, Obayashi Corporation, Japan 4Senior Engineer, Aseismic Engineering Sec., Nuclear Plant Eng. Dept., Hitachi-GE Nuclear Energy,
Ltd., Japan
5Deputy Chief Manager, Nuclear Plant Designing Dept., Mitsubishi Heavy Industries, Ltd., Japan 6Group Manager, Aseismic & Structure Technology Group, Mechanical Technology & Design Dept.,
Isogo Nuclear Engineering Centre, Toshiba Corporation Power Systems Company, Japan
7Manager, Technology Dept., Nuclear Projects Div., Shimizu Corporation, Japan
8Assistant Manager, Structural Engineering Nuclear Power Dept., Kajima Corporation, Japan
9Deputy Manager, Nuclear Power Plant Architectural Engineering Section, Civil & Architectural Dept.,
Chubu Electric Power Co. Inc., Japan
ABSTRACT
For nuclear power plants (NPPs) in Japan, an evaluation of "a residual risk" against phenomena exceeding design conditions has been required. As the method of the risk assessment, the probabilistic risk
assessment (PRA) has great advantages. This paper proposed a fragility evaluation method for seismically isolated NPP buildings, in order to establish the seismic PRA method for the seismically isolated NPPs. The contents of this paper are the following.
First, we set evaluation criteria for seismic failure modes of seismically isolated NPP buildings. Specifically, we proposed a seismic event-tree and defined the failure modes.
Next, in order to make probabilistic models for response analysis, we proposed a method of setting a limit state of seismically isolated NPPs buildings, and identified uncertainty factors in the seismic behaviour (or response) of the building by sensitivity analyses. In this paper, based on the previous examination results, it was assumed that there were seven uncertainty factors in the seismic behaviour of the seismic isolated layer, the upper structure, and the structural foundation.
Finally, we calculated fragility curves of a seismically isolated NPP building for each failure mode. The fragility analysis results could be used for seismic PRA evaluations of a seismically isolated NPP facility. The result of the trial calculation clearly showed that the failure in the seismically isolated layer was dominant failure mode.
INTRODUCTION
23rd Conference on Structural Mechanics in Reactor Technology
Manchester, United Kingdom - August 10-14, 2015 Division VII
been required for the phenomenon exceeding design conditions. It is known that the seismic PRA is effective as an evaluation method for the residual risk.
In this paper, in order to establish the seismic PRA method for seismically isolated NPPs, we propose a scheme of probabilistic fragility evaluation methods focusing on buildings such as shown in Figure 1, and show a trial calculation of the fragility curves of a seismically isolated NPP building.
FALURE MODES OF SEISMICALLY ISOLATED NPP BUILDINGS
Based on the continuous research and development of application of the seismic isolation system to nuclear facilities for the higher earthquake-resistant safety, we propose an event-tree of seismically isolated NPPs as shown in Figure 2. Major failure modes could be identified as follows;
Mode 1: Failure around seismically isolated layer (red dotted frame in Figure 2) Mode 2: Failure in seismically isolated layer (blue dotted frame in Figure 2)
Mode 3: Failure in the upper structure due to excessive seismic load or collision to the retaining wall (Light green and deep green dotted frame in Figure 2)
Around seismically isolated layer [Retaining wall]
S eismically isolated layer
Upper building [Earthquake]
Upper building
[Earthquake+Collision] state
Equipments, Pipings
Not collision Not damaged Not damaged State1
1-Pf1 1-Pf21 1-Pf31
Damaged State2
Pf31
Damaged Not damaged State3
Pf21 1-Pf32
Damaged State4
Pf32
Collision Not damaged Not damaged State5
Pf1 1-Pf21 1-Pf41
Damaged State6
Pf41
Damaged Not damaged State7
Pf21 1-Pf41
Damaged State8
Pf41
Seismic ground motion
Fragility Evaluation
Figure 2.Event-tree of seismically isolated NPP building
*Pf: the probability of failure
23 Conference on Structural Mechanics in Reactor Technology Manchester, United Kingdom - August 10-14, 2015 Division VII
The fault-tree of the seismically isolated layer is shown in Figure 3. As a pedestal and anchor bolts can be designed with a margin beyond the rubber break of the isolator (Watanabe, T. et al. (2015)), we focus on "Collision of the seismically isolated building to the retaining wall", "Break of laminated rubber of the seismic isolator", and "Break of structural wall of the upper structure" as evaluation issues.
GROUND MOTION USED FOR ANALYSIS
The ground motion used for analysis is an artificial seismic wave corresponding to a seismic hazard level at a general Japanese NPP site, whose annual exceedance probability is about 10-4 as shown in Figure 4.
The maximum acceleration is 800cm/s2 and maximum velocity (h=5%) is 200 cm/s. As the vertical
direction, 2/3 times the horizontal wave is used. Horizontal ground motion used for analysis as the acceleration time history and the input wave spectra is shown in Figure 5.
METHOD OF SETTING OF THE VARIATION
Setting of the limit state (capacity)
For the evaluation of probabilistic responses of buildings, limit states of containments must be set. In this chapter, the limit states of containments; capacities, are set for each identified three failure mode:
"Collision of the seismically isolated building to the retaining wall", "Break of laminated rubber of the seismic isolator", and "Break of structural wall of the upper structure".
Figure 5. Horizontal ground motion used for analysis Acceleration time-history
Spectra
-1000 -800 -600 -400 -200 0 200 400 600 800 1000
0 20 40 60 80 100 120 140
Acc
e
ra
lat
ion
[cm/
s
2]
Time [s]
SsH1 794.1[gal]
-800.0[gal]
Figure 4. Seismic hazard curve
1.0E-08 1.0E-07 1.0E-06 1.0E-05 1.0E-04 1.0E-03 1.0E-02 1.0E-01 1.0E+00
0 1000 2000 3000
Ex
cee
d
an
ce
Pro
b
ab
il
it
y
seismic acceleration䠄cm/s/s䠅
period䠖0.02s
800cm/s2
Figure 3.Fault-tree of seismically isolated NPP building
Failure around seismically isolated layer
Collision to Retaining wall
Break of Laminated rubber
Break of Pedestal
Break of Anchor bolt
Break of Structural wall Failure in
seismically isolated layer
Failure in upper building
23rd Conference on Structural Mechanics in Reactor Technology
Manchester, United Kingdom - August 10-14, 2015 Division VII
“Collision to the retaining wall”is determined by the clearance between the building and the retaining wall. In this study, the clearance is defined 2.0m as a definite value.
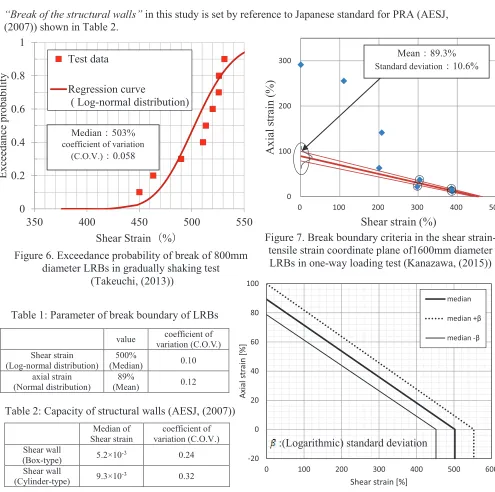
“Break of the laminated rubber” is the limit state of seismically isolated layer, determined by the past fracture test results. Figure 6 shows a distribution of horizontal fracture strain which was provided by the fracture test results of the 800mm diameter LRBs (Takeuchi, Y. et al. (2013)), and Figure 7 shows a break boundary criteria in the shear strain-tensile strain coordinate plane provided by the 1600mm diameter LRBs (Kanazawa, K. et al. (2015)). Between these two tests, there are differences in loading method. In this study, it is presumed that the break limit value in shear strain follows log-normal distribution as shown in Figure 6 and the break limit value in axial strain follows normal distribution as shown in Figure 7. Based on these test results, the break boundary is set as shown in Table 1 and Figure 8.
“Break of the structural walls” in this study is set by reference to Japanese standard for PRA (AESJ, (2007)) shown in Table 2.
-20 0 20 40 60 80 100
0 100 200 300 400 500 600
A xi a l st rai n [ % ]
Shear strain [%]
median
median +β
median -β
Figure 8. Break boundary of LRBs
value coefficient of
variation (C.O.V.) Shear strain
(Log-normal distribution)
500%
(Median) 0.10
axial strain (Normal distribution)
89%
(Mean) 0.12
Table 1: Parameter of break boundary of LRBs
Median of Shear strain
coefficient of variation (C.O.V.) Shear wall
(Box-type) 5.2×10
-3 0.24
Shear wall
(Cylinder-type) 9.3×10
-3 0.32
Table 2: Capacity of structural walls (AESJ, (2007))
Figure 7. Break boundary criteria in the shear strain-tensile strain coordinate plane of1600mm diameter LRBs in one-way loading test (Kanazawa, (2015)) 0 0.2 0.4 0.6 0.8 1
350 400 450 500 550
E x ceedan ce p ro b ab il it y
Shear Strain㸦%㸧 Test data
Regression curve
( Log-normal distribution)
Median㸸503%
coefficient of variation
(C.O.V.)㸸0.058
Figure 6. Exceedance probability of break of 800mm diameter LRBs in gradually shaking test
(Takeuchi, (2013))
0 100 200 300
0 100 200 300 400 500
A x ial s trai n (% )
Shear strain (%)
Mean㸸89.3%
Standard deviation㸸10.6%
23rd Conference on Structural Mechanics in Reactor Technology
Manchester, United Kingdom - August 10-14, 2015 Division VII Setting of the response variations
In this study, it is presumed that there are seven uncertainty factors having effect on response of seismically isolated buildings. The uncertainty factors are the following.
1. Horizontal stiffness of the laminated rubber (KR1)
2. Vertical stiffness of the laminated rubber (KC1)
3. Initial stiffness of the lead plug (KD1)
4. Shear yield strength of the lead plug (F3) 5. Concrete strength of the upper structure (FC)
6. Damping ratio of the upper structure (h)
7. Shear wave velocity of the foundation soil (VS) as the foundation stiffness
These uncertainty factors are presumed to follow log-normal distribution, and their mean values and variations are determined as shown in Table 3 and Table 4.
In seismically isolated layer, there could be four uncertainty factors consisted of seismic isolator’s stiffness such as KR1, KC1, KD1, and F3. It has been shown in the previous research (Matsuoka, et al.
(2013)) that the uncertainty factors have an upper and lower limit value for the design values as shown in Table 3. Therefore, in this study, the mean value of each parameter is determined as the design value, and the coefficient of variation (C.O.V.) of each parameter is set to be 10% with the assumption that the maximum design range of 30% is consistent with 3 times of the C.O.V. On the other hand, the C.O.V. of the initial stiffness of a lead plug (F3) is intentionally enlarged as 50%, since there was no clear evidence for F3.
In upper structure and structural foundation, it is presumed that there are three uncertainty factors such as FC, h, and VS. The mean values and variations of each parameter are determined by reference to Japanese
standard for PRA (AESJ, (2007)) as shown in Table 4.
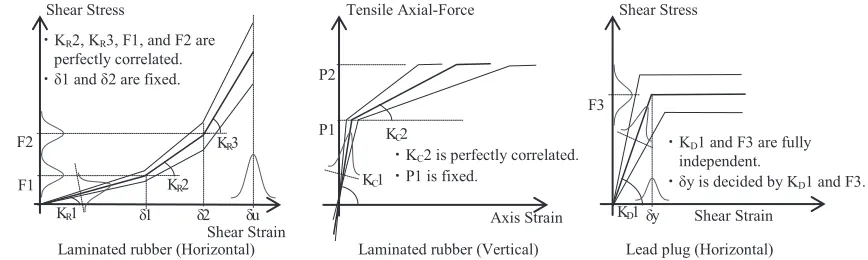
The concept of probabilistic restoring force model of seismic isolator is shown in Figure 9.
Table 3: Variation of seismically isolated layer
(Matsuoka,
etc.,2013) This Study
Upper limit
Lower
limit Mean C.O.V.
Horizontal stiffness of
the laminated rubber KR1 +35% -15%
Design value
0.10
Shear yield strength of
the lead plug F3 +30% -20% 0.10
Vertical stiffness of the
laminated rubber KC1 +30% -10% 0.10
Initial stiffness of the
lead plug KD1 - - 0.50
Table 4: Uncertainty factors other than the seismically isolated layer
Mean C.O.V.
Strength of
Concrete Fc
Design value
× 1.4 0.13
Damping ratio of upper structure
h 5% 0.25
Shear wave
velocity Vs Design value 0.10
Figure 9. Concept of probability restoring force model of seismic isolator
Shear Strain
࣭KC2 is perfectly correlated. ࣭P1 is fixed.
Laminated rubber (Vertical) Tensile Axial-Force
KC2
KC1
P2
P1
Axis Strain
࣭KD1 and F3 are fully
independent.
࣭δy is decided by KD1 and F3.
Lead plug (Horizontal) F3
KD1δy Shear Strain Shear Stress
࣭KR2, KR3, F1, and F2 are
perfectly correlated.
࣭δ1 and δ2 are fixed.
δ1 δu
F1 F2
Laminated rubber (Horizontal) KR2
δ2 KR1
KR3
23rd Conference on Structural Mechanics in Reactor Technology
Manchester, United Kingdom - August 10-14, 2015 Division VII Sensitivity analysis of uncertainty factors
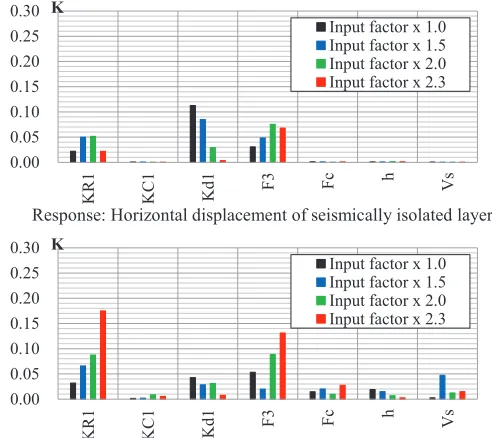
The sensitivity analyses are performed in order to select major uncertainty factors having effect on response of seismically isolated buildings. For the response analysis, a model of a seismically isolated NPP building (PWR type) is used as shown in Figure 10. Sensitivity of uncertainty factors is calculated by formula (1).
Sensitivity analyses are conducted for 15 cases, including one case which used the median of parameter and each two case used the parameter varied plus-minus (Logarithmic standard deviation) from median for each of the seven uncertainty factor. The result of sensitivity analyses are shown in Figure. 11. Figure 11 shows that the dominant uncertainty factors of a PWR type building are Horizontal stiffness of the lamination rubber (KR1), Shear yield strength of the lead plug (F3) and Shear wave velocity of the foundation soil (VS).
Comparison of variation evaluation method
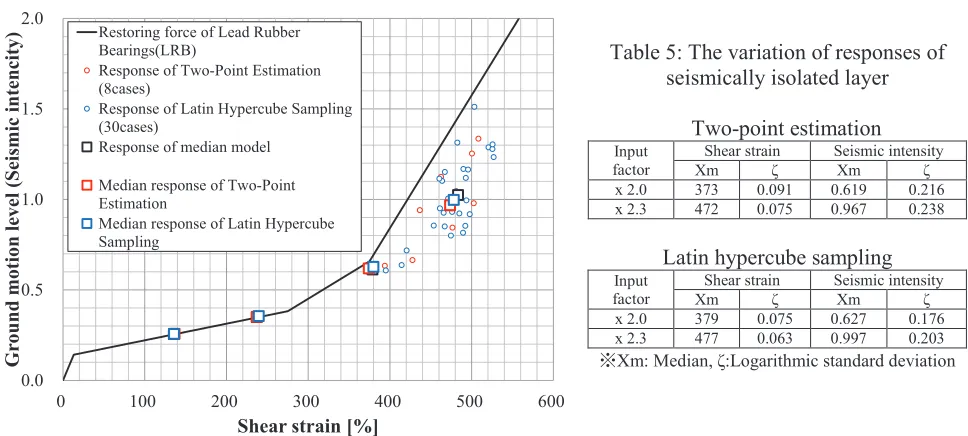
To decide on the analytical method which evaluates the variation in responses, a comparison of the two-point-estimation method and the Latin hypercube sampling (LHS) method is performed. Evaluation results of these methods are compared by the PWR model analyses where the ground motions (shown in the previous chapter) are enlarged and the three dominant uncertainty factors are concerned. 23 = 8 cases
are employed for the two-point-estimation method and 30 (samplings) cases for the LHS method. The calculated shear strain of seismically isolated layer by two methods is shown in Figure 12 and Table 5. Figure 12 shows that there are only small differences between the two methods in the response of shear strain of seismic isolated layer, though the input seismic level becomes large. Therefore, considering for shortening analysis time, two-point-estimation method can be sufficient to evaluate the variation in responses of a seismically isolated building. The same is true for BWR type buildings.
Sensitivity of uncertainty factor㸸
㸸Response of median model 㸸Response of (median+ ) model 㸸Response of (median- ) model * :Logarithmic standard deviation
Figure 10. Analysis model (PWR-type)
0.00 0.05 0.10 0.15 0.20 0.25 0.30
K
R1
K
C1
K
d
1
F
3 Fc h
V
s
K
Input factor x 1.0 Input factor x 1.5 Input factor x 2.0 Input factor x 2.3 0.00
0.05 0.10 0.15 0.20 0.25 0.30
K
R1
K
C1
K
d
1
F
3
F
c h
V
s
K
Input factor x 1.0 Input factor x 1.5 Input factor x 2.0 Input factor x 2.3
Figure 11. The result of the sensitivity analyses
23rd Conference on Structural Mechanics in Reactor Technology
Manchester, United Kingdom - August 10-14, 2015 Division VII
TRIAL CALCULATION OF THE FRAGILITY
A fragility curve for a seismically isolated NPP building (PWR type) is calculated using the proposed evaluation methods. The analysis model is shown in Figure 13. This is a model of the PWR type building where seismic isolators are arranged as shown in Figure 14. The input ground motions (both horizontal and vertical) are used as shown in Figure 5. According to the setting method shown in the previous chapter, the probabilities of each failure mode are calculated. The concept of the failure probability of seismic isolators shows in Figure 15. The practical procedure of the calculation method is shown in the following.
1. Conduct eight cases of response analyses by two-point-estimation method, changing the dominant uncertainty factors; KR1, F3 and VS., while changing the input factor of ground
motion level to 1.0, 1.5, 2.0, and 2.5.
2. From the eight results of the response analyses, presume the probabilistic distribution of the responses of the structural foundation; horizontal displacement, the structural wall; shear strain, and the seismically isolated layer; shear strain and axial strain of seismic isolators. Log-normal distribution is adopted for the distribution of responses except for axial strain of seismic isolators. For the distribution of the axial strain of seismic isolators, a normal distribution is adopted, considering positive and negative strain. In this study, we presume that the shear strain and the axial strain are irrelevant.
3. Calculate the probabilistic responses of the building from the probabilistic distribution. The responses of the seismically isolated layer consist of a set of shear strain and axial strain; we calculate the probabilistic responses by Monte Carlo method. In this study, the number of samples of response is 3000.
4. Calculate the probabilistic capacity of elements according to the setting method shown in the previous chapter. In the same way as above, calculate by Monte Carlo method for the capacity of the seismically isolated layer, using the break boundary of LRBs. In this calculation, the number of samples of capacity is 3000.
5. Calculate the failure probabilities. The probability of collision and the probability of failure in structural wall are calculated explicitly. The probability of failure in the seismically isolated layer is provided by counting the number of samples whose response exceeds their capacity. The total number of samples is obtained by multiplying 3000 by 3000.
Figure 12.Comparison between two methods
Table 5: The variation of responses of seismically isolated layer
Two-point estimation
Input factor
Shear strain Seismic intensity
Xm ζ Xm ζ
x 2.0 373 0.091 0.619 0.216
x 2.3 472 0.075 0.967 0.238
Latin hypercube sampling
Input factor
Shear strain Seismic intensity
Xm ζ Xm ζ
x 2.0 379 0.075 0.627 0.176
x 2.3 477 0.063 0.997 0.203
ͤXm: Median, ζ:Logarithmic standard deviation
0.0 0.5 1.0 1.5 2.0
0 100 200 300 400 500 600
Gr
ou
nd
mot
ion
le
vel (
Seismi
c
intencity)
Shear strain [%] Restoring force of Lead Rubber
Bearings(LRB)
Response of Two-Point Estimation (8cases)
Response of Latin Hypercube Sampling (30cases)
Response of median model
Median response of Two-Point Estimation
23rd Conference on Structural Mechanics in Reactor Technology
Manchester, United Kingdom - August 10-14, 2015 Division VII
In this study, we focus on the response of two seismic isolators placed at the edge of E and W-side of the structural foundation as shown in Figure 14.
The probabilistic responses of the seismic isolators are shown in Figure 16. Compared with the responses of the seismic isolators of the E-side and the W-side, the axial strain of the E-side has a tendency to become large when the input factor is 2.3. This axial strain is caused by a rocking response of the upper structure, and the maximum rocking response is occurred when the E-side vertical displacement goes upward, which makes the axial strain to be in tension.
The fragility curves calculated by the response distribution are shown in Figure 17. Although the response distributions of the both seismic isolators of the E-side and the W-side are different, there is a slight difference in their fragility curves. The result suggests that the shear strain of the seismic isolators largely influences the fragility curves much more than the axial strain.
As shown in Figure17, neither probability of collision to retaining wall nor failure in shear wall of the upper structure affects the fragility. Both of the exceedance probabilities are almost 0% beyond the 2.3
-20 0 20 40 60 80 100
0 100 200 300 400 500 600
A
xi
a
l
st
rai
n
[
%
]
Shear strain [%]
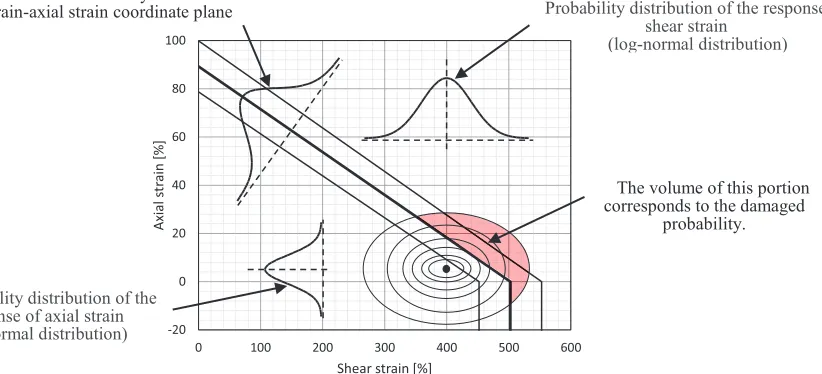
Figure 15. Concept of the failure probability of seismic isolators
Probability distribution of the response of shear strain
(log-normal distribution) Probabilistic break boundary criteria in the
shear strain-axial strain coordinate plane
Probability distribution of the response of axial strain
(normal distribution)
The volume of this portion corresponds to the damaged
probability.
Figure 14. Placement of seismic isolators
W-side
Sway direction 70m
85m
E-side
N E
23rd Conference on Structural Mechanics in Reactor Technology
Manchester, United Kingdom - August 10-14, 2015 Division VII
0.00 0.20 0.40 0.60 0.80 1.00
㻜 㻡㻜㻜 㻝㻜㻜㻜 㻝㻡㻜㻜 㻞㻜㻜㻜 㻞㻡㻜㻜 㻟㻜㻜㻜
E
x
ce
eda
nce
P
ro
ba
bil
it
y
Maximum Acceralation of ground motion 䠄cm/s/s)
Collision to retaining Wall
Failure in shear wall of upper structure
Faulure in seismic Isolator (E-side)
Faulure in seismic Isolator (W-side)
times of the design motion level. Therefore the failure in the seismic isolators has a major influence on the fragility curves of seismically isolated NPP buildings.
CONCLUSIONS
This paper proposed a scheme of probabilistic fragility evaluation method focusing on seismically isolated NPP buildings and provided a trial calculation of the fragility curves. The findings are the following.
Failure modes of seismically isolated NPP buildings were proposed, and the limit states corresponding to each failure mode were defined.
According to the previous examination results, the method of setting the variations in capacities and responses was proposed, and the uncertainty factors which affected responses were clarified by a sensitivity analysis. Furthermore, by comparison of two evaluation methods for variations in
E-side (Input factor = 2.0) W-side (Input factor = 2.0) E-side (Input factor = 2.3) W-side (Input factor = 2.3)
: median of break boundary of LRBs, : median sbeta break boundary of LRBs
Figure 16. Probabilistic responses of seismic isolators
Figure 17. Fragility curves of the seismically isolated NPP building
Input factor =×2.0㻌 Input factor =×2.3㻌
Input factor =×2.5㻌
Device E-side median:1763[cm/s2]
Logarithmic standard deviation: 0.067 Device W-side
median:1793[cm/s2]
Logarithmic standard deviation: 0.073
23rd Conference on Structural Mechanics in Reactor Technology
Manchester, United Kingdom - August 10-14, 2015 Division VII
building responses; the two-point-estimation method and the LHS method, the results of each method were confirmed to be almost the same.
An evaluation method for the failure probability of a seismically isolated NPP building was proposed, considering the probabilistic responses and capacities.
A trial calculation for fragility curves of a seismically isolated NPP building was performed. The results clearly showed that the failure in the seismically isolated layer was dominant among the failure modes of the seismically isolated NPP buildings.
Since the variation value of the lead plug used in this study were not based on sufficient data, more accumulation of test results and data analyses might be necessary for improvement in the reliability of the evaluation.
In this study, it was assumed that the dominant failure mode (the failure in seismic isolated layer) is decided by the break of laminated rubber. In order to develop the evaluation of the “residual risk” to be more advanced, it would be necessary to estimate the behaviour of seismically isolated NPP buildings after the break of laminated rubber.
ACKNOWLEDGMENTS
This technology development has been carried out as Japan national project “Development for Evaluation Methods of Seismic Isolation Systems” with the participation of Chubu Electric Power, Japan Atomic Power, Hokkaido Electric Power, Tohoku Electric Power, Tokyo Electric Power, Hokuriku Electric Power, Kansai Electric Power, Chugoku Electric Power, Shikoku Electric Power, Kyushu Electric Power, J Power, Toshiba, Hitachi-GE Nuclear Energy, Mitsubishi Heavy Industries, and the Institute of Applied Energy.
We thank Dr. Nishikawa, a Professor Emeritus at Tokyo Metropolitan University, Dr. Kubo, a Professor Emeritus at the University of Tokyo, Dr. Fujita, a Professor Emeritus at the University of Tokyo, Dr. Kasahara, a Professor at the University of Tokyo, Dr. Yabana, the Central Research Institute of Electric Power Industry for their advice.
In performing the evaluations presented in this paper, we used the strong motion seismograph network, K-NET, operated by the National Research Institute for Earth Science and Disaster Prevention. We thank the Institute for letting us use K-NET.
REFERENCES
Watanabe, T. et al. (2015), “Development of an Evaluation Method for Seismic Isolation Systems of Nuclear Power Facilities, -Experimental Study on Structural Characteristics of Base Isolated Foundation Coupled with Seismic Isolator-” Trans of the twenty-third Structural Mechanics in Reactor Technology (SMiRT-23), Manchester, UK (in press).
Atomic Energy Society of Japan (2007), “The Standard Procedure for Seismic PSA:2007 (AESJ-SC-P006:2007)” , in Japanese
Takeuchi, Y. et al. (2013) “Development of an Evaluation Method for Seismic Isolation Systems (Part2) The Basic Characteristics Test of a Seismic Isolation System for Nuclear Power Plant” Sendai-Japan.
Kanazawa, K. et al. (2015). “Development of an Evaluation Method for Seismic Isolation Systems of Nuclear Power Facilities, -Break Test of Full Scale Lead Rubber Bearings for Nuclear Facilities, Part4 Break Boundary Criteria of Real-Size Isolator Specimens-” Trans of the twenty-third Structural Mechanics in Reactor Technology (SMiRT-23), Manchester, UK (in press).