OncoTargets and Therapy 2017:10 4625–4633
OncoTargets and Therapy
Dove
press
submit your manuscript | www.dovepress.com 4625
O r i g i n a l r e s e a r c h
open access to scientific and medical research
Open access Full Text article
nanOg as an adverse predictive marker in
advanced non–small cell lung cancer treated
with platinum-based chemotherapy
Boksoon chang1
Myung Jae Park1
sue in choi2
Kwang ho in2
chul hwan Kim3
seung hyeun lee1
1Division of Pulmonary and critical
care Medicine, Department of internal Medicine, Kyung hee University school of Medicine,
2Division of respiratory and critical
care Medicine, Department of internal Medicine, 3Department of
Pathology, college of Medicine, Korea University, seoul, south Korea
Purpose: NANOG is a master transcription factor that regulates stem cell pluripotency and cellular reprograming. Increased NANOG expression has been associated with poor survival in several human malignancies. However, the clinical significance of NANOG overexpression in lung cancer has been scarcely evaluated. The aim of this study was to investigate whether NANOG levels are associated with clinical outcomes of patients with non–small cell lung cancer (NSCLC) who were treated with platinum-based chemotherapy.
Methods: NANOG levels were evaluated immunohistochemically using the histologic score (H-score) in tumor tissues from patients with advanced NSCLC who received platinum-based doublet treatment. We performed survival analyses according to the NANOG levels and evaluated the association between clinicopathological parameters and levels of NANOG.
Results: Multivariate analyses using 112 tumor specimens showed that high NANOG levels were independently associated with short progression-free survival (hazard ratio [HR] =3.09, 95% confidence interval [CI]: 2.01–4.76) and with short overall survival (HR =3.00, 95% CI: 1.98–4.54). Similar results were shown in the subgroup analyses for patients with adeno-carcinoma and squamous cell adeno-carcinoma. NANOG expression was not associated with any clinicopathological parameter such as age, gender, smoking status, stage, differentiation, or histological subtypes.
Conclusion: NANOG overexpression was associated with poor response and short overall survival in patients with advanced NSCLC who were treated with platinum-based chemotherapy, suggesting that NANOG could be a potential adverse predictive marker in this setting.
Keywords: lung cancer, biomarker, cancer stem cell, NANOG, chemotherapy, platinum
Introduction
Despite intensive efforts to control cancer-associated morbidity and mortality, lung cancer is still the leading cause of cancer-related death globally.1 Approximately
220,000 new cases of lung cancer and 158,000 cases of lung cancer-related deaths occurred in the Unites States in 2015.1 Non–small cell lung cancer (NSCLC) is a major
type of lung cancer, which contributes 80% of cases to this fatal disease. Although several tyrosine kinase inhibitors targeting the epidermal growth factor receptor (EGFR) mutation and anaplastic lymphoma kinase rearrangement have contributed to the increased survival of patients with NSCLC, platinum-based combination chemotherapy is the standard of care for advanced diseases, especially in patients who do not harbor these genetic abnormalities. Therefore, it is clinically important to discover biomarkers that allow prediction of treatment response or survival after chemotherapy.
correspondence: seung hyeun lee Division of Pulmonary and critical care Medicine, Department of internal Medicine, Kyung hee University school of Medicine, Kyungheedae-ro 23, Dongdaemun-gu, seoul 02447, south Korea
Tel +82 2 958 8511 Fax +82 2 968 1848
email humanmd04@hanmail.net
Journal name: OncoTargets and Therapy Article Designation: Original Research Year: 2017
Volume: 10
Running head verso: Chang et al
Running head recto: NANOG as an adverse predictive marker in advanced NSCLC DOI: http://dx.doi.org/10.2147/OTT.S144895
OncoTargets and Therapy downloaded from https://www.dovepress.com/ by 118.70.13.36 on 25-Aug-2020
For personal use only.
Number of times this article has been viewed
This article was published in the following Dove Press journal: OncoTargets and Therapy
Dovepress
chang et al
Although several potential predictive biomarkers such as the KRAS mutation and the excision repair of cross-complementation group 1 in the context of platinum-based chemotherapy have been extensively investigated, the clinical utility of those biomarkers was found to be unacceptable.2–4
Recently, numerous biomarkers are under active investiga-tion; for example, cancer stemness markers provide a better understanding of cancer development and are emerging as promising candidates.5,6
NANOG, named after the Celtic word Tír na nÓg, meaning the land of the young, is a homeobox domain transcription factor, which is a key regulator of embryonic development and cellular reprogramming.7 NANOG-induced
cellular reprogramming of somatic cells results in unlimited self-renewal and clonogenic growth, and finally, oncogenic transformation through complex interaction with other stem-cell factors such as octamer-binding transcription factor 4, sex determining region Y-box 2, and Kruppel-like factor 4.7
In addition, NANOG is broadly expressed in a variety of human malignancies, including lung cancer.8–10 Interestingly,
evidence suggests that elevated levels of NANOG have been frequently associated with poor clinical outcomes in many human solid cancers.11–13 Moreover, NANOG
overexpres-sion was associated with poor survival not only in the early stages of NSCLC treated with surgical resection but also in all lung cancer types regardless of their stages.8–10 However,
there has been no published data on the predictive value of NANOG in patients with advanced NSCLC who were treated with cytotoxic chemotherapy.
In this study, we investigated whether NANOG levels are associated with clinical outcomes in NSCLC patients treated with platinum-based chemotherapy to determine the suitability of this stem-cell regulator as a potential predictive marker in this setting.
Materials and methods
study subjects and data collection
We retrospectively recruited patients with advanced NSCLC who received the platinum-based doublet as the first-line chemotherapy at the Korea University Anam Hospital from August 2009 to July 2011. NANOG expression was mea-sured in formalin-fixed, paraffin-embedded tumor specimens acquired by percutaneous needle or bronchoscopic biopsy. Patients who died within 1 month after the diagnosis, had history of other cancers, and had previously received chemo- or radiotherapy were excluded. A total of 148 patients who received the platinum-based doublet for NSCLC were screened. Among them, 16 cases were excluded due to the unsuit-ability of the specimens for immunohistochemical (IHC)
staining, 14 were excluded due to unavailable survival data, and 6 were excluded according to the exclusion criteria mentioned above. Finally, 112 cases were found to be accept-able for evaluation and were analyzed in this study.
Clinical data were reviewed from the electronic medical record system. Clinical staging was determined using chest computed tomography, brain magnetic resonance imaging, and 18F-fluorodeoxyglucose positron emission tomography based on the 7th lung cancer TNM classification and staging system.14 Response to treatment was examined by computed
tomography every two cycles and evaluated according to the Response Evaluation Criteria in Solid Tumors (RECIST) 1.1 as complete response (CR), partial response (PR), stable disease (SD), or progressive disease (PD).15 This study was
conducted after obtaining written informed consent from patients. The study protocol was approved by the ethics committee of our institution, the Clinical Research Ethics Committee of the Korea University Anam Hospital.
Quantification of NANOG protein
expression
IHC staining was used to evaluate NANOG levels in tumor sections. Four-micron-thick sections from each specimen were stained using a BOND-MAX Immunoautostainer (Leica Biosystems, Newcastle Upon Tyne, UK). Slides were heated at 98°C for 20 minutes and cooled for 10 minutes in Epitope Retrieval Solution 2 and EDTA buffer, respectively. The slides were then washed in distilled water, followed by blocking of endogenous peroxidase activity for 10 minutes. Thereafter, the slides were washed and placed in EDTA buffer, followed by incubation for 15 minutes with 1:200 dilution of NANOG rab-bit polyclonal antibody (Cell Signaling Technology , Danvers, MA, USA). Subsequently, the slides were treated with the Bond Polymer Refine Detection Kit (Leica Biosystems) for 15 minutes. Sections were developed with 3,3′ -diamino-benzidine chromogenic solution for 7 minutes and counter-stained with hematoxylin. Human seminoma tissue was used as positive control, and slides stained without the primary antibody were used as negative control.
IHC evaluation was independently performed by two investigators (SH Lee and CH Kim) without the knowledge of the clinical data. The stained cells were interpreted as positive when nuclear or cytoplasmic staining was identi-fied. Staining intensities of individual cells were graded as 0 (no staining), 1 (weak), 2 (distinct), or 3 (strong), and the percentages of cells with these staining intensities were calcu-lated. Finally, histological scores (H-scores) were calculated by multiplying the staining intensities with the percentages of cells in each staining intensity range (0–300). Slides with
OncoTargets and Therapy downloaded from https://www.dovepress.com/ by 118.70.13.36 on 25-Aug-2020
Dovepress nanOg as an adverse predictive marker in advanced nsclc
discordant assessment were re-evaluated and a consensus was reached.
statistical analyses
Statistical analyses were performed using the SPSS 18.0 software for Windows (SPSS Inc., Chicago, IL, USA). The cutoff H-score for discriminating between low and high NANOG expression was defined as the point with the lowest p-value on the log-rank test for all possible H-scores. Clinical outcomes were assessed using response rate (RR), progression-free survival (PFS), and overall survival (OS). RR was defined as the percentage of patients with CR and PR among the population. PFS was defined as the time from the first day of chemotherapy to disease progression or death from any cause. OS was defined as the time from the first day of chemotherapy to death from any cause. The correlation between NANOG levels and clinicopathological parameters was analyzed using the chi-square test or Fisher’s exact test. Associations between clinicopathological parameters and survival were evaluated by univariate analysis using the log-rank test. Multivariate survival analysis was performed with adjustment for parameters with p-values ,0.3 in the univari-ate analysis using the Cox hazard regression model. Survival probability was estimated by the Kaplan–Meier method.
p-value ,0.05 was considered statistically significant.
Results
Patient characteristics
Table 1 shows the clinical characteristics of the study popula-tion. All the subjects were Korean and the median age was 68 years (range, 36–82 years). Thirty-four patients (30%) were female, and 71 patients (63%) were over 65 years of age. Thirty-seven patients (33%) were never smokers. Seventy-nine patients (71%) had Eastern Cooperative Oncology Group performance statuses of 0 or 1, and 23 patients (21%) were in stage IIIB. Forty-eight patients (43%) had squamous cell carcinoma and 29 patients (26%) had moderate to poorly differentiated tumors. EGFR mutational status was analyzed in 20 adenocarcinomas; eight patients (40%) were mutated while 12 patients (60%) were wild-type.
The drugs combined with platinum for first-line che-motherapy are as follows: gemcitabine (n=49, 44%), pem-etrexed (n=37, 33%), paclitaxel (n=15, 13%), and docetaxel (n=11, 10%). The median number of cycles of the treatment was 4 (range, 1–9). Among all patients, 64 (57%) received second-line or further treatment during the follow-up period. They were treated with pemetrexed (n=17, 27%), gemcitabine/ vinorelbine (n=16, 25%), gefitinib (n=13, 20%), erlotinib (n=10, 16%), or paclitaxel (n=8, 13%) as second-line treatment.
Twenty-nine patients received further chemotherapy using gemcitabine/vinorelbine (n=12, 41%), gefitinib (n=8, 28%), pemetrexed (n=6, 21%), or paclitaxel (n=3, 10%).
nanOg expression
Representative sections with different H-scores are shown in Figure 1. NANOG was mainly localized in the cytoplasm of cancer cells and a few were detected in the nucleus, which is consistent with previous studies.8–10 The H-scores
of all patients were normally distributed with a median of 178.3 (range, 24–298). Median H-scores of the patients with
Table 1 The clinical characteristics of patients according to low and high nanOg expression
Variables No of
patients (%)
NANOG expression
p-value
Low (,180)
High ($180)
Total number of patients 112 (100) 68 (60) 44 (40)
gender 0.419
Female 34 (30) 19 (28) 15 (34)
Male 78 (70) 49 (72) 29 (66)
age 0.852
,65 years 41 (37) 25 (37) 16 (36)
$65 years 71 (63) 43 (63) 28 (64)
smoking 0.764
never 37 (33) 22 (32) 15 (34)
ever 75 (67) 46 (68) 29 (66)
ecOg performance 0.682
0, 1 79 (71) 47 (69) 32 (73)
$2 33 (29) 21 (31) 12 (27)
T stage 0.637
T1 7 (6) 4 (6) 3 (7)
$T2 105 (94) 64 (94) 34 (93)
n stage .0.999
n0 11 (10) 7 (10) 4 (9)
$n1 101 (90) 61 (90) 40 (91)
stage 0.645
iiiB 23 (21) 13 (19) 10 (23)
iV 89 (79) 55 (81) 34 (77)
egFr mutation* .0.999
Positive 8 (40) 5 (38) 3 (43)
negative 12 (60) 8 (62) 4 (57)
Differentiation 0.487
Well 83 (74) 52 (76) 31 (70)
Moderate–poor 29 (26) 16 (24) 13 (30)
Tumor histology 0.716
aDc 64 (57) 45 (66) 19 (43)
sQcc 48 (43) 23 (34) 25 (57)
First-line treatment 0.743
Pemetrexed/platinum 37 (33) 23 (34) 14 (32) gemcitabine/platinum 49 (44) 27 (40) 22 (50) Paclitaxel/platinum 15 (13) 10 (15) 5 (11) Docetaxel/platinum 11 (10) 8 (11) 3 (7)
Note: *egFr mutation data were available in 20 adenocarcinoma patients.
Abbreviations: ecOg, eastern cooperative Oncology group; egFr, epidermal
growth factor receptor; n, lymph node; T, tumor; aDc, adenocarcinoma; sQcc, squamous cell carcinoma.
OncoTargets and Therapy downloaded from https://www.dovepress.com/ by 118.70.13.36 on 25-Aug-2020
Dovepress
chang et al
adenocarcinoma and those with squamous cell carcinoma were 167.1 (range, 24–298) and 189.4 (range, 46–292), respectively. Median H-scores was not significantly different among three groups. Distribution of H-scores according to each group is presented in Figure 2.
association between nanOg levels and
clinicopathological parameters
To distinguish between low and high NANOG levels, the optimal cutoff H-score was determined as 180. With this cutoff, 68 (60%) and 44 (40%) patients were allocated to the low and high NANOG group, respectively.
To evaluate whether NANOG levels are associated with clinicopathological parameters, we compared the proportion
of patients with low and high NANOG levels in different patient groups. However, there was no difference in the proportion of patients with low and high NANOG levels in any patient group (Table 1). This indicates that clinicopatho-logical parameters, including age, gender, smoking status, performance status, stage, tumor differentiation, or histologi-cal subtype, were not associated with NANOG levels.
association between nanOg levels and
response to treatment
Fifty-one patients (45%) showed PR, 25 (22%) showed SD, and 36 (33%) showed PD. Thus, the overall RR was 45%. Twelve (27%) and 29 (43%) patients showed PR in the high and low NANOG groups, respectively. Thus, the RR in the high NANOG group was significantly lower compared to that in the low NANOG group (p=0.03). Clinicopatho-logical parameters such as young age, never smoking, well-differentiated tumor, and good performance showed a trend toward better response to treatment, but were not statistically significant.
association between nanOg levels
and PFs
Survival analyses results according to the clinicopathologi-cal parameters are summarized in Table 2. The median PFS for the overall population was 6.5 months (95% confidence interval [CI]: 2.4–11.4 months). Univariate analysis showed that advanced tumor stage and squamous histology were associated with shorter PFS. In addition, high NANOG levels
$
$'&
64&&
%
&
Figure 1 representative immunohistochemical staining sections for nanOg with different histologic scores (h-scores) (×200).
Notes: nanOg was primarily detected in the cytoplasm of adenocarcinoma and squamous cell carcinoma cells, and a few were detected inside the nucleus. (A) h-score
of 50; (B) h-score of 150; (C) h-score of 250.
Abbreviations: aDc, adenocarcinoma; sQcc, squamous cell carcinoma.
+VFRUH
$OOSDWLHQWV
$'& 64&&
Figure 2 Distribution of h-scores.
Notes: Median h-scores of all patients, patients with adenocarcinoma, and patients
with squamous cell carcinoma were 178.3, 167.1, and 189.4, respectively. Bars denote median and interquartile range.
Abbreviations: aDc, adenocarcinoma; sQcc, squamous cell carcinoma.
OncoTargets and Therapy downloaded from https://www.dovepress.com/ by 118.70.13.36 on 25-Aug-2020
Dovepress nanOg as an adverse predictive marker in advanced nsclc
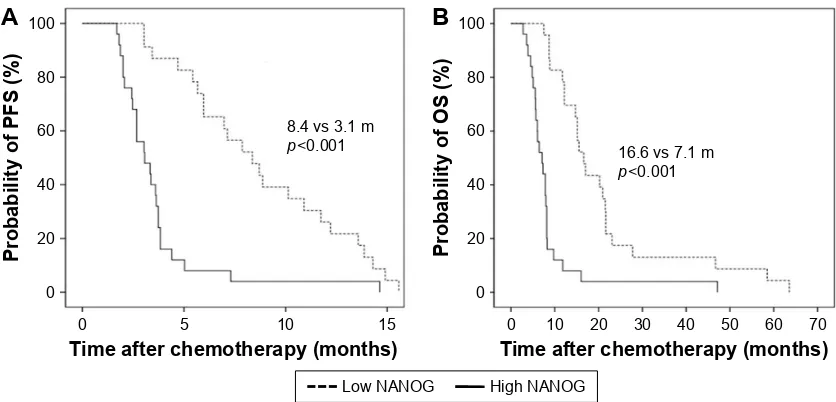
were significantly associated with shorter PFS (8.1 versus 3.6 months, p,0.001). In the multivariate analysis, advanced stage (hazard ratio [HR] =2.06, 95% CI: 1.23–3.48), squamous histology (HR =2.10, 95% CI: 1.31–3.37), and high NANOG levels (HR =3.09, 95% CI: 2.01–4.76) were significantly associated with shorter PFS. The Kaplan–Meier survival curves also showed that patients with high NANOG were likely to have shorter PFS (Figure 3A).
association between nanOg levels
and Os
The median OS for all study subjects was 12.8 months (95% CI: 8.9–15.8 months). Univariate analysis revealed that poor performance status and advanced stage were significantly associated with shorter OS. High NANOG levels were also significantly associated with shorter OS (16.5 versus
8.7 months, p,0.001). Multivariate analysis showed that old age (HR =1.18, 95% CI: 1.06–2.14), poor performance status (HR =2.42, 95% CI: 1.47–3.99), advanced stage (HR =1.84, 95% CI: 1.16–3.10), and high NANOG levels (HR =3.00, 95% CI: 1.98–4.54) were significantly associated with shorter OS. The Kaplan–Meier survival curves also showed that patients with high NANOG levels were likely to have shorter OS (Figure 3B).
subgroup analyses according to tumor
histology
We further performed survival analyses according to histo-pathological subtypes. In patients with adenocarcinoma, the median PFS was 7.7 months (95% CI: 4.5–11.2 months). Male gender, advanced stage, and high levels of NANOG were significantly associated with shorter PFS in univariate
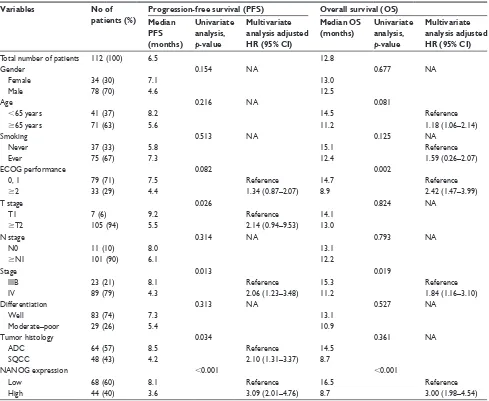
Table 2 survival analyses results according to clinical parameters in all study subjects
Variables No of
patients (%)
Progression-free survival (PFS) Overall survival (OS)
Median PFS (months)
Univariate analysis,
p-value
Multivariate analysis adjusted HR (95% CI)
Median OS (months)
Univariate analysis,
p-value
Multivariate analysis adjusted HR (95% CI)
Total number of patients 112 (100) 6.5 12.8
gender 0.154 na 0.677 na
Female 34 (30) 7.1 13.0
Male 78 (70) 4.6 12.5
age 0.216 na 0.081
,65 years 41 (37) 8.2 14.5 reference
$65 years 71 (63) 5.6 11.2 1.18 (1.06–2.14)
smoking 0.513 na 0.125 na
never 37 (33) 5.8 15.1 reference
ever 75 (67) 7.3 12.4 1.59 (0.26–2.07)
ecOg performance 0.082 0.002
0, 1 79 (71) 7.5 reference 14.7 reference
$2 33 (29) 4.4 1.34 (0.87–2.07) 8.9 2.42 (1.47–3.99)
T stage 0.026 0.824 na
T1 7 (6) 9.2 reference 14.1
$T2 105 (94) 5.5 2.14 (0.94–9.53) 13.0
n stage 0.314 na 0.793 na
n0 11 (10) 8.0 13.1
$n1 101 (90) 6.1 12.2
stage 0.013 0.019
iiiB 23 (21) 8.1 reference 15.3 reference
iV 89 (79) 4.3 2.06 (1.23–3.48) 11.2 1.84 (1.16–3.10)
Differentiation 0.313 na 0.527 na
Well 83 (74) 7.3 13.1
Moderate–poor 29 (26) 5.4 10.9
Tumor histology 0.034 0.361 na
aDc 64 (57) 8.5 reference 14.5
sQcc 48 (43) 4.2 2.10 (1.31–3.37) 8.7
nanOg expression ,0.001 ,0.001
low 68 (60) 8.1 reference 16.5 reference
high 44 (40) 3.6 3.09 (2.01–4.76) 8.7 3.00 (1.98–4.54)
Abbreviations: ecOg, eastern cooperative Oncology group; n, lymph node; T, tumor; aDc, adenocarcinoma; na, not analyzed; sQcc, squamous cell carcinoma.
OncoTargets and Therapy downloaded from https://www.dovepress.com/ by 118.70.13.36 on 25-Aug-2020
Dovepress
chang et al
analysis. Multivariate analysis showed that high levels of NANOG were associated with shorter PFS (HR =2.53, 95% CI: 1.35–4.75). In terms of OS, the median survival was 14.6 months (95% CI: 11.5–17.8 months). Old age, poor performance, advanced stage, and high NANOG levels were significantly associated with shorter OS in univariate analysis. In the multivariate analysis, poor per-formance (HR =2.75, 95% CI: 1.47–5.13), advanced stage (HR =1.78, 95% CI: 1.16–3.79), and high NANOG expres-sion (HR =3.04, 95% CI: 1.56–5.93) were significantly associated with shorter OS.
In patients with squamous cell carcinoma, the median PFS was 5.4 months (95% CI: 2.6–7.0 months). Advanced
stage and high levels of NANOG were associated with shorter PFS in univariate analysis. In multivariate analysis, high NANOG levels were significantly associated with shorter PFS (HR =3.76, 95% CI: 2.39–9.48). In terms of OS, the median survival was 9.8 months (95% CI: 6.9–12.5 months). Poor performance and high NANOG levels were associ-ated with shorter OS in univariate analysis. In multivariate analysis, poor performance (HR =1.62, 95% CI: 1.11–2.27) and high NANOG levels (HR =3.64, 95% CI: 2.20–8.14) were significantly associated with shorter OS. The Kaplan– Meier survival curves also showed that patients with high NANOG levels were likely to have shorter PFS and OS in both the histological subtypes (Figures 4 and 5).
%
$
7LPHDIWHUFKHPRWKHUDS\PRQWKV
3UREDELOLW\RI3)6
YVP
S
3UREDELOLW\RI26
7LPHDIWHUFKHPRWKHUDS\PRQWKV
YVP
S
+LJK1$12* /RZ1$12*
Figure 3 Kaplan–Meier survival curves for progression-free survival (A) and overall survival (B) in all patients. p-values were determined using the log-rank test.
Abbreviations: Os, overall survival; PFs, progression-free survival.
B
A
Time after chemotherapy (months)
Probability of PFS (%
)
0 0 20 40 60 80 100
8.8 vs 4.6 m
p=0.039
5 10 15 20 25
Probability of OS (%
)
Time after chemotherapy (months)
0 0 20 40 60
17.2 vs 11.7 m
p=0.01 80
100
10 20 30 40
High NANOG Low NANOG
Figure 4 Kaplan–Meier survival curves for progression-free survival (A) and overall survival (B) in patients with adenocarcinoma. p-values were determined using the
log-rank test.
Abbreviations: Os, overall survival; PFs, progression-free survival.
OncoTargets and Therapy downloaded from https://www.dovepress.com/ by 118.70.13.36 on 25-Aug-2020
Dovepress nanOg as an adverse predictive marker in advanced nsclc
Discussion
The current data demonstrate that NANOG overexpression is significantly associated with poor PFS and OS in patients with advanced NSCLC who received platinum-based chemo-therapy as the first-line treatment. Subgroup analysis shows that the results are similar regardless of the histological subtypes. To the best of our knowledge, this is the first study demonstrating the association between NANOG expression and clinical outcomes of patients with NSCLC who were treated with platinum-based chemotherapy, which implicates its clinical usefulness as a potential predictive marker.
Functional studies have shown that NANOG plays a pivotal role in the steps of cancer development and pro-gression including clonogenic growth, tumorigenicity, and invasiveness.16–18 In addition, overexpression of NANOG
is associated with tumor metastasis via enhancement of epithelial mesenchymal transition in lung cancer cells.19
Importantly, studies suggested that NANOG might be associ-ated with chemoresistance in lung cancer. Liu et al showed that platinum treatment induced an increase in the number of lung cancer cells expressing stem cell markers such as NANOG.20 Moreover, Barr et al reported that increased
expression of NANOG along with other stem-cell regulators was associated with cisplatin resistance in lung cancer cells.21
Our results support those findings.
NANOG seems to be involved in immunomodulation which is an important mechanism of cancer development and resistance to treatment.22 Noh et al demonstrated that
NANOG enhances the stem-like features of tumor cells and protected them from the immune surveillance system.23
In addition, Hasmim et al reported that hypoxia-induced NANOG is involved in the intratumoral infiltration of regulatory T cells and macrophages in part by modulating transforming growth factor-β1 production.24 Those suggest
that NANOG might be involved in the immune escape mechanism of tumors and that high NANOG levels could be associated with poor response to treatment using immune checkpoint inhibitors. Taken together, our data and the findings regarding the immunomodulating effect of NANOG may provide a foundation for future studies investigating the clinical usefulness of NANOG as a novel predictive marker in other clinical settings such as immuno-oncology.
In the present study, we found that NANOG levels did not differ between adenocarcinoma and squamous cell carcinoma. In addition, the association between NANOG expression and clinical outcomes was similar regardless of tumor histology. Of note, a previous study reported that lung adenocarcinoma was more associated with certain stem-like signatures compared to squamous cell carcinoma.25 In addition, Park
et al investigated the prognostic significance of several stem cell markers in early staged NSCLC and reported that NANOG overexpression was an independent factor associated with a poor prognosis in adenocarcinoma while it had no prognostic value in squamous cell carcinoma.9 While
we cannot exactly explain this discrepancy, we cautiously assume that the role or extent of NANOG’s contribution in the treatment resistance of advanced lung cancer may be different from that in tumor progression of early staged disease. Consistent positive association between NANOG and chemoresistance in different tumor cells including breast,
%
$
7LPHDIWHUFKHPRWKHUDS\PRQWKV
3UREDELOLW\RI3)6
YVP
S
3UREDELOLW\RI26
7LPHDIWHUFKHPRWKHUDS\PRQWKV
YVP
S
+LJK1$12* /RZ1$12*
Figure 5 Kaplan–Meier survival curves for progression-free survival (A) and overall survival (B) in patients with squamous cell carcinoma. p-values were determined using
the log-rank test.
Abbreviations: Os, overall survival; PFs, progression-free survival.
OncoTargets and Therapy downloaded from https://www.dovepress.com/ by 118.70.13.36 on 25-Aug-2020
Dovepress
chang et al
pancreatic, ovarian, and head and neck cancer cells may support our hypothesis of universal role of NANOG in the treatment resistance regardless of histologic subtypes.13,26–28
Further experiments are required to understand the differ-ences in the clinical implications of NANOG in different cell types of lung cancer.
There are several limitations in this study. First, this study was performed retrospectively and included a relatively small sample size. Second, for the quantification of NANOG levels, we used IHC staining, which may be less sensitive than other methods. Although previous studies quantified NANOG protein or mRNA levels,8–10 a standard method of
quantification for NANOG expression has not been estab-lished. Third, EGFR mutation data were available in only a small proportion of the subjects. As a result, information regarding the association between EGFR status and NANOG expression could be limited. Further studies are required to investigate the possible role of NANOG in patients harboring driving mutations.
Conclusion
In conclusion, we have shown that NANOG may be an adverse predictive marker in NSCLC patients who were treated with platinum-based chemotherapy. Further large-scale prospective studies involving patients without driving mutations treated with chemotherapy and using various quantification methods would provide more practical data. In addition, our results prompt the evaluation of this stem-cell regulator as a novel biomarker in different clinical settings, including molecular targeted therapy and immunotherapy, which would contribute a customized approach.
Acknowledgment
This work was supported by a grant from Kyung Hee University in 2016 (KHU-20160540).
Disclosure
The authors report no conflicts of interest in this work.
References
1. Siegel RL, Miller KD, Jemal A. Cancer statistics, 2015. CA Cancer J
Clin.2015;65(1):5–29.
2. Miller VA, Riely GJ, Zakowski MF, et al. Molecular characteristics of bronchioloalveolar carcinoma and adenocarcinoma,
bronchioloal-veolar carcinoma subtype, predict response to erlotinib. J Clin Oncol.
2008;26(9):1472–1478.
3. Roberts PJ, Stinchcombe TE. KRAS mutation: should we test for it, and
does it matter? J Clin Oncol.2013;31(8):1112–1121.
4. Cobo M, Isla D, Massuti B, et al. Customizing cisplatin based on quantitative excision repair cross-complementing 1 mRNA expression:
a phase III trial in non-small-cell lung cancer. J Clin Oncol.2007;25(19):
2747–2754.
5. Sodja E, Rijavec M, Koren A, Sadikov A, Korošec P, Cufer T. The prognostic value of whole blood SOX2, NANOG and OCT4 mRNA
expression in advanced small-cell lung cancer. Radiol Oncol.2016;
50(2):188–196.
6. Suresh R, Ali S, Ahmad A, Philip PA, Sarkar FH. The role of cancer
stem cells in recurrent and drug-resistant lung cancer. Adv Exp Med
Biol.2016;890:57–74.
7. Jeter CR, Yang T, Wang J, Chao HP, Tang DG. Concise review: NANOG in cancer stem cells and tumor development: an update and
outstanding questions. Stem Cells.2015;33(8):2381–2390.
8. Li XQ, Yang XL, Zhang G, et al. Nuclear beta-catenin accumulation is associated with increased expression of Nanog protein and predicts
poor prognosis of non-small cell lung cancer. J Transl Med.2013;
11:114.
9. Park E, Park SY, Sun PL, et al. Prognostic significance of stem cell-related marker expression and its correlation with histologic subtypes
in lung adenocarcinoma. Oncotarget.2016;7(27):42502–42512.
10. Du Y, Ma C, Wang Z, Liu Z, Liu H, Wang T. Nanog, a novel
prognostic marker for lung cancer. Surg Oncol.2013;22(4):224–229.
11. Yin X, Li YW, Zhang BH, et al. Coexpression of stemness factors
Oct4 and Nanog predict liver resection. Ann Surg Oncol.2012;19(9):
2877–2887.
12. Meng HM, Zheng P, Wang XY, et al. Over-expression of Nanog predicts tumor progression and poor prognosis in colorectal cancer. Cancer Biol Ther.2010;9(4):295–302.
13. Lu Y, Zhu H, Shan H, et al. Knockdown of Oct4 and Nanog expression
inhibits the stemness of pancreatic cancer cells. Cancer Lett.2013;
340(1):113–123.
14. Goldstraw P. The 7th edition of TNM in lung cancer: what now? J Thorac Oncol.2009;4(6):671–673.
15. Eisenhauer EA, Therasse P, Bogaerts J, et al. New response evalua-tion criteria in solid tumours: revised RECIST guideline (version 1.1). Eur J Cancer.2009;45(2):228–247.
16. Liu Y, Clem B, Zuba-Surma EK, et al. Mouse fibroblasts lacking RB1 function form spheres and undergo reprogramming to a cancer stem
cell phenotype. Cell Stem Cell.2009;4(4):336–347.
17. Lin YL, Han ZB, Xiong FY, et al. Malignant transformation of 293 cells
induced by ectopic expression of human Nanog. Mol Cell Biochem.
2011;351(1–2):109–116.
18. Ji W, Jiang Z. Effect of shRNA-mediated inhibition of Nanog gene
expression on the behavior of human gastric cancer cells. Oncol Lett.
2013;6(2):367–374.
19. Chiou SH, Wang ML, Chou YT, et al. Coexpression of Oct4 and Nanog enhances malignancy in lung adenocarcinoma by inducing cancer stem cell-like properties and epithelial-mesenchymal transdifferentiation. Cancer Res.2010;70(24):10433–10444.
20. Liu YP, Yang CJ, Huang MS, et al. Cisplatin selects for
multidrug-resistant CD133+ cells in lung adenocarcinoma by activating Notch
signaling. Cancer Res.2013;73(1):406–416.
21. Barr MP, Gray SG, Hoffmann AC, et al. Generation and characterisation of cisplatin-resistant non-small cell lung cancer cell lines displaying a
stem-like signature. PLoS One.2013;8(1):e54193.
22. Smyth MJ, Dunn GP, Schreiber RD. Cancer immunosurveillance and immunoediting: the roles of immunity in suppressing tumor
develop-ment and shaping tumor immunogenicity. Adv Immunol.2006;90:
1–50.
23. Noh KH, Lee YH, Jeon JH, et al. Cancer vaccination drives Nanog-dependent evolution of tumor cells toward an immune-resistant and
stem-like phenotype. Cancer Res.2012;72(7):1717–1727.
24. Hasmim M, Noman MZ, Messai Y, et al. Cutting edge: Hypoxia-induced Nanog favors the intratumoral infiltration of regulatory T cells and
macrophages via direct regulation of TGF-beta1. J Immunol.2013;
191(12):5802–5806.
25. Hassan KA, Chen G, Kalemkerian GP, Wicha MS, Beer DG. An embryonic stem cell-like signature identifies poorly differentiated lung
adenocarcinoma but not squamous cell carcinoma. Clin Cancer Res.
2009;15(20):6386–6390.
OncoTargets and Therapy downloaded from https://www.dovepress.com/ by 118.70.13.36 on 25-Aug-2020
OncoTargets and Therapy
Publish your work in this journal
Submit your manuscript here: http://www.dovepress.com/oncotargets-and-therapy-journal
OncoTargets and Therapy is an international, peer-reviewed, open access journal focusing on the pathological basis of all cancers, potential targets for therapy and treatment protocols employed to improve the management of cancer patients. The journal also focuses on the impact of management programs and new therapeutic agents and protocols on
patient perspectives such as quality of life, adherence and satisfaction. The manuscript management system is completely online and includes a very quick and fair peer-review system, which is all easy to use. Visit http://www.dovepress.com/testimonials.php to read real quotes from published authors.
Dovepress
Dove
press
nanOg as an adverse predictive marker in advanced nsclc
26. Fu TY, Hsieh IC, Cheng JT, et al. Association of OCT4, SOX2, and NANOG expression with oral squamous cell carcinoma progression. J Oral Pathol Med.2016;45(2):89–95.
27. Wiechert A, Saygin C, Thiagarajan PS, et al. Cisplatin induces stemness
in ovarian cancer. Oncotarget.2016;7(21):30511–30522.
28. Bourguignon LY, Peyrollier K, Xia W, Gilad E. Hyaluronan-CD44 interaction activates stem cell marker Nanog, Stat-3-mediated MDR1 gene expression, and ankyrin-regulated multidrug efflux in breast and
ovarian tumor cells. J Biol Chem.2008;283(25):17635–17651.
OncoTargets and Therapy downloaded from https://www.dovepress.com/ by 118.70.13.36 on 25-Aug-2020