AN ANALYTICAL STUDY ON MOBILE INTERNET USAGE ON CELL PHONES IN NAGPUR
Prof. Saranbir Uppal Asst. Professor
Tirpude Institute of Management Education, Nagpur
Dr. Rakhi Sharma Asst. Professor
Tirpude Institute of Management Education, Nagpur
ABSTRACT
The advent of smart phones has revolutionized the internet accessibility and its usage. Data packs are available on mobile phones to facilitate use of internet on the move and these data packs are available in prepaid and post paid forms. Mobile internet is consumed in different pattern by each individual using cell phone & time spent on different applications also varies from person to person.
This paper aims to analyse the attitude of mobile internet users, taking into account the use of mobile internet by pre paid or post paid customers. The analysis was centred around the idea that different applications are used by different users based on their own needs and convenience. Usage pattern & frequency of use is a matter of personal choice. The paper highlights applications that are most frequently used by the customers, thereby resulting in consuming majority of the data chunk and rating the importance of these applications based on their data usability. The attitudes, usage patterns and behaviour governing data pack users are, hence, of much importance to handset manufacturers and also to cellular service providers.
Sample was drawn from 436 respondents of Nagpur and the respondent profile was based on age, gender and profession. A structured questionnaire was administered to record and study the perceptions of respondents on data pack usage, the different applications they use and the duration of usage of such applications. Data was analysed using simple tools like percentages, means, etc and are depicted in the form of charts and graphs. Major findings include difference in data usage among genders, variation in use of applications across different age groups, time spent by various groups of respondents on different applications through mobile internet data and many more.
Keywords: Application, Data pack, Internet, Post paid, Pre paid.
INTRODUCTION
The present study has been undertaken to assess the attitude of Mobile internet users, taking into account the use of Mobile internet by pre paid or post paid customers. Mobile internet has emerged as a formidable social and cultural institution of global proportions facilitating access to a wealth of information on the web for the academic society to support their academic and research activities. The use of Information Technology helps increase the research productivity of scholars.
Indian telecom industry has seen exponential growth in the recent years. With steady increase in purchasing power of the Indian middle class, the mobile phone market is also rapidly expanding-both for handset manufacturers as well as cellular connection providers. Cell phone usage is no more limited to phone calls and messages. The use of cell phone has become wider with usage of mobile internet via cell phones.
The mobile internet is consumed in different pattern by each individual using cell phone & varied time spent on different applications. Mobile internet has become a global source of information resources accessible at anytime by anyone from anywhere in the world. It has converted the whole world into a global information society. It has tremendously improved communication and interaction among scientific research community and enabled them to access a vast range of latest information. It acts as a powerful supplement to the traditional way of information access. It facilitates electronic and exchange of ideas and collaboration among the users all over the world.
There is variable mobile internet usage patterns by pre paid and post paid customers based on their personal choices with different MB of mobile internet varying greatly at different age groups. We divided our audience as per their age group, gender & Income level to access the usage of different age people.
RATIONALE OF THE STUDY
The rationale of the study is focused upon the mobile internet usage through cell phones by different age groups people with a furthere analysis towards the type of connection which they use as pre paid or post paid.
The mobile internet usage has wide variance in usage pattern based on age of the user, gender and type of profession. The analysis was centred around the idea that different applications are used by different users based on their own choice and needs. Usage patteren & frequency of usage pattern had a huge difference due to personal choices a particualar person and need based requirements which varied from each individual to another individual.
The consumption of mobile internet of cell phones tends to be highly centred around specific applications. The paper highlights the applications that are most frequently visited by the customers thereby resulting in consuming majority of the data chunk and rating the importance of these applications based on their data usability.
OBJECTIVES
1. To find out the usage of mobile internet by different age groups.
2. To find out the variation in mobile data usage pattern between male and female customers. 3. To study the variation in consumption of mobile internet by customers using pre paid and post
4. To study the usage pattern of mobile internet based on the cellular data consumption by various mobile applications such as WhatsApp, face book, surfing, social networking, gaming, entertainment etc.
RESEARCH METHODOLOGY
Sample frame: Nagpur city
Sample size: 436
Survey description and respondent profile: Sample drawn for this research included respondents belonging to different age groups, gender, professions & variable income levels. Sampling unit consisted of educated, male and female individuals of Nagpur, who may be earning or not. Doctors, fashion designers, chartered accountants, senior citizen, private sector employees, housewives, students, Government servants, businessmen and other professionals are the categories from which sample was drawn.
Data was gathered using a questionnaire that recorded responses about the mobile data usage pattern, the different applications they use and the duration of usage of such applications by the respondents. Questions were designed to record the opinion of respondents’ data usage on their cell phones on various applications, type of connection (post paid/prepaid) and utility of mobile internet.
DATA ANALYSIS & INTERPRETATION
1. Analysis of variation in mobile internet usage based on the type of connection.
FIGURE 1
From the above study it can be inferred that the mobile data usage varies depending on the type of connection in different age groups. Maximum mobile internet usage is observed in the prepaid connection category for the age group 16-20 whereas for the same age group the mobile internet usage is minimum in the post paid connection category.
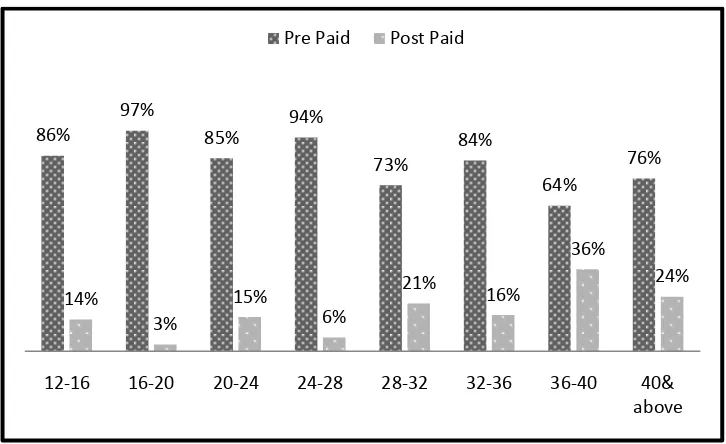
2. Gender wise analysis of variation in mobile internet usage based on the type of connection.
FIGURE 2
From the above study it can be inferred that the mobile data usage varies tremendously depending on the gender of the consumer. Maximum mobile internet usage is observed in the male category for prepaid connections.
86%
97%
85% 94%
73%
84%
64%
76%
14%
3%
15%
6%
21%
16%
36%
24%
12-16 16-20 20-24 24-28 28-32 32-36 36-40 40& above Pre Paid Post Paid
88% 81%
12% 13%
Male Female
3. Analysis of different sources of internet for cell phones by different age group people.
FIGURE 3
From the above study it could be interpreted that 22% of data is used through mobile internet facility for the age group of 20-24 & 1% from college and others cell phones.
4. Gender wise analysis of different sources of internet for cell phones.
FIGURE 4
From the above study it could be observed that gender wise Male uses 53% data through data pack facility and 10% from other cell phones & Female uses 23% data through data pack facility and 4% from college and others cell phones.
18%
12%
6%
3% 3%
6%
8%
5%
2% 3%
8%
7%
1% 1%
0% 22%
15%
9%
5%
4% 6%
5%
1% 1%
0% 8%
6%
1%
0% 0%
20-24 24-28 28-32 32-36 36-40
Wi Fi Office Data pack Hot Spot
Data pack on cell phones From others cell phone College
35%
24%
16%
53%
10% 12%
16%
7% 6%
22%
4% 4%
Wi Fi Office Data pack
Hot Spot Data pack on cell phones
From others cell phone
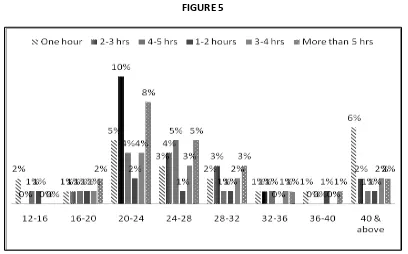
5. Analysis on frequency of data usage on mobile phones during a day.
FIGURE 5
From the above study it could be observed that frequency of data usage on mobile phones during a day is maximum in the age group of 20-24 and lowest frequency is studied in the age group of 30-36.
6. Gender wise analysis on frequency of data usage on mobile phones during a day
FIGURE 6
7. Age wise analysis of usage of various applications through mobile internet.
FIGURE NO 7
As per the study it was observed that the instant messaging application was the most preferred mobile application using mobile internet by the respondents in the age group of 20-24. It was also observed that there was a gradual decrease in the usage of application with increasing age group.
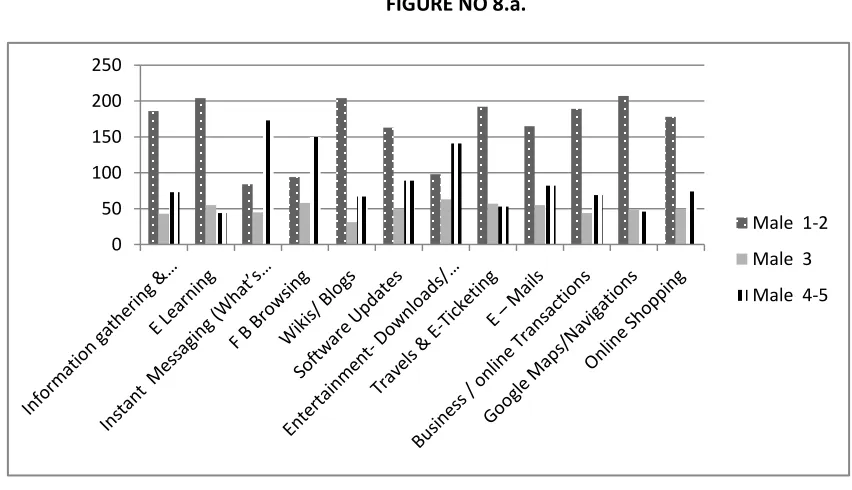
8. Gender wise analysis of Mobile data consumption by different applications during a day
a. Mobile Data usage pattern for Male Category
FIGURE NO 8.a. 19%
15%
10%
15%
5%
9%
5% 5% 6%
12% 11%
6%
9%
4% 6% 6% 4% 6%
7% 6%
4% 6%
2% 3% 3% 2% 3%
3% 2% 2% 3%
1% 0% 0% 0% 1%
20-24 24-28 28-32 32-36
0 50 100 150 200 250
Male 1-2
Male 3
From the above study it could be interpreted that males spend more time in Instant Messaging (WhatsApp, FB, Viber), Business / online Transactions, Emails as 13 % & minimum on software updates as 7%.
b. Mobile Data usage pattern for Female Category
FIGURE 8.b.
From above study it could be interpreted that females spend more in time Instant Messaging (WhatsApp, FB Viber) .
9. Profession wise analyis on data spent during each day:
FIGURE 9
It can be stated that people with private jobs spend about 18 % time on Instant Messaging (WhatsApp, FB, Viber), people with Government jobs spend 2% on e-mails & 8% on FB browsing,
0 20 40 60 80 100 120 140
Female 1-2
Female 3
Female 4-5
0 0.05 0.1 0.15 0.2 0.25
Pvt
govt
Business
Housewives
housewives spend 2% time on Instant Messaging & FB browsing, whereas students spend their maximum time (21%) on Instant Messaging in a single day.
10. Duration based age-wise usage of data pack for various mobile internet applications, per day:
FIGURE 10
Some specific age groups were only considered for this analysis. The graph also shows that people in age group of 20-24 spend 8% time in Instant Messaging (WhatsApp, FB, and Viber) & least in Software Updates. This age group is closely followed by 24-28 years age group. Respondents from the age group 32-36 years were found to spend the least time, i.e. only 1% in instant messaging and FaceBook browsing.
11. Gender based, age-wise usage of data pack for various mobile internet applications, per day:
Striking differences emerge when gender based use of data pack for internet applications is analysed (please see Figures 11-A and 11-B in Annexure). 14% & 15% of male respondents spend more than 4 hours daily on instant messaging and Facebook browsing respectively, whereas only 6% and 2% female respondents were found to do this. This difference in gender based usage further increased when analysed for durations of lesser time on various applications – males spend 33% time on information gathering, 32% on e-learning, 33% on Wikipedia/blogs, 27% on software updates, 45% on online/business transaction and 46% time on Google maps/navigation for less than 1 hour duration. The corresponding figures (less than 1 hour) for female respondents were only 10%, 10%, 7%, 6%, 3% and 4% respectively. Similar differences exist in case of other applications like entertainment/music/videos and online shopping also. These figures are strikingly lower than that of their male counterparts, indicating that males are the major users of these applications.
12. Business professionals’ usage of data packs for various mobile internet applications, per day:
(Please see Table 12 in Annexure). From the table it can be noted that business people spend
2%
8%
7%
3% 3% 4%
1%
6% 6%
2% 3% 3%
0%0% 1%1% 1%1% 0%0% 0%0% 0%0%
0% 1% 2% 3% 4% 5% 6% 7% 8% 9%
time spent by business people for various time durations is quite less. This indicates that they generally spend less time on operating various internet based applications from their mobile phones.
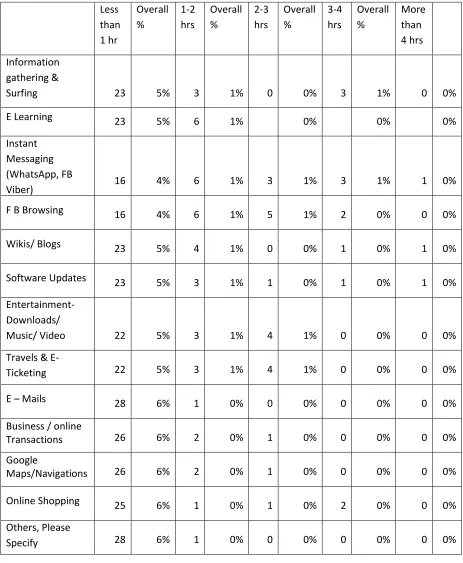
13. Housewives’ usage of data packs for various mobile internet applications, per day:
(Please see Table 13 in Annexure). Among users of various mobile data applications, housewives do not account for more than 6% for any of the applications, for time duration of up to 1 hour. For higher time durations the contribution of housewives to various applications is even lower and on many cases is even zero. This indicates that housewives are not good users of mobile data applications.
14. Students’ usage of data packs for various mobile internet applications, per day:
(Please see Table 13 in Annexure). The most popular time duration among students for mobile data application usage is ‘up to 1 hour’. 10% to 32% of students use almost all applications available on mobile data internet. These figures, however, diminish with increasing time durations.
FINDINGS:
1. Data pack in mobile phones is used from teens to adults, i.e. by all age groups. 2. Usage pattern is influenced by age, gender, occupation and the need of usage.
3. 96% of people in age group 16-20 years recharge their cell phones with pre paid connection and 36% in the age group 36-40years charge with post paid connection.
4. 22% respondents in the age group 20-24 years use data through data packs in cell phones and 1% from college and other sources.
5. Maximum usage (19%) was observed for instant messaging like WhatsApp, FB, Viber in age group 20-24 years and minimum usage (1%) was found in ‘Travel & E-ticketing’ for age group 32-46 years.
6. There are significant differences in usage patterns of data packs on mobile phones between two genders (male & female). E.g. more than 140 males use mobile data pack regularly for Facebook, entertainment/downloads & instant messaging applications, but none of the applications is used by more than 100 female respondents.
7. Profession is found to influence the data usage pattern on cell phones. It was observed that frequency of data usage in a single day is more (7% for more than 5 hours) for private sector employees and businessmen as compared to government employees (2% for only more than 1 hour). Students spend the highest time on mobile internet applications among respondents from other professions.
8. Male respondents use all the mobile data applications much more than their female counterparts. All applications are used by at least 13% male respondents (13% to 46%) for duration of less than 1 hour per day. But the same applications are used by less than 10% female respondents (3% to 10%).
9. Business people do not account for more than 8% of users of any of the mobile data applications, for any of the time durations studied.
11. Students are the major users of mobile data pack applications. Between 10% and 32% students spend up to 1 hour on all mobile applications, except for instant messaging.
LIMITATIONS
Even though huge efforts have been put in for an elaborate report there have been some constrains and limitations for the same, which are as follows:
Perception / Opinion of the respondent were based on his/ her own experience, but may be influenced by external factors like media and opinion of other people.
Some respondent were reluctant in answering some questions and thus a few blanks appear for such responses, which could not be considered for analysis.
Oral feedback given by the respondents could not be compiled in the report.
CONCLUSION & SUGGESTIONS
From the above analysis it is concluded that the mobile internet usage and the type of connection differs with varying age groups. Also there is a variation in the usage pattern of each application by various mobile internet users. The study analyses considerable difference in usage pattern by different customers of various application available on cell phones.
The usage pattern of each individual varies with respect to age, gender & occupation depending on their needs and requirements. Customers use the mobile internet with variable frequency in a single day. However there are some specific applications on which the time and mobile internet is consumed at a higher range such as E mails, Entertainment Downloads, Messaging, etc. which is again variable in age, gender and profession as need and requirements are different.
Through Age wise analysis it was concluded that in the age group of 24-28, 97% population prefers recharging their cell phones with prepaid connection while 36% population belonging to the age group of 36-40 prefers recharging their cell phones with post paid connection in the data recharge category.
Through Gender based analysis was also done that showed 59% of Male category recharge their cell phone with prepaid connection & 10% with post paid whereas 25% of Female category recharges their cell phone with prepaid connection & 6 % with post paid. Male used 53% data through data pack facility and 10% from other cell phones & Females uses 23% data through data pack facility and 4% from college and others cell phones
Frequency of data usage on mobile phones during a day in Male category is found to be more than 5 hrs and contributes 17% & for Female category it is 10% which contributes to one hour usage on data utility frequency in one day. Males spend more time in Instant Messaging (WhatsApp, FB Viber), Business / online Transactions, Emails as 13 % & minimum of software updates as 7%. Whereas females spend more in time instant Messaging (WhatsApp, FB Viber) as 16%.
The suggestions from the study emphasis that most of the mobile internet is spent on entertainment, media and downloads. Most of the customers do not realize this while downloading these applications or watching Youtube as most of the data gets consumed from the entire mobile internet. Downloads of all category videos, music , or even some data links & others of such type of entertainment applications are equally chargeable and are not free, hence these charges should be minimized as a privilege to the customers. The mobile applications related to music and entertainment and downloads options should be made available at minimum cost in the market or could be downloaded without any extra cost & must be more user friendly.
Some people also do repeated recharge due to faster usage of mobile internet which may or may not be economical for them, so it is suggested that the data should be sold at a price which is economical and with a higher MB capacity. It is also suggested that the mobile internet should be sold at a lower cost targeting the student’s category and giving them unlimited usage on some preferred applications of their choice that they can use from their mobile internet with higher frequency duration.
BIBLIOGRAPHY:
(Ghose, Vol 38, No.2)(Sheth, 2005)(Maidenhead. Mehrabian, 1974)(Jain Nimisha, 2015)(Krishnan, 2009)
Ghose, S. a. (Vol 38, No.2). Interactive Functions and their Impact on the Appeal of Internet Presence Sites. Journal of Advertising Research , 29-43.
Jain Nimisha, B. S. (2015). India@digital.bharat - Creating a $200 Billion Internet Economy. Mumbai: The Boston consulting Group.
Krishnan, M. (2009). 45 Million Internet Users in India. New Delhi: IAMAI.
Maidenhead. Mehrabian, A. a. (1974). An Approach to Environmental Psychology. The MIT Press.
ANNEXURE:
Figure 11-A: Male respondents’ data pack usage for applications
Figure 11-B: Female respondents’ data pack usage for applications 13% 15% 33% 27% 17% 31% 39% 45% 46% 39% 16% 13% 22% 13% 12%
10% 14% 9% 9% 11%
14%
10%
5%
18% 16% 21%
5% 7% 7% 8%
11% 14%
4% 6%
15%
3% 5% 4% 3% 6%
14% 15%
4% 4%
8%
2% 4% 3% 3% 4%
Less than1 hour 1-2 hour 2-3 hours 3-4 hours More than 4 hours
10% 10% 9% 9% 7% 6% 7% 5% 4% 3% 1% 3% 5% 5% 2% 8% 4% 2% 1% 3% 2% 1% 5% 5% 2% 1% 6% 2% 2% 1% 2% 2% 6%
2% 2% 2% 3%
1% 1%
Table 12: Business respondents’ data pack usage for applications
Less than1 hr
Overall %
1-2 hrs
Overall %
2-3 hours
Overall %
3-4 hours
Overall %
More than 4 hrs
Information gathering &
Surfing 30 7% 13 3% 3 1% 3 1% 2 0%
E Learning 34 8% 9 2% 7 2% 1 0% 0 0%
Instant Messaging (WhatsApp, FB
Viber) 9 2% 10 2% 11 3% 12 3% 9 2%
F B Browsing 14 3% 5 1% 10 2% 12 3% 10 2%
Wikis/ Blogs 31 7% 10 2% 5 1% 3 1% 2 0%
Software
Updates 23 5% 11 3% 12 3% 3 1% 2 0%
Entertainment- Downloads/
Music/ Video 17 4% 7 2% 11 3% 13 3% 3 1%
Travels &
E-Ticketing 28 6% 6 1% 13 3% 3 1% 1 0%
E – Mails 30 7% 6 1% 8 2% 5 1% 2 0%
Business / online
Transactions 28 6% 9 2% 8 2% 4 1% 2 0%
Maps/Navigation 34 8% 6 1% 7 2% 3 1% 1 0%
Online Shopping 32 7% 5 1% 7 2% 2 0% 5 1%
Table 13: Housewives’ data pack usage for applications
Less than 1 hr
Overall %
1-2 hrs
Overall %
2-3 hrs
Overall %
3-4 hrs
Overall %
More than 4 hrs
Information gathering &
Surfing 23 5% 3 1% 0 0% 3 1% 0 0%
E Learning 23 5% 6 1% 0% 0% 0%
Instant Messaging (WhatsApp, FB
Viber) 16 4% 6 1% 3 1% 3 1% 1 0%
F B Browsing 16 4% 6 1% 5 1% 2 0% 0 0%
Wikis/ Blogs 23 5% 4 1% 0 0% 1 0% 1 0%
Software Updates 23 5% 3 1% 1 0% 1 0% 1 0%
Entertainment- Downloads/
Music/ Video 22 5% 3 1% 4 1% 0 0% 0 0%
Travels &
E-Ticketing 22 5% 3 1% 4 1% 0 0% 0 0%
E – Mails 28 6% 1 0% 0 0% 0 0% 0 0%
Business / online
Transactions 26 6% 2 0% 1 0% 0 0% 0 0%
Maps/Navigations 26 6% 2 0% 1 0% 0 0% 0 0%
Online Shopping 25 6% 1 0% 1 0% 2 0% 0 0%
Others, Please
Table 14: Students’ data pack usage for applications
Less than 1 hr
Overall %
1-2 hrs
Overall %
2-3 hours
Overall %
3-4 hours
Overall %
More than 4 hrs
Information gathering &
Surfing 80 18% 69 16% 8 2% 10 2% 0
E Learning 74 17% 69 16% 19 4% 5 1% 0
Instant Messaging (What’s App, FB
Viber) 31 7% 49 11% 35 8% 21 5% 31
F B Browsing 44 10% 49 11% 23 5% 25 6% 26
Wikis/ Blogs 86 20% 53 12% 12 3% 8 2% 8
Software
Updates
62 14% 32 7% 47 11% 19 4% 7
Entertainment- Downloads/
Music/ Video 44 10% 34 8% 39 9% 33 8% 17
Travels &
E-Ticketing 86 20% 26 6% 47 11% 7 2% 1
E – Mails 103 24% 42 10% 13 3% 6 1% 3
Business / online
Transactions 126 29% 18 4% 13 3% 6 1% 4
Maps/Navigation 120 28% 25 6% 16 4% 4 1% 2
Online Shopping 105 24% 26 6% 18 4% 15 3% 3
Others, Please