IJEDR1402169
International Journal of Engineering Development and Research (www.ijedr.org)2346
Single Stage Grid Interactive Photovoltaic System
Darji Amit
P.G. student
Electrical Engineering department
Sarvajanik College of Engineering and Technology, Surat
amitdarji07@gmail.com
________________________________________________________________________________________________________
Abstract— Single-stage photovoltaic (PV) system is gaining popularity due to lower losses because of only one power
converter stage. A single-stage PV system supplies both active and reactive power during daytime and it compensates reactive power during night time or low insolation condition so PV system is utilized in a better way and overall efficiency of system increases. Modified incremental conductance algorithm for Maximum Power Point Tracking (MPPT) is taken for simulation. Reference currents are generated by instantaneous active and reactive power calculation. Hysteresis current controller (HCC) is used to generate switching pulses for inverter switches.
Index Terms— Photovoltaic, Active power, Reactive power, Maximum Power Point Tracking, Incremental Conductance.
________________________________________________________________________________________________________
I.INTRODUCTION
Volatility of fuel prices, increase in energy demand, global warming problems, pollution etc. are increasing dayby day so need is arise to shift towards alternate energy sources e.g. wind power, solar power etc. Advantages of energy generation using PV system are safe, clean, zero fuel cost, low running cost and zero pollution. Besides advantage mentioned, the PV panels are costly so a better utilization of PV array is necessary for its operation and operation around maximum power point (MPP) is desired. Single stage grid interactive photovoltaic (PV) system has lower losses compared to multi stage PV system [1]. Besides supplying active power single stage system also compensates for reactive power during daytime and during night it will continue to compensate for reactive power. Thus overall system efficiency increases and PV system is utilized in a better way [8].
In single stage system only an inverter (DC-AC converter) is there for supplying PV generated power into the grid. In two/multi stage system a DC-DC buck, boost or buck-boost converter is used for tracking MPP and at last stage an inverter is connected for integrating PV system with the grid. Due to more number of powers processing stages in two/multi stage system, the losses are more compared to single stage system and it is also costlier. The only limitation with the use of single stage system is that the number of PV panels is selected and arranged in such a way that the PV voltage is greater than the peak of grid voltage for power flow condition. A single stage system has only one number of power converter stage employing MPPT and reactive power control of load using the same inverter. Single stage system fulfills both purposes with reduces losses so utilization of system is done in a better and efficient manner. In this way inverter of single stage system supplies active and reactive power during day time and during low insolation or in cloudy weather it is utilized for reactive power compensation within its capacity [7].
A current source in parallel with a diode of suitable quality factor is used for modeling of PV cell. Effect of shunt resistance is neglected because of its higher value it acts as open circuit and no current flows through it [2]. With these assumptions the results obtained are quite satisfactory and acceptable.
There are many algorithms proposed [3] for MPPT e.g. Perturb & Observe (P&O), incremental conductance, fuzzy logic based MPPT, ripple based, open circuit voltage, short circuit current etc. Incremental conductance method gives fast response during changing environmental conditions compared to P&O algorithm. Modified incremental conductance algorithm is selected for further investigation work of single stage grid interactive PV system. This MPPT algorithm generated a ΔPref which will be added
to or subtracted from Pref [4].
IJEDR1402169
International Journal of Engineering Development and Research (www.ijedr.org)2347
II.SINGLESTAGESYSTEMANDINVERTERCONTROLSTRATEGYGrid Load
Abc to αβ transformation
Abc to αβ transformation
p= vsαiLα + vsβiLβ q= vsαiLβ - vsβiLα
p q Reference current generation Three Phase Voltage Source Inverter + _Vpv Ipv MPPT Controller Pref Hysteresis Current Controller PCC Switching Signals ILa ILb ILc Rsa Rsb Rsc Lsa Lsb Lsc Lfa Lfb Lfc PV Array Iinv,a Iinv,b Iinv,c Iref,a Iref,b Iref,c
Iα Iβ Vα Vβ
Vpv Iinv,a Iinv,b Iinv,c Ipv Pref
Fig.1 Single stage grid interactive PV system
A. PV array modeling
A PV model based on Shockley diode equations is given in figure 2. A current source in parallel with a diode, series and shunt resistance represents a PV cell.
Fig.2 PV array equivalent electrical circuit[2]
Equations that represents PV cell given in figure 2 are as following.
(1)
Here, ( ( ) ) (2)
IJEDR1402169
International Journal of Engineering Development and Research (www.ijedr.org)2348
Where, q = electronic charge = 1.6*10-19 Cη = diode ideality factor
k = Boltzmann constant = 1.38*10-23 m2kgs-2K-1 T = Temperature in kelvin
Iph =Photocurrent
I0 = Diode reverse saturation current
IPV = PV current
VPV = PV voltage
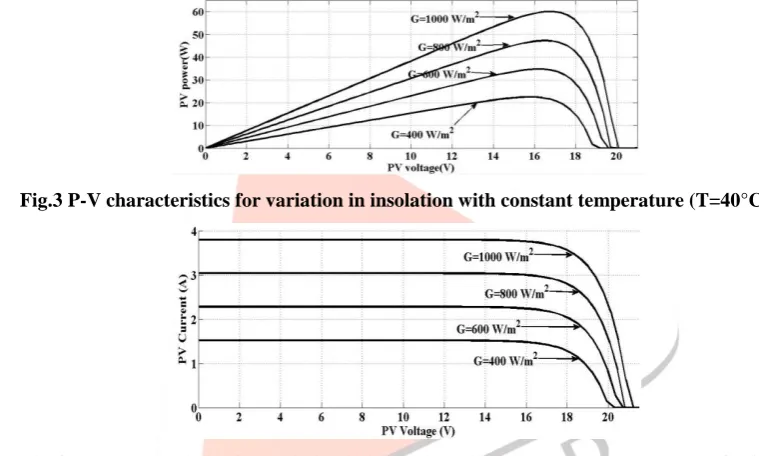
By changing various parameters i.e. temperature and insolation change can be seen in power and current of PV array. Using MATLAB/Simulink environment PV array modeling is done and effect of changing parameters can be seen in Figure 3 to Figure 6. Variation in insolation is shown in Figure 3 and Figure 4. With increase in insolation level there is an increase in PV current and power levels.
Fig.3 P-V characteristics for variation in insolation with constant temperature (T=40°C)
Fig.4 I-V characteristics for variation in insolation with constant temperature (T=40°C)
In Figure 5 and Figure 6 change in PV current and power is shown in which with reduction in temperature level the current reduces by small amount and voltage increases by large amount so with reduction in temperature, power increases as seen in Figure 5.
Fig.5 P-V characteristics for variation in temperature with constant insolation (G=1000 W/m2)
IJEDR1402169
International Journal of Engineering Development and Research (www.ijedr.org)2349
B. MPPT algorithm
Modified incremental conductance algorithm is based on differentiation of PV power and finding zero slope of curve. PV array characteristics are explained in Figure 3 to 6 from which it is evident that in changing environmental condition it is required to track MPP for extracting maximum power from PV array. Modified incremental conductance MPPT generates a ΔPref is generated
which is added or subtracted from Pref to generate current reference which will further generate switching signals to control output
power of inverter using HCC. A block diagram of modified incremental algorithm is shown in Figure 7. Start
Measure V(k) and I(k)
P(k)=V(k)*I(k) dV=V(k)-V(k-1) dI=I(k)-I(k-1) dP=P(k)-P(k-1) dV=0 Yes dI=0 Yes No dI>0 Yes
Increase Pref Reduce Pref dP/dV=0 No No dP/dV>0 Increase Pref No No Reduce Pref Yes Yes Update V(k-1),I(k-1) return
Fig.7 Modified incremental conductance algorithm
C. Reference current generation
p-q instantaneous active and reactive power theory is used to generate reference currents. Load currents and grid voltages are measured and converted from a-b-c to α-β coordinate system. These currents and voltages are used to further calculate q. Calculated q and power Pref is used to generate reference currents , and which will become input to the HCC for
generating switching pulses for inverter.
Equations for p-q reference current generation are given by,
[ ] = √ * √ √ + [ ] (4) * + = √ * √ √ + [ ] (5)
Instantaneous active and reactive power of the load is given by,
* + = *
+ [
] (6)
Reactive power supplied by inverter is given by,
(7)
This reference reactive power is reference reactive power (q*=q) and active power reference (P*=PPV) is generated from MPPT
block according to maximum power available at PV output terminal which is at maximum power point. The reference currents in α-β coordinate system is given by,
[ ]
=
*
IJEDR1402169
International Journal of Engineering Development and Research (www.ijedr.org)2350
Reference currents ( ) are generated by α-β to a-b-c transformation which is,*
+ = √
[
√
√ ]
[
] (9)
These reference generated currents are then compared with inverter currents to generate switching sequence for control of inverter switches. A HCC is used for comparing two currents.
D. Hysteresis Current Controller
HCC is used to compare two currents i.e. reference currents ( ) and inverter output currents ( )
are compared and switching sequence is generated.
The equation that govern the timing of switching according to logic, If + hb then S1is turned OFF and S4 is turned ON
If - hb then S1 is turned ON and S4 is turned OFF
Where, hb is hysteresis band, usually 5% of maximum current to be injected by inverter current.
E. Inverter
A simple three leg, six switch inverter serves both purpose of supplying active and reactive power. Switching signals for inverter are generated by HCC after calculating reference currents from p-q theory calculations. Inverter side voltage is always kept greater than peak grid voltage to supply reactive power to the grid. All the day inverter is connected to the grid for supplying active and reactive power and during night time also it will compensate for reactive power of the grid.
III.SIMULATION RESULTS
From block diagram given in Figure 1, a simulation system in MATLAB/Simulink environment is done for obtaining results. A PV system of 11.4 kW capacity is developed using 38 PV modules connected in series forming a string and 5 such strings connected in parallel. Different parameters for modeling single stage system are shown in Table 1 and table 2.
Table 1 PV array parameters
Parameter description Value
Open circuit voltage of single module (Voc) 21.0 V
Short circuit current of single module (Isc) 3.8 A
Module voltage at MPP (Vm) 17.1 V
Module current at MPP (Im) 3.5 A
Single module PV power at MPP (Pm) 60 W
Reference temperature 25 °C
Reference insolation (G) of 1 sun 1000 W/m2 No. of series connected module in series 38
No. of parallel connected PV strings 5 Table 2 Grid parameters
Parameter description Value
Grid peak voltage (VL-N) 360 V
Load voltage (VL-L) 440 V
Interfacing inductor 5 mH Capacitor 1000 uF Source inductance (Ls) 0.1 uH
IJEDR1402169
International Journal of Engineering Development and Research (www.ijedr.org)2351
(1) Performance of Maximum Power Point Tracking
A graph for tracked point under different insolation condition is shown in Figure 8. It can be seen that the operating point stays at MPP as far as there is no change in environmental condition. As the environmental condition varies which is simulated by applying step change in insolation, the algorithm shifts the operating point to a new MPP. Initially the system is kept operating under 1000 W/m2 insolation i.e. full solar irradiation. It is seen from Figure 8 by tracking curve -1; the algorithm keeps the system operating at point A corresponding to 1000W/m2. Then due to decrease in insolation from 1000W/m2 to 700W/m2, the algorithm shifts the operating point from A to point B bytracking curve -2. Further the insolation is reduced from 700 W/m2 to 0 and hence the algorithm shifts the operating point from B to point C. The insolation is again increased from 0 to 500 W/m2. The MPP algorithm shifts the operating point from C and tracking curve-3 shifts to point D. Then the insolation is further increased to 100 W/m2. The algorithm shifts the operating point from D to point A on curve-1. Thus it is verified that the PV system operates at MPP under varying insolation conditions.
Fig.8 MPP tracking graph for different insolation levels
Variation in PV array voltage, current and power due to step change in insolation while tracking MPP at constant load demand of 25 kW and 3 KVAR and at 40° C temperature is demonstrated in Figure 9.
It is seen that as the insolation is reduced from 1000W/m2 to 600 W/m2 at t= 1 s, the current reduces as seen in Figure 9(c) and hence the PV power also reduces as seen in Figure 9(d) with little decrease in PV voltage. At t=2.5, the insolation is reduced from 600W/m2 to 0. It is seen in Figure 9(c) that due to reduction in insolation, the PV current reduces to 0 and hence PV power also reduces to 0 as seen in Figure 9(d). It is noticed in Fig. 9(b) that the PV voltage is nearly maintained at the same level in order to provide reactive power compensation under zero insolation. Thus the modified incremental conductance MPPT algorithm is able to track MPP under varying insolation conditions that shows robust tracking performance in single stage grid interactive PV system.
Fig.9 PV array tracking parameters under varying insolation: (a)Insolation (W/m2) (b)Votage (V) (c)Current (A) (d)Power (W)
(2) Performance for active and reactive power control under varying insolation condition
Active power exchange between load, grid and inverter is shown in Figure 10 considering constant load power demand of 25KW and 4 KVAR and variable insolation.
IJEDR1402169
International Journal of Engineering Development and Research (www.ijedr.org)2352
It is seen from Figure that the PV power supplied by the inverter reduces at t=1 s due to reduction in insolation from 1000 W/m2 to 600 W/m2 and therefore power drawn from the grid increases in order to supply constant load power demand to maintain power balance. Grid power will further increase at t=2.5 s due to reduction in PV power caused by reduction in insolation from 600W/m2 to0. It is verified that the active power balance follows, Pload =Ppv + Pgrid under varying insolation condition.Fig.11 Reactive power sharing under varying insolation
Reactive power sharing between grid, load and inverter under varying insolation condition is shown in Figure 11. It can be seen from Figure 11 that nearly complete load reactive power demand is supplied by PV inverter without drawing any reactive power from the grid. Thus the reactive power balance follows, Qload = Qinv with Qgrid =0.
Fig.12 Current balance under varying insolation: (a)Grid current (A) (b)Inverter current(A) (c)Load current(A)
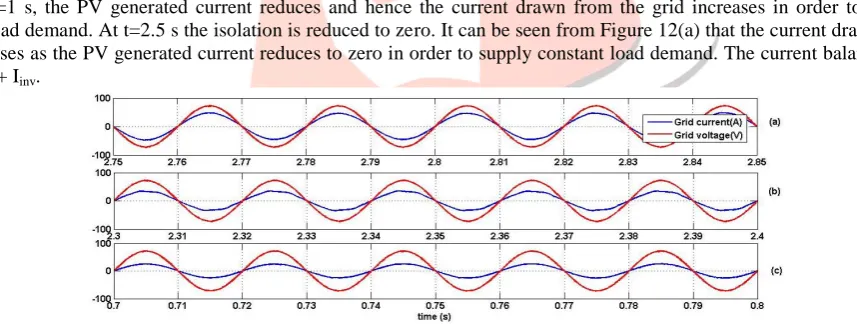
In Figure 12, the currents of the grid, inverter and the load are shown. Due to reduction in insolation from 1000 W/m2 to 600 W/m2 at t=1 s, the PV generated current reduces and hence the current drawn from the grid increases in order to supply the constant load demand. At t=2.5 s the isolation is reduced to zero. It can be seen from Figure 12(a) that the current drawn from the grid increases as the PV generated current reduces to zero in order to supply constant load demand. The current balance follo ws, Iload = Igrid + Iinv.
Fig.13 Grid current and voltage for different insolation level: (a)0 W/m2 (b)600 W/m2 (c) 1000 W/m2
It is evident that, the grid voltage and current of phase-a are in phase in all insolation conditions as shown in Figure 13 which shows almost full reactive power compensation of load by the PV inverter.
(3) Performance for active and reactive power control under varying load at constant insolation
In this case, the performance of the system is analyzed under varying load condition while keeping the insolation level constant at 1000 W/m2. The variation in load active and reactive power demand is specified in Table 3. The active and reactive power balance under varying load condition is shown in Figure 14 and Figure 15 respectively.
Table 3 Variation in load active and reactive power demand
Time (s) Active demand (kW) Reactive demand (kVAR)
0-2 25 3
2-3 35 4
IJEDR1402169
International Journal of Engineering Development and Research (www.ijedr.org)2353
It can be seen from Figure 14 that at t=3 s, the power drawn from the grid increases due to increase in load active power demand as the inverter supplies constant active power under constant solar insolation. Also at t=3.5 s the active power drawn from the grid reduces due to reduction in load with constant power supplied by the inverter. Thus it is verified that Pload =Ppv +Pgrid under varying load condition.
`
Fig.14 Active power sharing under varying load demand
It is evident from Figure 15 that nearly complete load reactive power demand is supplied by PV inverter without drawing any reactive power from the grid. Thus even under varying load condition the reactive power balance follows, Qload = Qinv with Qgrid
=0.
Fig.15 Reactive power sharing under varying load demand
The waveform of the phase-a current of the grid, inverter and load under fixed insolation of 1000 W/m2 and varying load condition as specified in Table 3 are shown in Figure 16. As the load power demand is increased at t=3 s, in order to supply increased load current as seen in Figure 16(c), the current drawn from the grid increases as shown in Figure 16(c). At t=3.5 s the current drawn from the grid reduces due to reduction in load demand. The current balance follows, Iload = Igrid + Iinv relation even
under varying load condition.
Fig.16 Current balance under varying load demand: (a)Grid current (A) (b)Inverter current(A) (c)Load current(A)
IJEDR1402169
International Journal of Engineering Development and Research (www.ijedr.org)2354
Fig.18 Grid voltage and current under reduction in load demandIt can be seen that the grid voltage is in phase with the grid current during rising and falling load demand from Figure 17 and Figure 18 respectively. This justifies full reactive power compensation under varying load.
(4) Performance for active and reactive power control Simultaneous change in both load and insolation
The extreme situation of load and insolation variation simultaneously i.e. reducing insolation with increasing load and increasing insolation with reducing load is simulated in this case in order to verify the robustness of the control strategy. Variation in load active and reactive power demand with simultaneous varying insolation is given in Table 4.
Table 4 simultaneous variation in insolation and load
Time (S) Insolation (W/m2) Load Active power demand (kW) Load Reactive power demand (kVAR)
0-3 1000 25 3
3-3.5 0 35 4
3.5-5 1000 25 3
The performance of active power balance amongst the load, PV inverter and the grid under simultaneous change in insolation and load as specified in Table 4 is shown in Figure 19. It is seen that as the load demand increases at t=3 s and the active power generated by PV array decrease due to reduction in insolation to zero, the power drawn from the grid increases in order to supply increased load demand .
At time 3.5 s, the insolation is increased from 0 to 1000 W/m2 and at the same instance the load demand is reduced. Therfore the power drawn from the grid reduces as seen from Figure 19. Thus it is verified that Pload =Ppv + Pgrid under simultaneously
varying load and insolation condition.
Fig.19 Active power sharing under simultaneously varying insolation and load condition
The reactive power balance under simultaneous change in both load and insolation as specified in Table 4 is shown in Figure 20. It can be noticed that the complete load reactive power demand is supplied by inverter. The reactive power drawn from the grid is zero as seen in Figure 20.
It can be remarkably noticed from Figure 20 that under zero insolation condition applied at t=3 s, the PV inverter is utilized for reactive power compensation without drawing any reactive power from grid. This increases the utilization of inverter specifically during night. Thus it is verified that Qload =Qinv with Qgrid=0 under simultaneous varying load and insolation condition.
Fig.20 Reactive power sharing under simultaneously varying insolation and load
IJEDR1402169
International Journal of Engineering Development and Research (www.ijedr.org)2355
At t=3 s, the insolation is reduced to zero and load is increased, hence the current drawn from the grid increases as seen in Figure 21(a) to supply the increased current demand of load as seen in Figure 21(c) due to reduced current supplied by PV inverter as seen in Figure 21(b).At t= 3.5 s the insolation is increased and the load demand is reduced as in Table 4. It is seen in Figure 21(a) that the current supplied by the grid reduces in order to supply decreased load current demand as seen from Figure 21(c) with the current supplied by PV inverter is increases as seen in Figure 21(b).
Thus even under worst case situation of simultaneous change in insolation and load, the current balance follows, Iload = Igrid +
Iinv.
Fig.21 Current balance under simultaneously varying insolation and load condition: (a) Grid current (A) (b) Inverter current (A) (c) Load current (A)
Fig.22 Grid voltage and current with increasing load and reducing insolation simultaneously
Fig.23 Grid voltage and current for reducing load and increasing insolation simultaneously
The grid current is in phase-a with the grid voltage is as seen from Figure 22 and Figure 23 under simultaneous change in load and insolation. It is verified that under steady state condition the current and voltage are in phase with each other justifying reactive power compensation..
IV.CONCLUSION
In this work, SIMULATION is done for single stage grid interactive PV system and performance of modified incremental conductance MPPT algorithm is analyzed under different conclusion. It is also evident that the purpose of reactive power compensation is fulfilled by PV inverter along with conventional task of injecting PV generated active power into the grid. ACKNOWLEDGMENT
IJEDR1402169
International Journal of Engineering Development and Research (www.ijedr.org)2356
REFERENCES[1] C. S. Solanki, “Solar Photovoltaics: Fundamentals, Technologies and Applications”, PHI learning, July 2011.
[2] G. Walker, “Evaluating MPPT Converter Topologies using a Matlab PV Model”, Journal of electrical and electronics engineering, Australia, vol. 21, pp. 49–55, 2001.
[3]
T. Esram and P. L. Chapman, "Comparison of Photovoltaic Array Maximum Power Point Tracking
Techniques", IEEE Transactions on Energy Conversion, vol. 22, no. 2, June 2007.
[4] W. Libo, Z. Zhengming and L. Jianzheng “A Single-Stage Three-Phase Grid-Connected Photovoltaic System With Modified MPPT Method and Reactive Power Compensation”, IEEE
Transactions on Energy Conversion
, vol. 22, no. 4, ,pp. 881-886, Dec. 2007.[5] H. Akagi, H. Watanabe and M. Arades, “Instantaneous Power Theory and Applications to Power Conditioning”, John Wiley & Sons, 2007.
[6] B. K. Bose, “Modern Power Electronics and AC Drives”, Pearson Education, 2004.
[7] G. Tsengenes, G. Adamidis, “Investigation of the behavior of a three phase grid-connected photovoltaic system to control active and reactive power”, Electric Power Systems Research, vol. 81, pp. 177–184, 2011.