1243
Factors That Influence Knowledge And
Understanding Of Fundamental And Technical
Analysis For The Wish Of Investment On Money
Market And Capital Market
Ade Fatma Lubis, Zainal A.T. Silangit, Mutia Ismail, Iskandar MudaAbstract: This research aims to discover the level of public understanding of the technical knowledge and fundamentals of the money market and capital market in North Sumatra. This research is conducted by surveying the primary data and identifying on the field directly to the prospective investors in the Money Market and Capital Market in North Sumatra. The test result indicates that the dominant factors influencing public knowledge of the analyzer is the experience factor; while the education factor, financial statement understanding, consultation quality, understanding of using technical application, have no significant influence on the effectiveness of educating the public on the technical analysis knowledge and fundamental in the capital market investment.
Keywords: Technical Analysis Knowledge, Fundamental Analysis, Money Market, Capital Market.
————————————————————
1. Introduction
Technical analysis is a method to predict the future price movements and market trends or securities by studying the graph of the past market action, by considering the instrument market price and the interest in such instrument. Technical analysis is one analysis or approach method that evaluates the movement of a stock price, future contract, index, and several other financial instruments (De Souza et al., 2018). Briefly, technical analysis can be state as a security analysis by using price chart and historical volume. The user of this technical analysis is commonly called a chartist. The user believes that a stock's market trends and action signals can be obtained based on certain shapes and patterns from the stock price chart. The other form of this analysis is the utilization of analyzer lines that is applied on the price chart according to each user’s individual opinion. Therefore the basis of transaction decision making is also usually determined based on the judgment and interpretation of the user on a chart. Considering its highly subjective character, this analysis then contains more art than the scientific element. Likewise, according to each user, this analysis is also specific for each security. This analyst group can be classified into price movement line analyzer and pattern analyzer. The user of this analysis is also commonly called as a technician. The user believes that the trend and market action signal of a stock can be obtained based on the chart pattern that are determined or indicated from quantitative calculation, not from subjective interpretations of a chart's shape and pattern. Considering its quantitative character, this method can be scientifically tested for its ability and performance in generating profits for the investors. Another benefit factor from this modern technical analysis is that the indicator can be programmed automatically using computer assistance.
In outline, those technical indicators can be grouped into trend following indicator and oscillator indicator. Technical analyst and chartits use a chart to analyze a large set of securities, and forecast the future price movements (Weng et al., 2018). The term of security refers to any financial instruments that can be exchanged or any quantifiable index such as stock, bond, commodity, futures or market index. A security with the price data more than one time period can be used to make a chart for an analysis (Avramov et al., 2018 and Lin, 2018). Exclusively, the chart is used by the technical analyst, whereas in fact the use of the chart is not only limited to the technical analysis. The chart represents the stock price movements over a certain period of time that is easy to read, which this is also a good benefit for the fundamental analysts. A chart of historical data will make it easier to cue the effect of an event key on the price of a security, which is displayed for more than one time period; either the transactions approach the highest, lowest, or in between them. A time period is used to form a chart that depends on the type of the data: intraday, daily, weekly, monthly, quarterly (4 months), or yearly (Lahmiri, 2018 and Myšková et al., 2018)). The more data is compressed, the longer the time period of the displayed data. If a daily chart can display 100 data points, then one weekly chart can display 100 weeks (almost 2 years). A daily chart that displays 100 days represents about 5 months of data. There are around 20 days of transactions in a month, and around 252 days of transactions in a year (Lubis, 2008). The choice of the compressive data and the time period depends on the data availability and each style. A trader usually concentrates on the daily chart and intraday data to predict the short-term price movements. The shorter the time period, and the less data is compressed, the more detail of the available data will be. Due to the more detail, then the short-term chart will be more volatile and more disturbances. The broad price movements, the wide range of high-low prices, and a price gap, can affect volatility which can distort the whole illustration. The investors usually focus on the weekly and monthly charts to mark the long-term trends and predict the price movements (Ahmadi et al., 2018). Because the long-term chart (1-4 years) describes the compressed data over
_____________________________
Ade Fatma Lubis, Zainal A.T. Silangit, Mutia Ismail, Iskandar Muda
1,2,3,4 Accounting Department, Faculty of Economics and Business, Universitas Sumatera Utara, Medan, Indonesia
1244
a longer period of time, the stock price movement does not look extreme and there is often a little interference. Other strategies can use a combination of a long-term and a short-term chart. The long-term chart is very good to use in analyzing a broad illustration to get a perspective from the historical data prices. When the general illustration can be analyzed, the daily chart can be used to see the last few months. Fundamental analysis uses fundamental data, which is the data derived from the company's finance (e.g., earning, paid dividend, sales, and so on), while technical analysis uses the market data from stock (e.g., price, and volume of stock transaction) to determine the value of share (Xu et al., 2018). The technical analysis is widely used by practitioners in determining stock prices while the fundamental analysis is widely used by academics. The fundamental analysis tries to calculate the intrinsic value of a stock by using the company's financial data, thus it is also called the company analysis. The question is: Does the general public understand such analysis? This research studies the factors that might be dominantly influence people's knowledge towards the analyzer. Are they the factors of: education? Financial statement understanding? Consultation quality? Understanding of using technical applications?
2. LITERATURE REVIEW
2.1. Stock Analysis and Evaluation
The values associated with the stock are book value, market value, and intrinsic value. Book value is the share value according to the bookkeeping of the issuer company. Market value is the share value in the stock market and the intrinsic value is the true value of the stock (Alhashel et al., 2018; Dieci et al., 2018; Sign et al., 2018). Understanding these three concepts of value is necessary and useful, because it can be used to find out which stocks are growth and which are undervalued. By knowing the book value and market value, the company growth can be found out. The growing company has a greater ratio than the one which means the market believes that the company's market value is greater than its book value. The two types of analysis used mostly to determine the stock’s true value are the fundamental security analysis or the company analysis and the technical analysis (Hui et al., 2018, Edward et al., 2018 and Xi et al., 2018). The fundamental analysis uses fundamental data, which is the data derived from the finance, while the technical analysis uses market data from stock (e.g., price and volume of stock transaction) to determine the share value. Technical analysis is widely used by practitioners in determining stock prices, while fundamental analysis is widely used by academics.
2.2. Framework
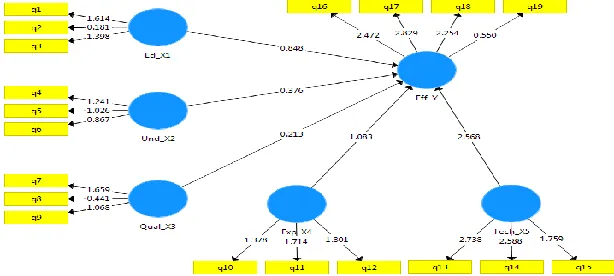
The conceptual framework in Figure 1 as a follows:
Figure 1. Research Framework
3. RESEARCH METHOD
3.1. Research Design
This research uses quantitative. Quantitative method is carried out with descriptive analysis along with field survey.
Meanwhile the quantitative method is carried out using SEM analysis.
3.2. Variable Operationalization
Table 1. Variable Operationalization
No. Variable Operational Definition Indicator Scale
1 Education Level Formal Education Level 3 Ordinal
2 Financial Statement Understanding Understanding of financial and accounting principles 3 Ordinal
3 Experience Experience in investing transaction 3 Ordinal
4 Consultation Quality Consultation Depth 3 Ordinal
5 Technical Application Utilization Understanding of graphic application utilization 3 Ordinal 6 Comprehension Effectiveness of
1245 3.3. Population and Research Sample
The populations of this research are active investors and potential investors in capital market in Medan, Indonesia. The sampling method used is the Purposive Sampling method.
3.4. Data Collection Technique
The data collection method in this research is carried out using several techniques as follow:
1. Focus Group Discussion (FGD). 2. Research Questionnaire.
3.5. Data Analysis
To find out the effectiveness of the application, the analysis of Structural Equation Modeling (SEM) is used as follows:
Y = a +b1X1+ b2X2 + b3X3 + b4X4 + b5X5 + e
Whereas:
X1 = Education Level
X2 = Financial Statement Understanding
X3 = Consultation Quality
X4= Experience
X5= Technical Application Utilization
Y = Comprehension Effectiveness of Fundamental and Technical Analysis
a = Constant
b = Regression Coefficient e = Error
3.6. Measurement Model Test (Outer Model) 3.6.1. Convergent Validity Test
It is a test to measure indicator accuracy or dimension by measuring the correlation dimension between construct and latent variable. To measure convergent validity, standardized loading factor is used which describes the correlation dimension among each indicator and its construct (Ringle et al., 2015). The loading factor value above 0.7 is stated as an ideal or valid size as an indicator in measuring construct, the value above 0.5 can still be accepted while the value below 0.5 must be excluded from the model.
3.6.2. Discriminant Validity Test
It is a test to find out whether the indicators of a construct do not highly correlate with indicators of other constructs. Discriminant validity from the outer model of this research is a reflective model, which is a model that shows a causal relationship come from the latent variable to the indicator, evaluated through the cross loading (Ringle et al., 2015). The size of the cross loading is by comparing the indicator correlation with the other construct. In addition to the loading comparison with the cross loading, the discriminant validity test needs to be strengthened by checking the AVE and the AVE root comparison, with correlation between latent variables. Convergent validity of the measurement model can be seen from the correlation between the indicator score with its variable score.
3.6.3. Realibility Test
Reliability test is a tool to measure the consistency of an instrument in sequence. Reliability shows accuracy, consistency, and fidelity of a measuring instrument in measuring. Reliability test in PLS can use two methods,
that are cronbach's alpha and composite reliability. Cronbach`s Alpha is a dependability coefficient that shows how well items in a group are positively correlated with each other. The closer the Cronbach's Alpha to 1, then the higher the consistency.
3.6.4. Structural Model Test (Inner Model) 3.6.4.1. Determination Coefficient (R2)
The inner model is a structural model to predict causality relationship between latent variables. Through a bootstrapping process, statistical T test parameter is obtained to predict the relationship of causality. The structural model (inner model) is evaluated by looking at the percentage of variance explained by the R2 value for the dependent variable using size. The inner model is a structural model to predict the causality relationship between latent variables.
3.6.4.2. Predictive Relevance (Q2)
The R-square PLS model can be evaluated by looking at the Q-square predictive relevance for the variable model. The Q-square measures how well the observation value is generated by the model and also the parameter estimation (Ringle et al, 2015). The Q-square value which is greater than 0 (zero) shows that the model has a predictive relevance value, while the Q-square value which is less than 0 (zero) shows that the model lacks of predictive relevance.
3.6.4.3. Hypothesis Test
Hartono (2004) explains that the measure of significance of supported hypothesis can be used with the comparison values of t-table and t-statistics. If the t-statistic is higher than the T-table value, it means that the hypothesis is supported or accepted. In this researh for a 95 percent confidence level (alpha 95 percent), then the t-table value for one-tailed hypothesis is > 1.68023. The PLS (Partial Least Square) analysis used in this research is conducted using the SmartPLS version 3.0 program, run by a computer.
3.6.4.4.Moderation Test (Two-Stage Approach)
However, if there is an exogenous or moderator construct in the form of format, then the Product Indicator Approach is not the right method to test the finteraction effect. This is because the formative indicator does not assume the same influence to the construct. Ringle et al, 2015 developed a method to test the moderation effect by using a formative construct called the Two-Stage Approach. This approach is considered to have an advantage because it uses a latent variable score.
4. RESULT AND DISCUSSION
4.1. RESULT
4.1.1. Measurement Model Test Result (Outer Model) 4.1.1.1. Convergent Validity Test Result
1246
questions in the questionnaire do have value and are worthy to be tested. The lowest outer loading value is 0.610 which is found in the fourth financial administration question indicator, while the value range used to see the convergent validity value which is 0.500 to 0.700. Therefore all the
questions in each indicator are valid. The higher the generated outer loading value, the more valid each question is used also. The result shows the validity test as follows:
Figure 2. Validity Test Result
Based on Figure 2 the results of the convergent validity test which is seen through the outer loading value, it can be concluded that all the questions in each indicator in each variable of this research are valid.
4.1.2. Discriminant Validity Test Result
Based on the table of the discriminant validity test result, it can be understood that the correlation between the constructs of each variable with its indicator is higher when compared to the correlation of each variable indicator with the other construct. Therefore, it indicates that all of those variables are in good condition and appropriate in their use and measurement. It can be seen that each variable on this research has a cross loading value which is always higher
for each indicator compared to other variable indicators that also influence on this research.
4.1.3. Realibility Test Result
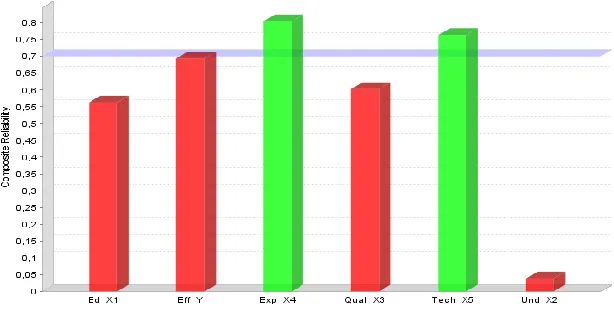
Based on the reliability test result, it can be seen through a table displaying the value of cronbach alpha and composite reliability. All values of cronbach alpha and composite reliability on the table of the reliability test results are ranging from 0.600 to 0.800, even for moderating variables showing the value of 1.000, thus all the variables on this research are reliable. Therefore, all the indicators on this research which are measured by the questions can be said that all indicators on this research are also reliable. The result shows:
Figure 3. Reliability Test Result
Based on Figure 3 it means that the data quality test result on this result, which consists of validity and reliability, is already fulfilled so all the questions on this research are valuable and reliable. The cronbach alpha which has the lowest value on this research is 0.654 which is located in the financial report quality variable, nevertheless it can be understood that each question item that represents each indicator of the dependent variable is trustworthy.
4.1.4. Structural Model Test Result (Inner Model) 4.1.4.1. Determination Coefficient Test Result (R2)
1247 Table 2. Determination Coefficient Test Result
Original Sample Sample Mean (M) Standard Deviation t Statistics (|O/STDEV|) p Values
Eff_Y 0.074 0.180 0.054 1.372 0.171
Source: SMART PLS (2018).
Based on the result of the coefficient of determination, it can be seen that the value of R Square is equal to 0.180, and the value of Adjusted R Square is 0.074. This is illustrated in the following visuals
Figure 4. Adjusted R Square Diagram
Based on Figure 4 the value of R Square illustrates that all the independent variables on this research are able to represent the dependent variable that is financial report quality of 7.4%, while the remaining 92.6% is influenced by other variables not mentioned on this research.
4.1.5. Hypothesis Test Result
Hypothesis test result is the result that shows whether the designed hypothesis on the previous chapter is indeed in line with the research result after the data processing.
Based on that designed hypothesis, there will be a variable that has both positive and negative influences, and the other which does not have caregiver. In addition, there will be a significant variable, and there will also be the insignificant. Following this, the researcher presents the data from research result that shows the research hypothesis based on the original value of the sample and the value of t statistics. Therefore can be drawn a conclusion related to that hypothesis.
Table 5. Hypothesis Test Result
Original Sample Sample Mean (M) Standard Deviation t Statistics (|O/STDEV|) p Values
Ed_X1 -> Eff_Y 0.132 0.064 0.160 0.825 0.410
Exp_X4 -> Eff_Y 0.108 0.152 0.104 1.038 0.300
Qual_X3 -> Eff_Y -0.032 0.053 0.158 0.202 0.840
Tech_X5 -> Eff_Y 0.259 0.255 0.106 2.451 0.015
Und_X2 -> Eff_Y -0.049 -0.012 0.124 0.394 0.694
Source: SMART PLS (2018).
Based on Table 5 the results of the hypothesis testing it can be seen that the Education Level Variable is the first independent variable on this research does not have a significant effect partially on the Comprehension Effectiveness of Technical and Fundamental Analysis. This can be seen through the statistical T value of 0.825 > from
the t table value which is 2.084, and this can be proven by the original value of the sample that is equal to 0.410 and no significance which is 0.410 > 0.05, which means that the Education Level does not influence the Comprehension Effectiveness of Technical and Fundamental Analysis. This is illustrated in the Figure 5 following:
1248
The Financial Statement Understanding Variable is the second independent variable on this research which has no partial influence on the Comprehension Effectiveness Technical and Fundamental Analysis. this can be seen through the statistical t value of 1.038 > from the t table value of 2.084, and this can be proved by the original sample value of 0.152 and the significance of 0.300 > 0.05, which means that the Understanding Variable of the Financial Statements on this research has no positive effect and significant to the Comprehension Effectiveness of Technical and Fundamental Analysis. The information of Consultation Quality Variable is the third independent variable on this research that does not influence the Comprehension Effectiveness of Technical and Fundamental Analysis, this can be seen through the statistical t value of 0.202 < from the t table value of 2.084, and this can be proved by the original sample value of 0.053 and significance of 0.840 > 0.05, which means that the Consultation Quality Variable does not influence the Comprehension Effectiveness of Technical and Fundamental Analysis. Experience Variable is the fourth
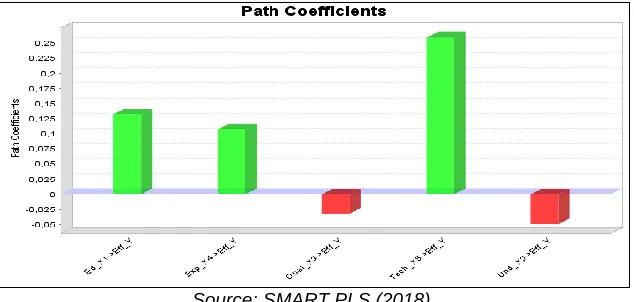
independent variable on this research that has a positive and significant effect partially on the Comprehension Effectiveness of Technical and Fundamental Analysis, this can be seen through the statistical t value of 2.451 > from the t table value of 2.084, and this can be proven by the original value of the sample that is equal to 0.255 and significance of 0.255 > 0.05, which means that the Consultation Quality Variable does not influence the Comprehension Effectiveness of Technical and Fundamental Analysis. Technical Application Utilization Variable is the fifth independent variable on this research which has no influence on the Comprehension Effectiveness Technical and Fundamental Analysis, this can be seen through the statistical t value of 0.394 < from the t table value of 2.084, and this can be proven by the original sample value of -0.049 or 0.049 > 0.05, which means that the Consultation Quality Variable does not influence the Comprehension Effectiveness of Technical and Fundamental Analysis. While the research model is in the following Figure 6:
Source: SMART PLS (2018). Figure 6. Path Coefficient Diagram
4.2. Discussion
Based on the test result, it indicates that the dominant factor influencing the public knowledge of the analyzer is the experience factor; while the factors of education, financial statements understanding, consultation quality, understanding using technical applications, have no significant effect on the effectiveness of education to the public on knowledge of technical analysis and fundamentals of investment in the market capital. The phenomenon of the lack of knowledge of Indonesian people about the capital market is a challenge for the Indonesia Stock Exchange (IDX). According to data from the Financial Services Authority (OJK), only 1 in 1000 people surveyed carrying out the capital market activity. In fact, Financial Fervices Authority recorded 93.79 percent of Indonesians do not know about the capital market (Rahardian, 2015). Another fact said from IDX data, that it is only about 400,000 capital market players are listed on the stock exchange. Departing from the facts above, IDX is increasingly and intensively educating the Indonesian people about the importance of the capital market due to an effort to improve the welfare of the society. The public does not need to be afraid to lose money in stock investing, just follow the news in the mass media about the economic upheaval and the political temperature in Indonesia, and then convince which option
1249
stock is strongly influenced by the performance of the concerned company. The data used in the fundamental analysis involves historical data. It involves an analysis of the strength and weakness of the company, how its operation is and also how its prospect will be in the future. While Technical Analysis is an analysis that is often used by a potential investor and usually the data used in this analysis is in the form of graphic or computer program. From graphic or computer program can be discovered how market trend, security or commodity future, will be selected in investing. Although this analysis is usually used for the short and medium-term analysis, it is often used to analyze in the long run, supported by other data. This technique ignores matters relating to the company's financial position.
5. CONCLUSION, LIMITATION, AND
SUGGESTION
5.1. Conclusion
The dominant factor influencing public knowledge of the analyzer is the experience factors; while the factors of education, financial statements understanding, consultation quality, using technical application understanding, have no significant effect on the education effectiveness to the public on the knowledge of technical analysis and fundamental in capital market investment.
5.2. Limitation
This research is conducted by surveying primary data on 125 respondents randomly, and identifying the field directly to prospective investors in the Money Market and Capital Market in North Sumatra. The sample justification needs to be strengthened based on society groups, which is based on the income strata. This research does not sort respondents based on their income.
5.3. Suggestions
1. The society should be given a special education in the form of training of technical and fundamental analysis in investing in the capital market, thus it can increase the knowledge more broadly and not only to certain realm. 2. The Capital Market Investment Gallery in North Sumatra
should be given a greater role to socialize the Gallery’s role and connect it to the capital market players and money markets in Indonesia.
REFERENCES
[1]. Ahmadi, E., Jasemi, M., Monplaisir, L., Nabavi, M. A., Mahmoodi, A., & Jam, P. A. (2018). New efficient hybrid candlestick technical analysis model for stock market timing on the basis of the Support Vector Machine and Heuristic Algorithms of Imperialist Competition and Genetic. Expert Systems with Applications, 94, 21-31.
[2]. Alhashel, B. S., Almudhaf, F. W., & Hansz, J. A. (2018). Can technical analysis generate superior returns in securitized property markets? Evidence from East Asia markets. Pacific-Basin Finance Journal, 47, 92-108.
[3]. Avramov, D., Kaplanski, G., & Levy, H. (2018). Talking Numbers: Technical versus fundamental investment recommendations. Journal of Banking & Finance, 92, 100-114.
[4]. De Souza, M. J. S., Ramos, D. G. F., Pena, M. G., Sobreiro, V. A., & Kimura, H. (2018). Examination of the profitability of technical analysis based on moving average strategies in BRICS. Financial Innovation, 4(1), 3-14.
[5]. Dieci, R., Schmitt, N., & Westerhoff, F. (2018). Interactions between stock, bond and housing markets. Journal of Economic Dynamics and Control, 91, 43-70.
[6]. Edwards, R. D., Magee, J., & Bassetti, W. C. (2018). Technical analysis of stock trends. CRC press.
[7]. Hui, E. C., & Chan, K. K. K. (2018). Does the Shanghai–Hong Kong Stock Connect significantly affect the AH premium of the stocks?. Physica A: Statistical Mechanics and its Applications, 492, 207-214.
[8]. Lahmiri, S. (2018). A technical analysis information fusion approach for stock price analysis and modeling. Fluctuation and Noise Letters, 17(01), 1850007.
[9]. Lin, Q. (2018). Technical analysis and stock return predictability: An aligned approach. Journal of financial markets, 38, 103-123.
[10]. Lubis, A. F. 2008. Capital Market Analysis. Jakarta. UI Press.
[11]. Myšková, R., Hájek, P., & Olej, V. (2018). Predicting Abnormal Stock Return Volatility Using Textual Analysis Of News–A Meta-Learning Approach. Amfiteatru Economic, 20(47), 185-201.
[12]. Rahardian, R (2015). Indonesia Stock Exchange Efforts Educate the Public About Capital Markets. Retrieved from http://marketeers.com/upaya-bursa- efek-indonesia-edukasi-masyarakat-tentang-pasar-modal/ (Acceses on October, 2018).
[13]. Setiawan, S. R. D. 2017. Investors in Indonesian Capital Market Translucent 1.1 Million", Retrieved from
https://ekonomi.kompas.com/read/2017/12/27/17085 8426/investor-di-pasar-modal -indonesia-translucent-11-million. (Acceses on October, 2018).
[14]. Sigo, M. O., Selvam, M., Venkateswar, S., Lingaraja, K., Amirdhavasani, S., & Kathiravan, C. (2018). Predicting stock market movements of India using data deterministic approach. Academy of Strategic Management Journal, 17(2), 1-14.
[15]. Weng, B., Lu, L., Wang, X., Megahed, F. M., & Martinez, W. (2018). Predicting short-term stock prices using ensemble methods and online data sources. Expert Systems with Applications, 112, 258-273.
[16]. Xi, X., & An, H. (2018). Research on energy stock market associated network structure based on financial indicators. Physica A: Statistical Mechanics and its Applications, 490, 1309-1323.