The Development of a Computer Based Modelling
Environment for Upper Secondary School Geography Classes
)
Terence Melvin Goble
PhD
Institute of Education
University of London
CONTENTS - VOLUME TWO
Page
Appendix PUDDLE Interviews
8
One
Helen
9
Manesh
30
Andrew
53
Martin
70
Jennifer
91
Appendix DMS Interviews
106
Two
Helen
106
Manesh
110
Andrew
113
Jennifer
119
Martin
127
Appendix Prototype Expert System
132
Three
Industrial Location
Appendix Geography Models - DMS
143
Four
Population Increase
144
PopVar
144
Population Growth
145
Birth and Death Rates
145
Transport
146
Distance - Cost
146
Break of Bulk
147
Cost Revenue
148
Crop Yield
148
Bidrent
149
Oil Exploration - I
149
Oil Exploration - II
150
Radiation
150
Lapse Rate
151
Glacier
152
Precipitation
152
River Velocity
152
Von Thunen
153
Queue
153
Queue One
154
Queue Two
154
Appendix Geography Spreadsheet Models
156
Five
Population Growth
157
Variable Rate Population Growth
158
Compound Population Growth
159
Bidrent Zones
160
Farm Production
161
Infiltration
162
Manning Coefficient
163
Gravity Model
164
Least Cost Industrial Location
167
Least Cost Industrial Location with Terminals
168
Profit Areas for Industrial Location
169
Longitude and Time
171
Road Building
172
Traffic Flow
174
Nearest Neighbour Analysis
176
Journey
177
Network Patterns
178
Accessibility in the Network
180
Oil Exploration
183
Meteorological Lapse Rates
184
Station Location
185
Appendix Geography Prolog Models
188
Six
Population Growth
189
Lights
190
Traffic at Two Sets of Lights
191
Regional Population
193
Shop Location
194
Road Building
196
Slope Drainage
198
Towns - Gravity Model
199
Longitude
200
Farm
202
Least Cost Location
204
Land Drainage
206
Sahel One
207
Sahel Two
208
Pupil - Teacher Interaction : Pupil Model
209
Pupil - Teacher Interaction : Teacher Model
210
Appendix Prolog Student Trial Logs
212
Seven
Lizali Drainage Model
213
Banan Drainage Model
214
Water 1 Drainage Model
215
Water2 Drainage Model
216
Appendix Geography Models Smalltalk
218
Eight
Population Growth
219
Infiltration
227
Regional Location of Industry
230
Expert System - Industrial Location
233
Appendix Smalltalk Trial Logs
239
Nine
Group JT
240
Group SS
241
Group KE
243
Group ST
245
Group RM
247
Emma
253
Tony
254
James
255
Robert
256
Matthew
257
Sauni
258
Stephen
259
Rear Pocket
APPENDIX ONE
PUDDLE Interview : HELEN
Hl. ALRIGHT, HELEN, SO NOW WE HAVE GOT TO SORT OF RACK OUR BRAINS HAVEN'T WE, AND THINK ABOUT WHAT WE DID A COUPLE OF MONTHS AGO? WHAT DO YOU REMEMBER OF 'PUDDLE'?
'Puddle', I remember that we had a puddle and you could vary the weather conditions. Like you could snow, rain and you could vary like the evaporation rate and you let it rain for an hour and let all the weather conditions occur for an hour. And afterwards you'd see how much had gone into the ground, and gone into the puddle, overflowed or was saturated the ground, and you could read off the levels and read off the water table.
H2. RIGHT, BEFORE YOU WENT INTO THAT LESSON, YOU'D NEVER USED A COMPUTER BEFORE IN THE SCHOOL? (NO.) NEVER ANYWHERE? (NO.) DID YOU KNOW YOU WERE GOING TO USE A COMPUTER IN CLASS?
I think he told us, but we didn't really know what to expect. It sounded really complicated, I thought we were never going to get the hang of this, but once we got going again it was okay.
H3. LOOKING BACK NOW, IT WOULD SEEM FAIRLY SIMPLE I GUESS, COMPARED WITH WHAT YOU'VE BEEN DOING TODAY?
Yes, it does, yes it's practical.
H4. YOU'VE BEEN BUILDING MODELS HAVEN'T YOU TODAY?
Yes.
H5. WHAT DO THINK A MODEL IS? HOW WOULD YOU DESCRIBE IT TO THE LOWER SIXTH?
Oh, how to describe it? It's a way of putting theories that you've learnt. You put them into practice and see how they work. It is a way of proving that theories do work. Or whether if you can prove them wrong, and how you could vary them. And you can learn what various inputs can change and what are the outputs.
H6. SO YOU THINK OF MODELS IN TERMS OF INPUTS AND OUTPUTS, AND A BOX IN THE MIDDLE DOING SOMETHING TO IT? HAVE YOU HEARD OF PHRASES LIKE WHITE BOXES AND BLACK BOXES?
H7. WELL SOMETIMES SCIENTISTS TALK ABOUT A BLACK BOX WHERE THERE'S AN INPUT. YOU DON'T KNOW WHAT GOES ON INSIDE IT'S ALL BLACK, AND SOMETHING COMES OUT THE OTHER END. A WHITE BOX IS ONE WHERE YOU SEE WHAT GOES ON IN THE MIDDLE. WITH A COMPUTER PROGRAM YOU DON'T NORMALLY SEE WHAT GOES ON INSIDE IT DO YOU?
No.
H8. SO, IT'S JUST LIKE A BOX?
You can type it in and then you see it works it out for you.
H9. YES, A PROGRAM LIKE 'PUDDLE' HELPS - IT GIVES YOU AN IDEA PERHAPS OF WHAT'S GOING ON INSIDE OF A MODEL OR BY SHOWING YOU THE DIFFERENT BITS IN THE PICTURE.
Yes it can, it's quite useful.... (noise)
H10. WHEN YOU SAW 'PUDDLE', YOU'D NEVER SEEN ANYTHING LIKE THAT BEFORE, DID YOU FIND IT VERY PECULIAR AS A WAY OF PRESENTING THAT ...
I didn't know how it was being presented, I think I was a bit slow to what would happen, but it did seem very common sense once it came up. I don't know what I would have expected really.
H11. HAVE YOU SEEN ANYTHING SIMILAR TO WHAT YOU SAW ON THE SCREEN? I don't think I have really. I have done a lot of other population models and things like that which are quite different.
H12. HAD YOU SEEN ANY DIAGRAMS IN BOOKS, WHICH WERE LIKE THE 'PUDDLE'?
Yes I have seen, I have.
H13. HAD YOU SEEN THOSE BEFORE YOU CAME TO THE PROGRAM? Yes.
H14. SO YOU WERE FAMILIAR WITH THAT IDEA (YES.) OF PRESENTING THINGS? SUPPOSING YOU HAD TO TAKE SOME SAY, YOUNGER STUDENTS LOWER DOWN IN THE SCHOOL AND EXPLAIN TO THEM WHAT IT'S ALL ABOUT, HOW WOULD YOU BEGIN?
explain all about the weather conditions and evaporation, and various rates and how they are worked out, and then I'd say well this is how you can work it out on the computer and then give an example - and try to help them to use it.
H15. DO YOU THINK STUDENTS WOULD HAVE A PROBLEM LINKING UP WHAT THEY SEE ON THE SCREEN WITH WHAT HAPPENS OUTSIDE OF THE WINDOW. WHERE DO YOU THINK PROBLEMS COULD ARISE?
Well, obviously, when you are outside you can't exactly see evaporation. That would be hard for them to picture. It would have to be explained quite well. They could see like the runoff, surface runoff. I think most things they'd be able to see, but there is some that they wouldn't realise at all, would need quite a bit of explaining.
H16. .... USING A DIAGRAM LIKE THAT? (YES.) IT IS FAIRLY NATURAL. DO YOU THINK THEY COULD BE MISLED IN ANY WAY BY THE RECTANGULAR BOXES AND SO ON?
Yes, they might be able to picture it as it should be you know after seeing it yourself. On the program they'd probably think it is more like that.
H17. YES, SO THEY MIGHT TAKE IT A BIT TOO LITERALLY AND THINK OF BURIED TANKS UNDERNEATH THE GARDEN?
(Laughing)
H18. SUPPOSING YOU WANT TO GET AWAY FROM THAT PROBLEM, HOW DO YOU THINK WE COULD REPRESENT IT ON SCREEN WITH THE SAME INFORMATION BUT IN A WAY THAT'S CLOSER TO WHAT, TO THE WAY SOIL REALLY WORKS? OR THE WAY IN WHICH TREES REALLY WORK, OR GRASS?
Well if you try to do it like that, I think it would be a bit too complicated. There's quite a lot of detail shown on this screen. I think it would be difficult to see the results. I think it is best to simplify it (Yes.) I think it is easier to read it up like that.
MAKE OF A DIAGRAM LIKE THAT? HOW WOULD YOU INTERPRET IT AND EXPLAIN IT TO STUDENTS?
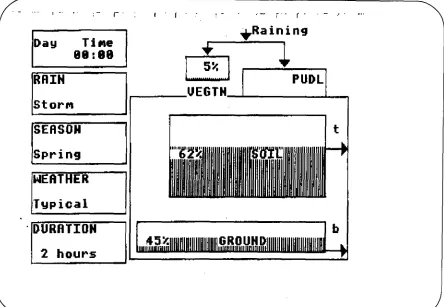
Re Hl. Screen image: DEMO - Storm in spring at time 0.00 hours
Explain it? Well, it starts off at the very top, where you have the rain and 5% of the rain has gone into the vegetation, but the restis going into the puddle. Out of the vegetation and the puddle it splits up into various sections and it shows you how most of its gone into the soil, and the rest of it seeps right down into the ground.
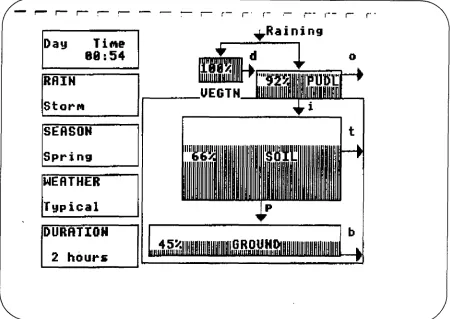
H20. THAT'S TIME ZERO, IF WE GO ON SOME 54 MINUTES INTO THE SIMULATION. WE'VE HAD AN UPDATED SCREEN EVERY 6 MINUTES. WE GET A PICTURE LIKE THIS WHICH IS RATHER .... HOW DO THOSE TWO COMPARE? Re H2 Screen image: DEMO - Storm in the spring at time 0.54 hours Well that shows first of all, the first box of vegetation, it shows that it's been completely covered by the rain. It's been completely full up, so it has all flowed into the puddle, that's nearly full, some is coming off the puddles that's the evaporation rate I think. It's infiltrating into the soil, it hasn't made that much of a difference into the soil though, only 4% increase. And the ground's exactly the same, 45%.
H21. DOES IT SEEM STRANGE THAT THESE HAVE CHANGED A LOT AT THE TOP OF THE DIAGRAMS BUT THE GROUNDWATER LOWER DOWN HASN'T CHANGED AT ALL? Yes.
H22. WE'VE GOT LOTS OF FIGURES HERE, ONE FOR EACH OF THE STORES AND THEY CHANGE EVERY 6 MINUTES - DID YOU ACTUALLY SORT OF LOOK AT THE FIGURES AT ALL, CONSIDER THEM, OR DID YOU JUST GO BY THE PICTURE OF THE WATER LEVEL GOING UP AND DOWN?
Well, first of all I couldn't really take in all the figures, it was a bit too much. You just looked at it, and thought 'Oh, what's all this? So you are just looking at the actual movement and then we sort of broke it down in stages. You realised as you took the figures in, it made more sense to you then. You could see what was going on.
I can't really see how it could have been improved. I think it's quite well displayed as it is, actually. Quite readable.
H24. RIGHT OKAY, AND THEN FINALLY, AFTER TWO HOURS THIS WAS THE END. WE'VE HAD AN HOUR OF EVAPORATION AND TRANSPIRATION. CAN YOU REMEMBER WHAT THESE OTHER LETTERS STAND FOR, THE LABELS?
Re H3- Screen image: DEMO - Storm in spring at time 2.00 hours
I think that was infiltration. (Yes.) .... was that transpiration ? (No). .... what 'T' was ...., no I can't remember.
H25. IT WAS MOVEMENT IN THE SOIL, SEE IT'S GOING THROUGH THE PORES - IN THE HOLES IN THE SOIL. SO THAT WAS CALLED THROUGHFLOW, THROUGH THE SOIL. OKAY, WHAT ABOUT THIS ONE?
Precipitation? No?
H26. IT'S FAR TOO LATE .... PERCOLATION, YES? FINALLY, WHAT IS B,? Base flow.
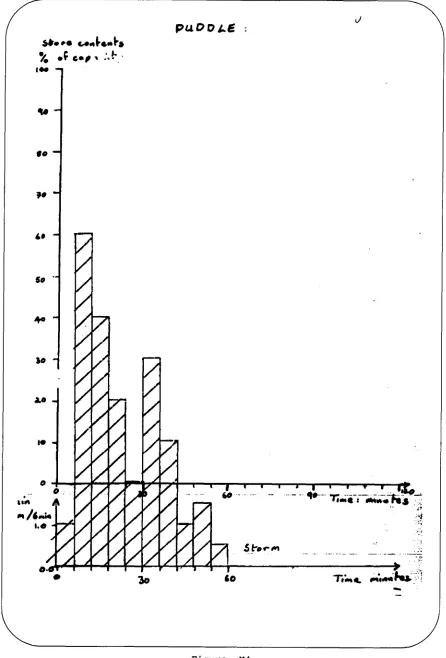
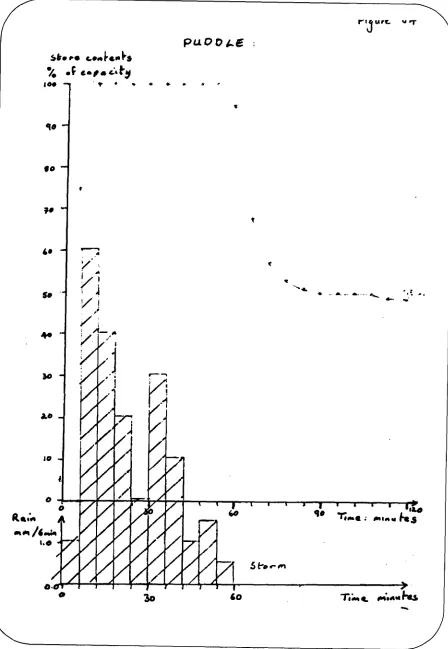
H27. BASE FLOW, GOOD, RIGHT, YES. YOU'VE DONE YOUR EXAMS THIS TERM, HAVEN'T YOU? (YES.) OKAY, SO YOU DON'T HAVE TO REMEMBER THOSE THINGS FOR A WHILE. RIGHT ONE INTERESTING THING, WHEN WE WERE DEVISING THIS PROGRAM, WE ORIGINALLY WANTED TO PROVIDE A SUMMARY OF THIS ON A GRAPH; AND THERE WASN'T THE COMPUTER MEMORY TO DO IT. BUT FOR TODAY'S EXERCISE I'VE GOT SOME DIAGRAMS HERE, (IF I CAN FIND THE RIGHT ONES) SO WE CAN LOOK AT THE SAME SEQUENCE THAT WE HAVE SEEN THERE. BUT LOOK AT ITS ON A GRAPH, START OFF WITH THE RAINFALL, IF WE SUPERIMPOSE THEM LIKE THAT. SO THAT SHOWS US THE RAINFALL AT SIX MINUTE INTERVALS OVER THAT FIRST HOUR, SO THAT REPRESENTS THE STORM, THOSE ARE THE FIGURES THAT WE USED IN THE PROGRAM. ANY COMMENTS ABOUT THAT STORM FIRST OF ALL?
Re H4- DEMO - Storm in spring, graph of rainfall
Well, it's heaviest when it first starts off, and then after nearly thirty minutes; is it the same storm all the way through ?
H28. ONE STORM.
H29. YOU ARE RACING AHEAD A BIT THERE I THINK? (YES.) IN FACT THIS JUST REPRESENTS THE AMOUNT OF RAIN THAT'S FALLING IN DIFFERENT TIME PERIODS, ALRIGHT? SO IT'S JUST THE RAIN THAT'S MOVING AND HASN'T GOT INTO THE OTHER BITS YET. ALRIGHT, OKAY, IF WE FOLLOW THE CURVE ROUND TO THE RAIN. NOW WE CAN LOOK AT THE, WHAT HAPPENS TO THE VEGETATION STORE OVER THAT SAME PERIOD OF TIME RIGHT, SO CAN YOU SORT OF TALK US THROUGH THAT GRAPH, AND SAY WHAT IS HAPPENING AS WE WENT THROUGH THE TIME?
Re H5- DEMO - Storm in spring, graph of rainfall and vegetation store contents
Well, the first 6 minutes seems to have flooded all the vegetation, and it's all, and it can't take any, well it's taken it all, up to what about 50 minutes, 45 minutes and after that it's the same level and then it's gradually starting to seep into the ground and after that when it's stopped, it gets a chance to sink in, otherwise it just stays there, it can't do anything.
H30. YES, WHAT DID YOU NOTICE FROM THE SHAPE OF THIS CURVE?
Oh, it suddenly all goes in, it seems to all fall into the ground and then it levels off and calms down a bit. (Yes.) Not such a fast route.
H31. WHY DO YOU THINK IT LEVELS OFF?
Because the ground directly underneath it is probably quite full up by then.
H32. YES, WHAT WOULD THE NAME OF THE FLOW BE THAT COMES OFF THE VEGETATION?
I give up.
H33. WE SHOULD HAVE HERE, SHOULDN'T WE, WE ARE TALKING ABOUT THIS FLOW AREN'T WE? - IT IS A VERY TECHNICAL TERM.
Detention?
H35. RIGHT OKAY, SO THE NEXT STAGE THEN IS, WE'VE LOOKED AT THE VEGETATION STORE, IF WE LOOK NOW AT THE PUDDLE STORE AND SEE HOW THAT BEHAVES OVER THE SAME PERIOD OF TIME.
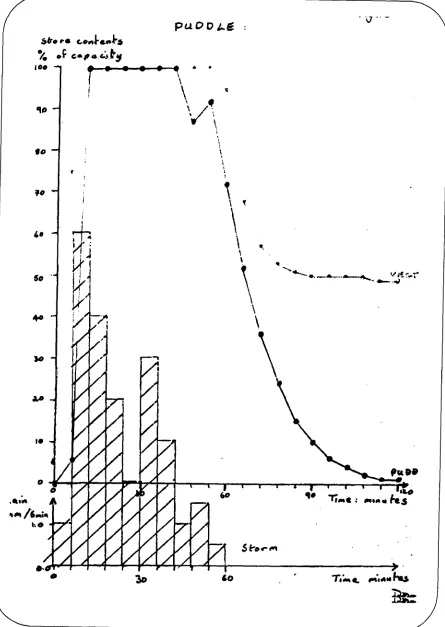
Re H6 : DEMO - Storm in spring, graph of rainfall and vegetation, puddle store contents
Right, when it first starts off not much has happened and then suddenly it's a great big increase, and it's really completely full-up. It doesn't stay full-up as long as the vegetation (there), it is about 12 minutes before the vegetation started to fall, the puddle falls, then it goes up a bit more and then it's suddenly all gone. It's quite a big drop down.
H36. WHY DO YOU THINK IT VARIES LIKE THIS AT THE TOP, WHY DO YOU THINK IT FLUCTUATES?
.... Maybe because it has soaked into the ground, and then I don't know, it gets pushed up somehow.
H37. CAN YOU SEE ANY CONNECTION BETWEEN THAT AND THE RAINFALL?
Well the rainfall's gone up yes, the rainfall has gone up a bit more at that stage and that's why it's filled up again.
H38. RIGHT, SO THE PUDDLE IS RESPONDING TO THE RAIN, AND IT IS FLUCTUATING RIGHT, THEN ONCE THE RAIN STOPS THE PUDDLE DRAINS?
Yes quite quickly.
H39. HOW MUCH IS LEFT IN AFTER OUR 2 HOURS, LET'S HAVE A LOOK AT THE PICTURE THERE (FIGURE H3).
Only one percent, yes.
H40. YES, ONLY ONE PERCENT, SO THAT'S COME RIGHT DOWN, HOW DOES THAT COMPARE WITH THE VEGETATION?
The vegetation is still quite high, it's what, fifty percent, so that's still obviously needs a lot more.
H41. WHY DO YOU THINK THE VEGETATION HAS STOPPED THERE, WHEREAS THE PUDDLE HAS GONE RIGHT THE WAY DOWN?
H42. SUPPOSE, THIS IS SUPPOSED TO BE REPRESENTING A GRASSY FIELD SOMEWHERE IN THE ENGLISH MIDLANDS AFTER A STORM IN THE SPRING. SUPPOSING YOU WERE WALKING THROUGH THAT FIELD AT THE END OF THE TWO HOURS, OKAY, SAYING THAT THERE IS A SMALL AMOUNT LEFT IN THE PUDDLE, WHAT DO YOU THINK THE VEGETATION AND THE GRASS WOULD LOOK LIKE?
The grass, it still would be quite boggy, I should imagine
H43. THE GRASS - BY BOGGY, WHAT DO YOU MEAN? THE SOIL THE GRASS IS IN, OR WHAT, THE GRASS ITSELF?
Yes, the soil itself.
H44. WHAT ABOUT THE GRASS ITSELF?
That's still got a lot of moisture on it, yes that would be quite wet.
H45. HOW WOULD THE WATER ACTUALLY APPEAR ON THE PLANTS? Sort of in droplets clinging to the leaves, and stem and things.
H46. OKAY, SO THE GRASS WOULD STILL BE QUITE WET IN FACT WOULDN'T IT? (YES.) WHY DOESN'T ALL THAT WATER FALL OFF? WHY DOESN'T IT DRAIN DOWN THE WAY THE PUDDLE DRAINS DOWN?
I don't know, something to do with the angle of the leaves, so it can't fall off at all. Because with the puddle it's just straight on the ground, so it can go straight in, but the vegetation it has to get over, it has another layer to get through.
H47. ALRIGHT, THE FINAL PART OF THE STORY. IF WE LOOK AT WHAT HAPPENS TO THE SOIL ITSELF AND THE GROUND UNDERNEATH - THE SOIL DEEPER DOWN - THE GROUND LYING THERE REPRESENTS THE AMOUNT OF WATER IN THE SOIL STORE AS A PERCENTAGE, AND THE GROUND STORE BENEATH IT -WHAT DO YOU MAKE OF THOSE?
Re H7 DEMO - Storm in spring, graph of rainfall and vegetation, puddle, soil and ground stores' contents
Well after the ground one is constant all the time the soil one has just risen slightly, then it's more or less constant, after the first hour it's a constant level.
Yes, I think so, although I would have thought the contents, I don't know, I'd think, I thought the soil would have been after the storm, I would have thought it would have gone down more then it, I mean it seems to be quite constant, I think it ....
H49. DO YOU THINK THE SOIL WOULD DRAIN IN AN HOUR? OR DO YOU THINK IT WOULD TAKE LONGER PERHAPS TO RESPOND?
No, it would take quite a bit longer, if it's been such a heavy storm.
H50. YES RIGHT, WHAT ABOUT THE CHANGE IN THE SOIL, COMPARED WITH THE CHANGES IN THE OTHER STORES?
It's not that much in particular, it only went up by say 4 or 5% and wouldn't make that much difference. I would have thought, considering that rainfall, I thought it would have made quite a bit of difference, but it hasn't.
H51. WHY DO YOU THINK THE SOIL PERHAPS CHANGED, ASSUMING THAT THE PROGRAM IS ALRIGHT, AND IT'S NOT A MISTAKE. WHY SHOULD THE SOIL CHANGE SO LITTLE WHEREAS THE PUDDLE AND THE VEGETATION CHANGE SO MUCH IN TERMS OF PERCENTAGE CONTENTS?
I think with the puddle and vegetation, that's on the surface so it has got a chance to evaporate and dissolve into the air, but the soil it just has to stay in one place I suppose, I can't really explain it now.
H52. RIGHT, IT YOU HAD TO PUT A FIGURE ON THE CAPACITY OF THESE DIFFERENT STORES, IN TERMS OF AMOUNTS OF MILLIMETRES OF RAIN THEY COULD HOLD, HOW WOULD THEY COMPARE DO YOU THINK?
.... The ground seems to hold a steady-amount, the puddle although it can hold it, it gets full-up too quickly, and the vegetation whereas the soil you know is not too bad, it can hold it.
H53. WHEN YOU USED THE PROGRAM, DID YOU SWITCH TO THE DISPLAY THAT SHOWED YOU THE CONTENTS AND CAPACITIES OF THE STORES AT SOME STAGE -TABLE OF FIGURES?
Yes, yes.
Yes it was, I couldn't do that side of it.
H55. IT IS NOT THE DETAIL THAT YOU REMEMBER EITHER? No.
H56. RIGHT OKAY, IF I TOLD YOU, SAY IN A TYPICAL SOIL IN THE TOP METRE (METRIC), ABOUT HALF THE SOIL IS SOIL, AND THE OTHER HALF IS HOLES, VERY SMALL HOLES MADE BY WORMS, WHERE ROOTS HAVE DECAYED, WHERE PEOPLE HAD DUG IT OVER, OR PEOPLE HAD PLOUGHED IT. SO THAT HALF THE SOIL WAS IN FACT SPACES, HOW MANY MILLIMETRES OF WATER COULD THAT SOIL IN THEORY HOLD?
It would hold a lot more than I would imagine, because there is a lot more to fill up, therefore it explains why it's , ....you know quite constant?
H56. LET'S IGNORE THAT ONE. RIGHT OKAY GOOD, NOW FOR SOMETHING COMPLETELY DIFFERENT. WE'VE BEEN PLAYING AROUND HERE WITH 'PUDDLE'. THIS WAY OF LOOKING AT THINGS, DO YOU THINK IT COULD BE USED IN OTHER PARTS OF GEOGRAPHY?
It could be used in Biology definitely I think, used as a study of plants and that. I think it would be more subjects where you could do more practical things. Maybe Biology, I don't think it would be any good, it wouldn't be any good of course for English!
H57. NO, WHICH ASPECTS OF BIOLOGY FOR EXAMPLE, WOULD YOU IMAGINE USING A SIMILAR TYPE OF PROGRAM?
Don't know how you could use it, but it would be useful because I know when I did it, you had to know quite a bit about plants and what the contents of the soil you had to analyse it and everything: So you could I suppose, you could see how much water different types of soil could hold, that would be quite relevant I think.
H58. HAVE YOU DONE ANYTHING ON NUTRIENTS, (YES.) NITROGEN CYCLES OR THINGS LIKE THAT? COULD YOU IMAGINE DOING THOSE SORTS OF CYCLES THIS SORT OF WAY?
Yes, yes.
H60. THE ENVIRONMENT, OTHER ASPECTS OF BIOLOGY, WHERE YOU WORK IN TERMS OF A DIAGRAM LIKE THIS?
Maybe you could do something like within ..(noise).. how much to do with the blood, how much nutrient it intakes and the waste products from the body, and things like that. I suppose you could set out, but I don't know how but, various organs what they need.
H61. WHAT ABOUT OTHER SUBJECTS, CAN YOU IMAGINE SAY IN OTHER ASPECTS OF GEOGRAPHY MAYBE?
What, using a program like this?
H62. YES, WHERE YOU TAKE MAYBE A COMPLETELY DIFFERENT TOPIC, BUT YOU PRESENT IT AS A DIAGRAM WITH BOXES AND A LINE LINKING THEM TOGETHER TO SHOW MOVEMENT OF SOMETHING AROUND THE SYSTEM?
Yes, I'm sure there are lots of examples, but I can't think of any though! (Laughs) I think anything where you can show it on a graph, on the computer on the screen, makes it much easier to understand, but I can't think of any examples.
H63. WHAT IF I GIVE YOU SOME IDEAS, WHAT ABOUT SOMETHING LIKE ECONOMICS, OR ECONOMIC GEOGRAPHY?
Yes, economic Geography, I don't know about Economics. I suppose you could plot up products, graphs and things like that. But I don't know if you could display it in
H64. HAVE YOU TALKED ABOUT SYSTEMS IN GEOGRAPHY WITH MR. GOBLE AT ALL?
I think so, yes I have to jog my memory.
H65. WHAT WE HAVE HERE IS SORT OF A SYSTEM WITH INPUTS AND OUTPUTS, AND WE CAN THINK OF THIS ALL BEING RELATED ....IN ECONOMIC GEOGRAPHY I COULD THINK OF A SITUATION WHERE MONEY MOVING ROUND AN ECONOMY COULD BE THOUGHT OF AS A SYSTEM. (YES.) THE SAME AS WE THINK OF A HUMAN BODY AS A SYSTEM. THIS IS REALLY A WAY OF THINKING ABOUT THINGS, WHICH YOU DON'T NORMALLY DO AT 0-LEVEL'. (NO, IT'S QUITE DIFFERENT.) CAN YOU IMAGINE BUILDING YOUR OWN SYSTEMS?
H66. NOW SUPPOSING YOU HAD A PROGRAM LIKE THE ONE YOU WERE USING THIS MORNING (DMS), WHICH HELPED YOU TO BUILD SYSTEMS, DO YOU THINK THAT WOULD HELP? (YES.) IT WOULD DRAW THE DIAGRAM FOR YOU. SUPPOSING YOU HAD, IF YOU COULD IMAGINE A PROGRAM LIKE THAT; HOW WOULD YOU WANT TO TELL IT, OR TYPE INSTRUCTIONS IN, TELL IT WHAT TO MAKE?
I want it to be explained, sort of to be shown as simply as possible it could be. I'm not sure, but I suppose you have to do it one bit at a time and then build up a picture at the end of it. You know the different inputs and to show the one output at the very end. But it would be quite complicated to do. (Yes.) I wouldn't want to handle it. (Laughs)
H67. WELL, IT TOOK TWO YEARS TO MAKE 'PUDDLE'. SO ..(YES, I CAN IMAGINE.).. RIGHT OKAY, COMING BACK TO THE WORD 'SYSTEMS'. PEOPLE TALK ABOUT SYSTEMS MODELS BECAUSE WE ARE NOT HERE DEALING WITH REAL SYSTEMS. IT'S ALL MAKE-BELIEVE REALLY ISN'T IT? (YES.) DOES THAT WORRY YOU, THAT IT'S ONLY A VERY SIMPLIFIED DIAGRAM?
No, I think I'd rather have it simplified than have say a real thing, which might be all crammed in and you can't understand a word of it you know.
H68. CAN YOU IMAGINE GOING OUTSIDE AND TRYING TO MEASURE AL THESE THINGS?
I think it would be very hard to do, especially the evaporation rate, it would take a lot of work.
H69. AND HAVING TO GO OUT THERE IN THE RAIN. (WOULDN'T BE MUCH FUN.) ACTUALLY, SOMETIMES THEY SHOW FILMS ON TELEVISION OF HOW THEY MEASURE ALL THESE THINGS, PEOPLE DO IT.
Do they?
Yes, it would be too complex.
H71. SO IT WAS WORTHWHILE DOING THIS FOR LEARNING?
Yes, in the course we are doing there is so much work to cover, you can't afford to spend too much time on anything but to get something like this, it's already done for you, it's up to you.
H72. SUPPOSING YOU WERE HAVING TO EXPLAIN THIS SAY TO THE LOWER SIXTH NEXT YEAR. MR GOBLE'S AWAY AND YOU HAVE BEEN ASKED TO GIVE A LESSON. HOW WOULD YOU EXPLAIN THE IDEA OF A SYSTEM AND A MODEL TO STUDENTS WHO HAD NEVER COME ACROSS THEM BEFORE?
I think I would try to introduce it through books, maybe a film of people actually going into the processes, trying to get the information together, and then, I don't know how I would explain it in words, it's very difficult.
H73. OKAY, TAKING A SIMPLER IDEA, WHAT IS A MODEL?
A way of expressing, it's an example of how a theory can work I suppose.
H74. IT'S A DIFFICULT THING TO EXPLAIN, ISN'T IT? (YES.) DIFFICULT TO PUT YOUR FINGER ON IT? (YES.) I HAD ONE STUDENT YEARS AGO, WHO DIDN'T BELIEVE THAT YOU COULD REPRESENT A RIVER OR RAINFALL ON A COMPUTER. HE DIDN'T SEE HOW IT WAS POSSIBLE. THAT WAS ONE REASON WHY WE DEVELOPED THIS PROGRAM TO SHOW HOW IT COULD BE DONE. YOU KNOW, IF YOU WENT HOME, DO YOU THINK YOU COULD EXPLAIN IT TO YOUR PARENTS?
I know, when I did go home and my mum, she kept sort of asking, well how is it done? She can't work it out at all. I found it very hard and difficult to explain. But I just said it was there.
H75. YOU DON'T HAVE A COMPUTER AT HOME? No.
you know, they never see anything like this, they don't realise that we can actually learn from it.
H77. SOME SCHOOLS SHOW THESE SORTS OF THINGS OFF ON A PARENTS EVENING, SO YOU CAN EDUCATE THE PARENTS.
That's a very good idea.
I
r
Day
Time
80188
RAIN
Storm
I aining
5%
UEATN_J
PUDL
SEASON
Spring
WEATHER
Typical
t
DURATION
2 hours
6411118
ill NEI
Ii
mg igti
r— r—
0■••■■Day
Time
08:54
RAIN
Storm
SEASON
Spring
WEATHER
Ty
p
ic
a
l
DURATION
2 hours
r
1-r"
+Raining
I
I
lirUEGTH
r r r
Day
Tine
02108
SEASON
Spring
e/t
NYE
49%„,
imunimullli
UEGTH
45%
GROUND
1% PUN_
U
RAIN
None
WEATHER
Typical
DURATION
2 hours
pu
0 0
SNPPO go*.4406illcCe,‘
fa —
ft*
• g r r w Ito q• Twit e sweivevoICS
. - _ - Tr:« 4. puma Fes
£0
A
r113tirr-
pu 0 0 1-
E
Sky PO r.04•440
I
P
$11
4
ES II CA'y 100 • ► • . 0'to
SO —
A
/ )
A—
e.
T1
60
qo nese Amu
NS
0JO
1(1
1--0 4- wet
40 Woe& 04AM
PIS
3o
puDDLE
str,orm
G0.6.44
0
f
10.
7
• •
V
So
Pa De
a I —I- 1:40
60
4111. Tiala : IwOAII S
I
so
TdIfto. dies■ANhas
11R:
sr
.4.3
100
60 q 0
Tiant : 01;44.4ets
5
30
so
DE's o e PrcoN
S
010
60
to
0 R. ;it
m
/6
m;S011.-
6.400.40
t.20
PUDDLE Interview : Manesh
MN1. SO NOW, ROUND TWO. WHAT DO YOU REMEMBER OF 'PUDDLE'?
What do I remember of 'Puddle'? I remember there's, rainfall, ev(ap)otranspiration rates, and then there's various rates, soil moisture, puddle, vegetation. Surface runoff, that's about as far as I can remember. Yes, I can remember quite a lot this time.
MN2. WHAT DID YOU ACTUALLY DO WITH IT, WHEN YOU USED THE PROGRAM? Oh, we set the various types of area which we used like, if it was autumn and then that would determine how much rainfall like, heavy, light, drizzle so forth. And then, then you'd get the various rates of flow, water outputs such as a high percentage of surface runoff, the vegetation has got a lot of water, and, well how much the puddle can hold. And then how much will go from the puddle into the soil moisture and into the ground level, which will subsequently (go) deep down right into the ground moisture and then runoff into the earth. And then you get all the readouts, you get the readout at the end, what the contents was, and that's really it because then IT showed, then after a while it stopped raining and it showed the evapotranspiration rate over two hours if I remember, and that was it (Figure MN1)- As much as I can remember.
Figure MN1 Screen image: DEMO - the SUMMARY option at time 2.00 hours
MN3. YES, THAT'S QUITE A LOT. SO YOU HAD A LOOK AT THE AMOUNT OF WATER THAT HAD COME IN AND GONE OUT ON A SUMMARY, AND THEN YOU ACTUALLY LOOKED AT HOW MUCH WATER THERE WAS IN EACH OF THE STORES, DID YOU?
Yes, yes.
MN4. YOU CAN'T REMEMBER, WHAT SORT OF FIGURES THERE WERE, OR WHETHER .., CAN YOU REMEMBER BEING SURPRISED BY THE FIGURES OR ANYTHING LIKE THAT?
Figure MN2 Printout: DEMO - The VALUES option at time 2.00 hours
rates of infiltration and the porosity of the ground. And then there was the other thing, of taking everything into account it was, I can't remember, that's very vague. But I think it takes everything into account and does what's sort of held in, what's the percentage or something of, the percentage increase or decrease in moisture, I think so, I can't remember. Well that's as far as I can remember.
MN5. THAT'S VERY GOOD. It's quite a long time.
MN6. WAS, THIS WAS THE FIRST PROGRAM YOU USED IN GEOGRAPHY. HOW DID YOU REGARD THIS SORT OF ?
It was a novelty to start off with, and it's quite a bit of fun, it was, yes it was pleasant of course and fun, but when you get into it's quite reasonable, quite a good program. I mean, not like the ones we are doing now. Again, that needed a bit of thinking, where everything wants to go, but it was predictable, most of the time it was quite predictable.
MN7 SO YOU RECKONED IT WAS REFLECTING WHAT YOU WOULD THINK WOULD BE LIKELY TO HAPPEN ... ?
Yes, quite a lot of the time it was, well I mean when you thought it was very heavy rainfall you'd think the puddle would pile up, and then quite a lot would go down to ground moisture and maybe a bit of surface runoff. And yes, you sort of got the idea of what was going on, it did happen. And if you didn't, well you just had to be a bit logically minded and the tables, and the tables would show you what had happened and how it had happened, really. And that's that, that's all I can remember again, so ....
MN8 SO YOU DIDN'T LOOK AT THE LISTING OF THE PROGRAM OR CHANGE THE MODEL?
I tried to, but that was difficult. Because, really I know I should he able to do, but I, I forgot; I couldn't see through lines, I couldn't see where they were meant to be see. So, I left it alone, I did try it once or twice and it did work. I did alter a few lines.
I think it was infiltration rate, I think I, of the soil, I think I changed that. .... noise .... a lot of the water in. Which I think was in the actual booklet which said how to change, set the infiltration rate lower, try that, it worked - quite well. I don't suppose I could have decreased it so that there would have been much more surface runoff, less going underground. But it wasn't that difficult, I could have altered it but I wasn't be too sure about people who had done that. Listing it for one thing is a problem. In that you have got to type 'LIST' and everything, and then they've got to know when to put it out when to do line number and what to put, and that could be a bit of a disadvantage.
MN10. SUPPOSING YOU COULD GET THE MODEL AND THE VALUES FOR 'PUDDLE' AND PUT THEM ONTO THE MODELLING SYSTEM YOU WERE USING THIS MORNING. DO YOU THINK YOU WOULD WANT TO PLAY AROUND WITH IT, IN THAT SORT OF SET-UP?
Oh, I see do you mean the rate of infiltration and ... ?
MN11. SUPPOSING YOU COULD TAKE THE 'PUDDLE' MODEL FROM THE PROGRAM AND PUT IT INTO THE DYNAMIC MODELLING SYSTEM, SO YOU COULD THEN CONTROL THE MODEL YOURSELF, AND CHANGE IT ...?
That'd be, that'd be much easier than it is in the existing form, it would be a lot easier but again the memory is not in there for it that much. That you can't do, but if it was in there I think it would be a lot easier. Graphs, if you could do graphs of proper, you know, proper graphs. Tables, if you could, if you had the ability that would be quite an idea. But well, I think, I think, I must admit, mixing and all that is quite good because you get the graphs on that side and tables which are very useful on that. Because
tables is a bit dodgy and I don't like to use them straight off. And that doesn't look very nice but presentable form, the other one was very much better.
MN12 GOING BACK TO 'PUDDLE' THEN, DID YOU FIND THE PICTURE ON THE SCREEN HELPFUL, OR ?
MN13 AND HAVE YOU USED OTHER DIAGRAMS LIKE THE ONES IN TEXTBOOKS PERHAPS, WHICH ARE ... ?
Yes, the same kind as 'Puddle' actually. ... in textbooks looked more or less like that. They were similar, very similar to it.
MN14 HAVE YOU DONE FLOW DIAGRAMS IN COMPUTER STUDIES AS WELL? Yes, many.
MN15 SO YOU ARE USED TO THE IDEA OF DRAWING BOXES AND ARROWS?
Yes, very. Very used to it, much of the time, because I say it makes life easier for the computer person. But, I suppose really it's more, much more commonsense really, because I mean you should be able to follow lines from one box to another, it shouldn't be too much trouble.
MN16 DID YOU EVER TRY ANYTHING LIKE DRAWING YOUR OWN 'PUDDLE' MODEL, BUT PERHAPS WITH MORE STORES IN IT OR WITH EXTRA FLOWS?
I'm afraid I didn't get round to it. I am sure it would very complex. I would have needed a lot of time for that, and because of the exam I couldn't do it. (No.) You know that would be very complex.
MN17 JUST TO SKETCH IT ON PAPER ... ?
Oh to, paper? Oh paper, yes I could have done it. Yes, it wouldn't have been too bad. But I think it would have been quite silly because I don't think there are any more stores really, except mountains maybe and that. But there were limitations for it, which could have been gone over if I'd used my own method (?). Maybe, I don't know, maybe I wouldn't be able to do it because there wasn't much memory.
MN18 CAN YOU IMAGINE BUILDING UP A PICTURE LIKE THAT'S IN A DIAGRAM FORM FOR ANOTHER ASPECT OF GEOGRAPHY? YOU KNOW, SUPPOSING YOU, COME TO ANOTHER TOPIC OF THE SUBJECT, AND YOU THINK MAYBE WE COULD HAVE ANOTHER PROGRAM HERE. COULD YOU SORT OF SKETCH OUT A DESIGN DO YOU THINK, FOR A PROGRAM YOU COULD WORK WITH?
could have ... I can't tell you off the top of my head, I dunno, oil maybe, I dunno. I can't tell you off the top of my head. But, you could sort of substitute parts into the boxes. And then from there you could do arrows, you know sort of like a flow diagram. Rather sort of like (ing?) oil shall we say. Except we can have programs that are say: there's was an oil crisis and so forth. Then I'd introduce, it could be done. That could be done so that arrows follow, and it shows it more in a diagrammatic form rather than reading a straight-forward text, which is much better. You can memorise things like that much easier than. It's been quite a long time since I've done 'Puddle' and I can more or less memorise it quite well. What worries, if it was in a textbook I'd have to remember it.
MN19 COMING BACK TO YOUR IDEA THEN, FOR LOOKING AT OIL. HOW COULD YOU IMAGINE THAT SORT OF FILLING IT UP, HOW CAN YOU IMAGINE IT WORKING, WHAT SORT OF THINGS WOULD IT REPRESENT?
Well, I think it would be everything the oil industry seems, since aLl was introduced to when, to now, or and maybe to the future, maybe even alter the figures and so, I dunno, say oil drops, oil prices drop and that would adapt to oil prices dropping in the present. So then they'll drop to, you know, so everything, the flow diagram following a different pattern and that will work out better. Yes, I suppose you could do that, and then I suppose you could have two flow diagrams for one for maybe past, and for present - for now, and then you could make one up yourself by feeding in the appropriate boxes by (setting them out?). You know anything any interference to do by itself to see whether you can, see if you get similar things or just change things about like change the variables slightly. Like saying that they introduced, oil prices were lower and there's enough oil in the world to ( ?), then obviously you are going to get different readings. It could be good, if you could stipulate it. It would be good for postulating ideas.
The input and outputs.
MN21 INPUT AND OUTPUTS, YOU SEE ARE THE TWO IDEAS, YES.
The rain of course which comes, and the flow of the water that is coming out. I'd would think they are the two main inputs, and main output.
MN22 AND WHAT'S ANOTHER COMPONENT, IF YOU HAD TO EXPLAIN IT TO SOMEONE WHO HAS NEVER SEEN IT?
Well, the actual program?
MN23 THE ACTUAL, THAT SCREEN DISPLAY WITH THE PICTURE.
I'd put it in three forms, input, then the store and then the output. Stores, of course, would be vegetation and the puddle. Whereas the output would be the runoffs, the various runoffs down the graph, and then of course the input would be the rain.
MN24 ARE THERE SOMETIMES WHEN THE INPUTS AND OUTPUTS ARE NOT CLEAR, DO YOU THINK?
Well not in the 'Puddle' case. I think that was quite clear.
MN25 IF WE TAKE AN EXAMPLE HERE, JUST OFF THE PILE WHICH I HAVE GOT HANDY, THAT'S NOT A GOOD ONE, LET'S TAKE ANOTHER ONE. HERE WE'VE GOT AN EXAMPLE OF THE, WHAT THE SCREEN DISPLAY WAS AFTER ONE HOUR. HOW WOULD YOU CLASSIFY THIS FLOW HERE? ONE LABELLED 'I', IN TERMS OF YOUR, YOUR CATEGORIES?
Figure MN3 Screen image: EXAMPLE - Heavy rain in the autumn at time
1.00 hours
That would be, I think that would be a, from store to output, so that I think that maybe classified as a .... That's, that's a bit more dodgy. But yes, I can see what you are trying to get to.
MN26 THAT'S WHY I ASKED YOU.
stores even, there's different types of stores really. I've said there's only these two stores but there are, of course, all the way down. And stores, I mean really include the ground, soil, puddle and vegetation. And really the output, the main output really is the actual flow of the water rather than out of the thing, rather than you know, from one to another. Yes, that would be it really. Because, I mean that's a bit dodgy, I mean straight from the puddle to the soil. ....noise .... but that's more twisted.
MN27 SOME PEOPLE HAVE LOOKED AT THESE DIAGRAMS AND. HAVE SAID: 'WELL THERE ARE BITS MISSING' I MEAN THIS IS A DIAGRAM SHOWING WHAT HAPPENS AFTER AN HOUR OF RAIN IN THE AUTUMN. ARE THERE ANY THINGS THERE THAT YOU THOUGHT, ANY EXTRA FLOWS PERHAPS, THAT YOU WOULD EXPECT TO BE THERE?
There are a few more flows, there's baseflow, .... surface flow.
MN28 IS THERE ANY SURFACE FLOW ON THE DIAGRAM AT THE MOMENT? No, there isn't.
MN29 NO, WHY NOT?
Well I suppose, what, they're trying to say is, after a day, an hour
MN30 YOU'VE HAD AN HOUR OF RAIN.
An hour of rain, all of it's been in the puddles, most of it has gone from the vegetation into the puddle and straight into the soil. But I'd rather think there would be bit of soil (surface runoff), even though, maybe there wasn't enough rain for the (surface runoff?). Also maybe the infiltration rate is much, higher it's more porous soil rather is sort of clogged together. So there be surface runoff, surface runoff, but have thought there would have been a amount, even if they, if you know, every minute.
MN31 DO YOU OFTEN SEE WATER RUNNING OVER THE SURFACE OF THE GROUND AFTER RAIN ?
course this program never did show quite a major limiting factor and that. I find that, if you know if you had different types of, if it was if it said that it was either on a slope, or at the top of it, or at the bottom of it, or wherever. You are always going to get, you are always going to get water from other sources, rather than just from puddle and vegetation. You're going to get it from other types of places. Unless you're going to think of that as a whole.
MN32 RIGHT, I'LL JUST TRY AND GET THE ORANGE PACK (WATER ON THE LAND). YES, INTERESTING POINT YOU RAISED THERE. SHALL WE GO TO THE BOOKLET, AND SEE WHAT IT SAYS (FIGURE MN3)- IT STARTS OFF EXPLAINING THE SET-UP. AND WHERE THE CONDITIONS THAT IT REPRESENTS. SO YOU GUESSED CORRECTLY THAT, IN A WAY, THAT THIS IS SUPPOSED TO BE SET AT THE TOP OF A HILL.
Figure mn4 copy of students' leaflet a from water on the land
Well, this is meant to be set on the top of the hill, maybe it could have been, it could have been altered so that it could have been a, in slightly different places. Maybe if it could have been varied, instead of putting it on top of the hill, it could have been on a slope. Then you're up the slope or maybe, maybe just flat land. (Right.) Which maybe have been or maybe even slightly undulating.
MN33 SO HOW DO YOU THINK MOVING THE PUDDLE SOMEWHERE ELSE ON THE LANDSCAPE, HOW DO YOU THINK THAT WILL CHANGE THE DIAGRAM?
Well obviously, on the top of the hill it is all going, well more or less, it's got to be a greater amount of surface flow, if there's going to be larger amount of rain. Whereas on the flat land you don't get that much, because there's no, there's no, the gravity is pulling it down below the surface. All it is, is forcing the water down into the ground. And of course it's what we were shown, because it's not exactly sloping down. I mean it it's always sloping down it's bound to get surface runoff. But maybe on flat ground you don't really get that. You don't, you may not get, it all accumulates on top and goes down straight.
Well, I'd say it'd look quite similar to it except I think. Yes, the flow would be much greater, the rate of flow would be, well the rate of overflow would be great. The flow on land, overland flow would be quite great, it would be much greater than that because of course rain is falling on there and it would get it all in one go. Whereas on the slope you would get continuous amounts. And usually it picks up until more and more comes off and usually you get a lot of flow and that on the side. Whereas on the top it is slightly flat, slightly flat so the rate of flow isn't so much.
MN35 DO YOU THINK IT WOULD HAVE ANY EFFECT ON THE FLOW DIAGRAM, WHEN YOU REPRESENT IT IN THIS SORT OF BOX FORM'? IF IT WAS PART-WAY DOWN A SLOPE DO YOU THINK THAT DIAGRAM WOULD BE CHANGED?
Yes, it would be. To quite a great extent, well a good approach to it yes. I think, I would have thought there would be quite a lot of overland, flow. Soil moisture, I would think, let's see ....
MN36 IF YOU HAD A PENCIL, HOW WOULD YOU SHOW HOW THE DIAGRAM WOULD CHANGE. WHAT WOULD YOU SORT OF ADD TO THAT SKETCH, OR HOW WOULD YOU CHANGE IT?
That's vegetation flow , definitely get that, overland flow. You'd get, you'd get throughflow, that would be, no I think that would be the same as if it was on top of the hill. Maybe just slightly greater, but then again, ....noise .... and groundwater not so much because it's more or less flat because better infiltration .... So most of the water goes in there, soil moisture, throughflow and baseflow. If it was on a slope, that would be much greater than if it was on top.
MN37 IF WE ANALYSE THIS DIAGRAM, IN TERMS OF THE INPUTS AND OUTPUTS YOU MENTIONED EARLIER. HOW MANY OUTPUTS ARE THERE?
There's, 1,2,3,4, I'd say there are four outputs.
MN38 AND WHAT ABOUT INPUTS?
Inputs, there's only one major input really. Then if you include vegetation into the puddle, and puddle into ....
MN39 NO, JUST ONE, TO THE WHOLE SYSTEM?
MN4O RIGHT, AND THAT'S FAIR ENOUGH ISN'T IT, AT THE TOP OF THE SLOPE? (YES.) WHAT ABOUT A COLUMN OF SOIL PART-WAY DOWN THE SLOPE? DO YOU THINK THERE WOULD BE THE SAME NUMBER OF INPUTS AND OUTPUTS, OR DO YOU THINK THEY WOULD ...?
You might, it depends really, I mean if you have got vegetation covering it they, it might sort of, sort of from the soil, there's vegetation there. Well I dunno, If the vegetation was there, I think the rain flow would be, the input wouldn't be so much. Not to such a great extent. The groundwater, I think most of the stuff would just stay the same,I think,
MN41 SUPPOSING YOU HAD A SECOND COLUMN OF SOIL HERE, PART-WAY DOWN THE SLOPE ON THE DIAGRAM, HOW MANY INPUTS DO YOU THINK THERE WOULD BE TO IT?
Well, there's bound to be rain. And then there's also going to be water from the top. (Right.) So there will be just two inputs instead of just the one input.
MN42 WELL, IN FACT THERE ARE THREE OUTPUTS FROM THIS COLUMN OF SOIL AREN'T THERE. THAT WATER IS ALL GOING TO MOVE DOWN SLOPE. SO IN FACT, YOU'LL HAVE THE RAIN PLUS YOU'LL HAVE THOSE AS WELL. SO THAT WILL MAKE THIS DIAGRAM MORE COMPLICATED WON'T IT?
Yes, they'd be inevitably pouring it out because every rain from here would be coming down. And also from there, those hills.
that's for an easier stage, and that's for a more difficult stage. So that works, maybe that would have been a bit better. (Okay.)
MN44. IF WE LOOK AT WHAT HAPPENS ON 'PUDDLE' IN TERMS OF GRAPHS, I'VE GOT A GRAPH HERE SHOWING THE STORE CONTENTS AGAINST TIME THERE. HERE WE'VE GOT A STORM IN SPRING, WHAT WE HAVE DONE IS, WE HAVE TAKEN FIGURES FROM THE COMPUTER PROGRAM, FROM THE PICTURE OF THE STORM, YOU CAN SEE THAT THE PROFILE OF THE RAIN DURING THE ONE HOUR STORM AT SUCCESSIVE INTERVALS OF A FEW MINUTES, MORE OR LESS RAIN, THEN SUPERIMPOSE THE GRAPH OF THE CONTENTS OF THE VEGETATION STORE, THAT SHOWS HOW THE STORE BEHAVES DURING THE STORM, DOES THAT SURPRISE YOU? HOW THAT WORKS?
Figure MN5 DEMO - Storm in spring, graph of rainfall, and vegetation store contents
No, I would think so, I would have thought yes, they usually do get the first amount, the first amount usually goes straight into the grass and other vegetation. It holds it, and after a while because the plants obviously need it, they need the water and they go straight into the roots, the water is usually absorbed by the roots. A lot of it is held in the plant, in all the nooks and crannies, the shape of the plant usually holds it and then after a while it does seep through, it does usually seep though down into the thing.
MN45 IT YOU LOOK AT THE SHAPE OF THIS CURVE, IT'S GOT THREE OR FOUR DISTINCTIVE PARTS, YOU WOULD REALLY EXPECT THE FIRST ONE - FILLS UP QUITE RAPIDLY WITH WATER INITIALLY, WHAT'S THE NEXT STAGE, CAN YOU TALK THROUGH THAT CURVE?
MN46 SO YOU SEE THIS WATER HERE, AT THE END, BEING ACTUALLY INSIDE THE PLANT?
Yes, or stored somehow, maybe in the roots.
MN47 SUPPOSING, WE ARE TALKING ABOUT A STORM IN SPRING, IF YOU ARE WALKING THROUGH A FIELD OF GRASS, AN HOUR OR TWO AFTER A STORM WHAT DO YOU THINK THE GRASS WOULD BE LIKE?
I can't remember, I think it would be quite soggy, yes very soggy, I mean when you are walking everything is going to get wet, that just shows how it does hold quite a lot of the water. Besides that I can't remember much.
MN48 IS THAT WATER IN THE PLANTS, OR WATER ON THE PLANTS?
More or less there's more water on the plants because of surface tension on the plants. Rather than, it so, you can't squeeze the water out obviously, but it's usually on the plants because of the surface tension on the leaves and everything else. It's held inside by the structure, like buttercups hold water inside and flowers, that's how it's done really.
MN49 SO THAT WATER WOULD APPEAR HOW, IF YOU ACTUALLY LOOKED AT IT? As globules, on plant stems rather than, and maybe drips obviously, dripping because it weighs too much after a while. But usually they are hanging on the underside not usually on the upperside.
MN50 WHEN COULD YOU SEE THE EFFECTS OF DRIPS THEN IN THIS DIAGRAM ON THIS GRAPH? (WELL, I WOULD START..) WHERE WOULD YOU HAVE EVIDENCE FOR SAYING THE DRIPS WERE OCCURRING?
Well obviously, the rain stops. that is a storm in April?
MN51 THAT'S THE RAINFALL FOR THE FIRST HOUR.
MN52 CAN YOU SEE EVIDENCE OF DRIPS STOPPING, AT ANY STAGE? CAN YOU SEE EVIDENCE FOR THE DRIPS ACTUALLY STOPPING AT SOME STAGE IN THIS CURVE?
Well in the whole graph I would say it would be when the actual rain has stopped so there is no more inputs into the plant. Whereas, therefore it can't get anything else. I mean if it's reached it's maximum and it's given away half of it already, then it is going to level off. I mean it doesn't have that much water to give away now. If it can hold water in, it will keep it in unless it is too much for it, and then it will flow. But seeing as there is no storm at this point, it should keep it in.
MN53 SO THAT MAKES SENSE THAT CURVE? Yes, that would make sense, yes.
MN54 RIGHT, IF I CONTINUE ADDING MY OVERLAYS, IF WE'VE GOT HERE A GRAPH FOR THE PUDDLE STORE OVER THE SAME PERIOD OF THE, HOW DO YOU SEE THAT CURVE?
Figure MN6 DEMO - Graph of storm in spring with rainfall, vegetation
and puddle contents
Slightly more unusual I would say. The puddle fills up with water quite rapidly, I would expect that because of the large influx of water at the beginning, gradual increase of water there. Constant, I don't know about it keeping constant. Maybe it does because the initial volume taken up, but I would have thought there wouldn't have that, I-would have thought there would have been a great gush of water, ....well it depends upon the soil before it.
MN55 THIS EXAMPLE IS SUPPOSED TO BE ON A CLAY SOIL. Dry..?
MN56 STARTING OFF AS A CLAY SOIL WITH A LIMITED AMOUNT OF INFILTRATION CAPACITY.
there is an influx, I suppose that is because it gets water from the particles? I would think the water coming off the plants and going into the puddle. I'm saying that, I don't know why the plants .... because they coincide, the levels coincide. I wouldn't have thought the puddle had that much. If anything, the puddle would have increased rather than decreasing.
MN57 (NONE OF) THESE ARE JUST PERCENTAGES OF CONTENTS, NOT ACTUAL HEIGHTS JUST A PERCENTAGE OF WHAT THEY COULD HOLD. CAN YOU SEE ANY REASON FOR THIS SORT OF KINK IN THE CURVE FOR THE PUDDLE AFTER A PERIOD OF TIME? IT GOES DOWN AND THEN IT GOES UP AGAIN.
Well alright, there's, alright there's water, there's water losing. It's losing water, it's beginning to lose water because of infiltration, slight infiltration and maybe runoff onto other areas, and now the vegetation is giving up it's moisture and the moisture, slight amount of moisture given off into the puddle that may have been because of a slight increase. And after that it decreases because there is no more rain literally. I would have thought, again I would have thought this curve would have been slightly more, a bit more level rather than such a steep inclination but.,..
MN58 COMING BACK TO THIS, THIS POINT HERE, CAN YOU SEE ANY RELATIONSHIP BETWEEN THIS AND SAY THE RAINFALL ALL?
Yes I suppose, maybe because at 40 or 35 (Six minute intervals.) Yes 36, then because it had a third largest amount of rain it added to the puddle and at 36 and 42, well they combined I suppose, the larger amount raised the percentage of the water in the puddle slightly. Including that with the vegetation that would have made it increase by a larger amount. And that's what gave maybe the kink to the actual curve.
MN59 FINALLY, JUST VERY QUICKLY, THAT'S THE INFORMATION FOR THE GROUNDWATER STORE, AND ALSO THE SOIL. WHAT DO YOU MAKE OF THOSE? Figure MN7 DEMO - Graph of storm in spring with rainfall, vegetation, puddle, soil and ground contents
that's most probably would have happened, because if it is saturated fully it can't hold any more than it usually can.
MN60 WHAT'S YOUR EVIDENCE FOR SAYING IT'S SATURATED FULLY. CAN YOU TELL FROM THE GRAPH?
Well it seems that, before the rain started falling it was at 44%, and at the end it was also 44%, if I'm reading it properly? (Yes, carry on, that's right). I think because the clay, because the soil is impermeable, it doesn't allow much water out or in, as a matter of fact. So what happens is anything that's been held in there is really just being kept there rather than, rather than sinking in, that's what I would have thought anyway. I don't think there would have been any great net changes or losses. I thought it would have been constant all the way through. Unless of course there was a drought or something like that.
MN61 RIGHT, WHAT ABOUT THE SOIL, HOW DOES THAT BEHAVE?
That's slightly more undulated, slightly more erratic. Yes it's taking it in and more or less giving it out, after a certain time it's more or less constant, except for those peaks in it which show really that it takes a certain amount and then somehow gives it away. And takes in a bit and takes it away, and then it levels off at the end. That would be because, most probably because there is suction pressure in the soil maybe. And after a while the soil of course not needing any really much, it levels off.
MN62 SO HOW DOES THE SOIL COMPARE SAY WITH THE BEHAVIOUR OF A PUDDLE WHICH WAS THE ORANGE LINE?
MN63 SO THERE IS QUITE A BIG CONTRAST ISN'T THERE, BETWEEN THESE TWO CURVES - FOR THE VEGETATION THE PUDDLE AND THE BEHAVIOUR OF THESE TWO CURVES?
Yes, some of the results, I think they were a bit more different to what I was expecting maybe, because if vegetation did lose it, I can't really see where it's gone. Rather I would have thought it would have gone more on the surface, because you haven't shown that, it may have gone into the ground. But it doesn't show that, it doesn't show, it might, to a great extent into the soil.
MN64 COULD IT BE FOR EXAMPLE, THAT THE SOIL STORE IS SO LARGE EVEN IF IT'S TAKEN ALL THAT WATER, IT DOESN'T MAKE MUCH CHANGE?
Yes, it's got so much water in it already that it doesn't need any more so it just becomes self saturated, it just can't take any more.
MN65 SAY YOU.... A METRE OF SOIL IN YOUR GARDEN, IF YOU HAD TO HAZARD A GUESS HOW MANY PERCENT OF THAT SOIL WAS REALLY SOLID MATERIAL AND HOW MUCH WAS SPACES, WHAT WOULD YOU GUESS?
Well the soil always has an abundant number of air spaces, I would say soil - 50%? Usually I think, I think something like that if I can remember my Biology correct. It's not much, but there's a lot of spaces in between (Right.) in between the soil.
MN66 AND ON AVERAGE OF THOSE SPACES, HOW MUCH WOULD BE TAKEN UP BY WATER, DO YOU THINK?
A lot of it, a lot of it, most of it actually. And then it will be by oxygen, and other debris, but usually a lot of it is covered in by ( ?)-
MN67 SO, IF WE SAY IN A METRE OF SOIL, AND YOU ARE SAYING ABOUT HALF IS SPACES, HOW MUCH STORAGE CAPACITY IS THERE FOR WATER?
MN68 YOUR ESTIMATE IS VERY GOOD, SO WHAT YOU ARE SAYING IS IN FACT IS THAT IN THE TOP METRE OF THE SOIL, YOU COULD HAVE UPTO 500MM, HALF A METRE OF WATER. THAT'S OKAY, THAT ONE IS WITH PORES FULL, HALF OF THAT SPACE WAS AIR, IT WOULD STILL LEAVE YOU 250MM OF STORAGE. WHEREAS YOU COULDN'T HAVE A COLUMN OF WATER QUARTER OF A METRE HIGH SITTING ON TOP OF THE GRASS, SO IT'S INTERESTING TO THINK ABOUT IT IN THOSE WAYS, AND THAT WAS WHAT THE PROGRAM WAS TRYING TO GET YOU TO THINK TOWARDS. YOU DID QUITE WELL THERE, THANK YOU VERY MUCH.
7-• 1 - — 1 — I
Water balance for 2 hours
Day Time
82:08 mm
Rain 32.88
Evapotranspiration 8.09
Overland flow 16.01
Throughflow 2.51
Base flow 0.eS
RfixH
None
SEASON
Spring Total output * 18.65
WEATHER Typical STORAGE CHANGES Vegetation Puddles Soil moisture Around water O .48 O .83 12.64 8.20 13.35 DURRinii
2 hours Total change *
* Small rounding errors may occur. Option ?
Store capacity (mm) contents (mm)
Vegetation Puddles Soil moisture Ground water Flow 1.1 3.5 250.0 100.0 maximum rate (mm/hour)* 0.54 0.03 167.64 45.20 threshold (X) Evapotranspiration
Drips and stem flow
Infiltration
1- f r- •
Day
Time
81:80
RAIN
None
eit
DURATION
2 hours
SEASON
Autumn
WEATHER
Typical
UEGTH
44% PUDL
IIEIIIIIIIIIIIIIIIIIIIIIIIIIIIIII
b
15
GROUND
mummmummumummummummumm
-4
•
Flows
V
Students' leaflet A
Water on the land
Introduction
After rain or snow falls on the ground, water follows several different paths. Some evaporates into the air, some soaks into the soil and some may run downhill over the surface.
Figure Al shows these flows on a small area of land. As it is at the top of a slope, no water can drain into it from higher ground.
Trees, crops and plants also affect the flow of water. Rain or snow may be trapped on the surfaces of plants and some water may never reach the ground. Plants also take water out of the ground and lose it to the air by transpiration.
Figure Al
Water movement on an area of land at the top of a slope.
Vertical Scale I metre
ridge crest evapo• z.---rain
transpiration[ ..' ... .."/
- overland flow • setii
infiltration
through flow
percolation
base flow downslope to stream
The flow diagram Figure A2
The flow diagram.
rain
The movement of water shown in Figure Al can also be shown in a flow diagram — see Figure A2. The 'boxes' are stores where the water is held for a while between the flows.
Al Put the missing labels on the diagram using the key below.
Key
Stores P
✓ Vegetation — also known as d Drips — throughfall — & stetnflow
store i Infiltration
P Puddles — also known as the p Percolation
surface depression/detention o Overland flow — surface runoff
store t Through flow
S Soil moisture store b Base flow G Ground water store elf Evapo-transpiration
A2 Draw a new flow diagram to show the flows and stores near the bottom of a slope. (Hint — there should be several extra flows.)
S
soil moisture
ground water
to
So e 'tea
0 I
90 "Mlle
MIRY 5
5 +.
To:b, t oe'vom SRL
30
co
puO0 L. E
Sboro to.4404.cC•fot:Ity
100 v. • e,
q.
00
PUDDLE Interview : ANDREW
Al OKAY ANDREW, NOW I HAVE LEARNT FROM THE OTHERS THAT YOU DID 'PUDDLE' ABOUT TWO MONTHS AGO. (YES.) REALLY THE BEST WAY TO START IS TO ASK YOU HOW MUCH YOU REMEMBER OF WHAT YOU DID AND WHAT THE PROGRAM DID?
The program was mainly about the hydrological cycle. Where water is evaporating, I think it was after an hour and certain measurements were taken, the depth of water after precipitation and, we could change certain aspects of it. Could change the amount of rainfall, the amount of sunshine, change the hours, the evapotranspiration, that was about it.
A2 RIGHT, THAT WAS THE FIRST PROGRAM YOU HAD USED AT ALL, EVER? Yes, the first one I had worked on.
A3 WAS IT, DID YOU FIND IT A RATHER STRANGE NOVELTY, OR DID IT SEEM QUITE NATURAL TO DO?
It was quite strange at first, not knowing any of the keys, and not knowing what to do in general, just had to sit and watch everybody else.
A4 IF SOMEONE HAD SAID YOU WOULD USE THE COMPUTER IN THE GEOGRAPHY LESSON BEFORE, WOULD YOU BELIEVE THEM, OR WOULD IT HAVE SEEMED A SENSIBLE THING TO DO?
I wouldn't have thought, it's not really a normal sort of thing to do, but I think it's quite useful.
A5 IN YOUR TEXTBOOKS YOU HAVE GOT A SIMILAR DIAGRAM, IN THE BOOK THAT YOU HAVE ON THE SCREEN IN 'PUDDLE'. DO YOU THINK PLAYING AROUND WITH COMPUTER PROGRAMS IS A GOOD WAY TO START? DO YOU THINK YOU COULD HAVE LEARNT THE SAME SORT OF THINGS FROM THE BOOK, PERHAPS MORE QUICKLY?