Slip model of the 2008
M
w7.9 Wenchuan (China) earthquake derived from
co-seismic GPS data
Faqi Diao1,2, Xiong Xiong1, Rongjiang Wang3, Yong Zheng1, and Houtse Hsu1
1Key laboratory of Geodesy and Geodynamics, Institute of Geodesy and Geophysics, Chinese Academy of Sciences, Wuhan 430077, China
2Graduate School, Chinese Academy of Sciences, Beijing 100049, China 3GFZ German Research Centre for Geosciences, D-14473 Potsdam, Germany
(Received October 10, 2008; Revised April 26, 2009; Accepted May 5, 2009; Online published January 26, 2011)
Near-field co-seismic GPS data were used to derive the slip distribution of the 12 May 2008 Wenchuan earthquake. Based on field measurements and geological observations, the earthquake is represented by ruptures on the Beichuan fault and a neighboring fault from Pengxian to Guanxian, both dipping with a decreasing angle with depth. Using a layered elastic crust model, we obtained a slip model that not only best fits the co-seismic GPS data but which also shows general consistency with the surface ruptures observed from the field survey. The slip maxima are dominant at a very shallow depth near Beichuan and Jiangyou, although the exact peak value of the slip distribution is not well constrained due to the inhomogeneous data coverage in the near-fault area. The maximum slip in our inversion is thus limited to about 9 m, as estimated from the field measurement, but no strict restriction is applied to the slip direction, i.e., the rake angle. The slip model yields a moment magnitude that is very close toMw = 7.9, which is the estimate based on teleseismic observations. Near the hypocenter,
the slip exhibits reverse behavior. The major rupture near Beichuan involves both right-lateral strike-slip and reverse components. Slip on the secondary fault is dominated by the reverse component with a maximum of approximately 2–3 m.
Key words:Wenchuan earthquake, slip model, inversion, GPS data.
1.
Introduction
The 12 May 2008 Mw7.9 Wenchuan earthquake
oc-curred in Sichuan province, southwest China. It is con-sidered to be one of the most destructive events that have occurred in China during the last 50 years, at least 80,000 killed, more than 350,000 injured and countless homeless.
The Wenchuan earthquake ruptured the NE-SW striking and north-west dipping Longmenshan fault belt, which was formed by the continuing eastward extrusion of the Tibet plateau to the western edge of the Sichuan Basin (Zhang et al., 2008). The Longmenshan fault belt comprises three main faults; from NW-SE, these are the Wenchan-Maowen fault, the Yingxiu-Beichuan fault and the Dujiangyan-An’xian fault. Both the geological study by Burchfiel et al. (2008) and the GPS observations by Zhang (2008) in-dicate that long-term movement on the Longmenshan fault changes from the reverse slip in the SW to the right-lateral strike-slip in the NE. The field survey revealed that the Wenchuan earthquake mainly occurred on the Beichuan fault, with a rupture length more than 200 km, and on a neighboring secondary fault from Pengxian to Guanxian, with a rupture length over 60 km (Liuet al., 2008; Zhanget al., 2008).
The rupture process and the slip distribution have been
Copyright cThe Society of Geomagnetism and Earth, Planetary and Space Sci-ences (SGEPSS); The Seismological Society of Japan; The Volcanological Society of Japan; The Geodetic Society of Japan; The Japanese Society for Planetary Sci-ences; TERRAPUB.
doi:10.5047/eps.2009.05.003
estimated by Ji and Hayes (2008) and Nishimura and Yagi (2008) from teleseismic waveform inversion. They found that the best-fit strike and dip angles are 229◦ and 33◦, respectively, and the maximum slip reaches up to 9 m. Teleseismic body waves, which contain information on the moment release rate and focal mechanism, can be used to provide smoothed estimates of slip distribution, but they do not provide near-field information, such as the static offsets, which is critical in co-seismic slip inversion (Miyazakiet al., 2004).
Geodetic inversion has been improved from being an averaged slip estimation of one or several fault planes to slip distribution estimation of multiple finite discrete fault patches, based on sufficient near-field constraints (Segall and Davis, 1997). That is to say, slip distribution can be estimated with high spatial resolution from the geodetic data, which may compensate for the deficiency of near-field information in the teleseismic waveform data. Moreover, a more highly resolved slip model is particularly useful for estimating the Coulomb stress change on surrounding faults and, consequently, for assessing seismic hazard. In this paper, we derive the slip distribution of the Wenchuan earthquake from the near-field co-seismic GPS observation by employing a listric fault geometry and a layered earth model.
2.
Data Compilation
We use the static coseismic GPS displacement data ob-tained by the Working Group of the “Crustal Motion
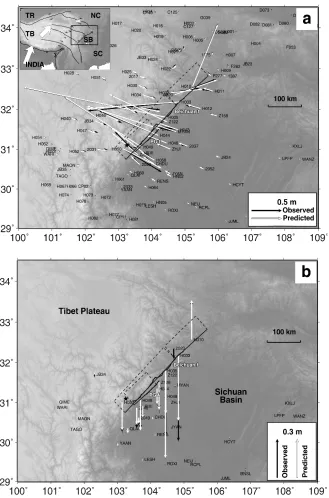
Fig. 1. Observed and predicted coseismic horizontal displacements of the 122 GPS stations and vertical displacements of 44 GPS stations used in the study. Some vectors with displacements of a few millimeters that are far from the rupture are not shown in thefigure. Error ellipses indicate 50% confidence intervals. (a) Horizontal displacements (b) Vertical displacements. Black star is the epicenter. Dashed rectangles show the surface projection of the model fault planes. The two solid black lines denote the main rupture on the Beichuan fault (Beichuan f) and the secondary rupture on the Pengxian-Guanxian fault (PG f). Tectonic setting of the Longmenshan fault is shown in the inset of (a), TR: Tarim Basin; TB: Tibet; SB: Sichuan Basin; NC: North China; SC: South China.
servation Network of China”Project (2008) with the obser-vations carried out before and after the earthquake in the earthquake area (Fig. 1). These GPS data were processed by the GAMIT software based on the double difference model and IGS precision ephemeris. As a result, the hor-izontal components of the coseismic displacement could be determined at 122 GPS s. However, due to uncertainties of antenna setups and/or low signal-to-noise ratios at some campaign-surveyed GPS stations, the vertical component is only available at 44 stations. Some campaign-surveyed sta-tions were manned a few days after the earthquake.
There-fore, the obtained coseismic displacements may include a small part of the postseismic deformation, which may lead to an overestimated coseismic slip.
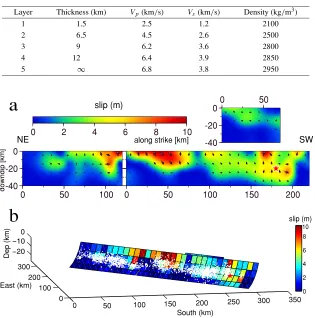
displace-Layer Thickness (km) Vp(km/s) Vs(km/s) Density (kg/m3)
Fig. 2. (a) Plane view of the slip distribution on the main fault (bottom) and on the secondary fault (top right). White arrows denote the slip vectors. Red star is the hypocenter. (b) Three-dimensional geometry of the main fault and discrete slip on patches. The white dots show aftershocks up to 22 July 2008 (Huanget al., 2008).
ments of stations on the hanging wall are more complex. The maximum GPS displacement is 2.5 m, measured near
Beichuan. Most large displacements were measured in
Jiangyou, Qingchuan and Wenchuan, with a magnitude of approximately 1–2 m.
3.
Method
3.1 The gradient method with a priori constraints
We derive the slip distribution from the co-seismic GPS data using the inversion code SBIF (sensitivity-based
itera-tive fitting) proposed by Wanget al.(2006). The technique
used in this code is similar to the constrained gradient ap-proach as used by Ward and Barrientos (1986) to minimize the misfit function under a priori constraints. The misfit function, also called the cost function, is defined by
f(s)= two components along the strike and dip directions, respec-tively. The a priori constraint is given in the following gen-eral form
wheresmax is the estimated maximum slip amplitude, and
ϕminandϕmaxare the minimum and maximum rake angles,
respectively. In many cases, particularly when a large num-ber of discrete slips are selected, the a priori constraint may not be sufficient for a unique solution of the slip distribu-tion. Even if such a unique solution exists, it may be unsta-ble and physically unreasonaunsta-ble. Therefore, additional arti-ficial constraints are often necessary. A commonly applied approach in various inversion methods is to add a penalty term to the cost function so that certain physical properties, such as the roughness of the slip distribution, are minimized at the same time. In the SBIF method, the solution is found by iteratively minimizing the misfit function (Eq. (1)) under the a priori condition (Eq. (2)). The iteration is terminated when the misfit is acceptable, and the approximated slip dis-tribution is reasonably smooth.
3.2 Parameter setting
We use a vertically stratified and laterally homogeneous crust model in this study. The parameters are taken from
CRUST2.0 (Mooney et al., 1998) (see Table 1). Based
on the aftershock distribution (Huanget al., 2008) and the
mapped surface ruptures identified in the field survey (Liuet
al., 2008; Zhanget al., 2008), we then design a double-fault
source model. The main Beichuan fault is divided into two
segments: the NE segment is 120 km, striking N228.5◦E,
and the SW one is 220 km, striking N224◦E. The secondary
0
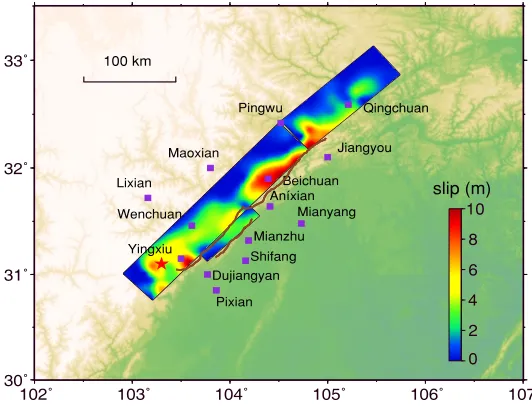
Fig. 3. Surface projection of the slip distribution. The thick brown lines illustrate the surface rupture from the field measurements of Liuet al.(2008) and Zhanget al.(2008). Purple squares represent badly damaged cities near the fault.
0
Fig. 4. Comparison between the estimated fault slip and the surface ruptures (Liuet al., 2008). The black solid line is the estimated fault slip and the black dashed line is the surface rupture. (a) The main rupture of the Wenchuan earthquake. (b) The secondary rupture to the SE of the main rupture. The zero point of (a) is the projection of the epicenter and the zero point of (b) is the SW endpoint of the secondary fault. The direction of theX-axis is from the SW to the NE along the two faults. The cities in the figure correspond to those represented in Fig. 3.
to Guanxian, with the strike N228.5◦E (Fig. 1). Geological studies (e.g., Burchfielet al., 2008) have revealed that the Longmenshan fault has a listric geometry, i.e., with a dip angle decreasing with depth. Accordingly, we set the dip angle to decrease linearly from 65◦at the top of the curved fault plane to 20◦at the bottom. A fault width of 40 km is assigned to all three fault segments, which are then divided into uniformly sized rectangular dislocation patches of 10× 10 km. Fixing these geometrical parameters, we then invert the slip distribution from the GPS data (request for digital slip model should be addressed to F. Diao).
4.
Results and Discussion
The slip model for the Wenchuan earthquake inverted from the GPS data is shown in Fig. 2. On the main fault segment, the slip distribution is mainly characterized by re-verse rupturing, with the maximum amplitude, 5 m, located near the hypocenter, and an amplitude of approximately 2– 3 m located at the down-dip of the hypocenter. This turns to a right-lateral strike-slip and reverse slip northeastwards with an almost uniform rake angle of 135◦, which is con-sistent with the teleseismic results (Ji and Hayes, 2008). Most large slips, with a maximum of about 9 m, are lo-cated at the shallow patches near Beichuan, Jiangyou and Wenchuan where heavy damage occurred (Fig. 3). Two
ar-eas with large slip are separated by patches with smaller slip in the central section of the main fault. This seems to be consistent with the results from the teleseismic analy-sis which indicate that the earthquake is composed of two major sub-events. In general, the slip is concentrated at a shallow depth of less than 15 km, except for some deep patches near the epicenter. This pattern considerably dif-fers from that found in all teleseismic models. The slip on the secondary fault shows reverse behavior with a slip of approximately 2–3 m occurring near the surface. The
seis-mic moment (Kanamori, 1977) is estimated to be 0.92×
1021 N m, which corresponds to M
w∼7.91. This is
con-sistent with the seismic results by Ji and Hayes (2008) and
Nishimura and Yagi (2008), which are 1.15×10²¹N m and
0.91×10²¹N m, respectively.
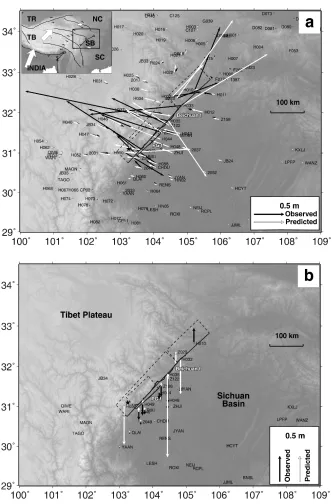
Fig. 5. Comparison between forward-modeled displacements from Ji and Hayes’seismic source model and observed coseismic displacements. Error ellipses of the observed displacements indicate 50% confidence intervals. (a) Horizontal displacements. (b) Vertical displacements.
Geological studies (Burchfielet al., 2008; Zhanget al., 2008) indicate that the Longmenshan fault has a listric ge-ometry with the dip angle decreasing with depth. If a uni-form dip angle of 33◦ is used, as suggested by the teleseis-mic results, the misfits between calculated and observed co-seismic displacements are 2.16 and 3.2 cm in the two hori-zontal components and 10.32 cm in the vertical component. If the listric fault geometry is used, however, the misfits de-crease substantially to 1.28, 1.52 and 4.05 cm, respectively. The aftershocks are mostly concentrated in the deep patches with small coseismic slip (Fig. 2). We hypothesize that the deep segments of the Wenchuan fault only partially rup-tured during the coseismic rupture process and that the slip deficit is released by aftershocks or aseismic afterslip. This
phenomenon was demonstrated by Cakiret al.(2003) for the Izmit earthquake and Hsuet al.(2002) for the Chi-Chi earthquake. Further study on afterslip based on postseismic deformation may provide some evidence for this hypothe-sis.
or to what extent—the near-field coseismic GPS displace-ments can be explained by seismic source model, we ran forward modeling using Ji and Hayes’slip model (Fig. 5). We found that the observed near-field coseismic displace-ments, especially at some stations close to the rupture plane, cannot befitted well by Ji and Hayes’slip model in terms of both amplitude and direction. It is well known that the tele-seismic waveform inversion may be robust for determining the source time function and the average focal mechanism, while the geodetic inversion is more robust for resolving the spatial distribution of the fault slip. However, it should also be noted that most of the geodetic observations were carried out a few days after the earthquake in this study. Therefore, the signal is contaminated by postseismic dis-placements, which may lead to an over-estimated fault slip. A method integrating both near-field geodetic information and far-field seismic information should provide more reli-able results.
The listric double-fault source model can explain most of the observed coseismic displacements, especially in the hor-izontal components (Fig. 1). The RMS (root mean square) misfits are 1.28, 1.52 and 4.05 cm, in the EW, NS and ver-tical components, respectively. These are still significantly larger than the mean observation uncertainties (1σ) of 3.0, 3.0 and 7.0 mm, respectively. In addition, from our com-parison of observed and forward horizontal displacements (Fig. 1(a)), we found that the residuals are spatially coher-ent. The inverted slip model overestimates the footwall dis-placements at 47 of 60 sites (78%). Many factors may cause the large residuals, such as the assumption of lateral homo-geneity in the earth model, the simplicity of the fault geom-etry, topography and inelastic deformation. For example, the crustal thickness of the Tibet plateau on the NW side and the Sichuan basin on the SE side of the Longmenshan fault are about 70 km and approximately 40–45 km, respectively, with the mean crustal P velocity of approximately 6.25– 6.30 km/s and approximately 6.45–6.50 km/s, respectively (Tenget al., 2008). Furthermore, the topographic differ-ence between the Tibet plateau and the Sichuan basin is almost 3500 m, which may also influence the surface dis-placements. The higher misfit in the vertical component may also be attributed to the lower precision of GPS in the vertical direction.
5.
Conclusion
Constrained by the near-field GPS co-seismic displace-ments, the slip distribution of the Wenchuan earthquake is estimated based on the layered elastic dislocation model. With the introduction of a listric fault geometry, the de-rived double-fault slip model can explain most of the ob-served GPS displacements. The results are consistent with the teleseismic results and thefield measurement. The slip in our model shows reverse behavior, with a slip magni-tude of approximately 4–5 m near the epicenter, varying to a right-lateral strike-slip with a significant reverse compo-nent in the NE, with two slip maxima of up to 9 m located near Wenchuan and Jiangyou, respectively. The modeling result is also consistent with the historical fault movement mapped by GPS andfield observations.
Acknowledgments. We are grateful for the constructive com-ments of Dr. Isabelle Ryder, an anonymous reviewer and the editor Prof. Teruyuki Kato. This work was supported by the Knowl-edge Innovation Program of the Chinese Academy of Sciences (KZCX2-YW-142, KZCX3-SW-153) and the National Natural Science Foundation of China (40474028). Thefigures were made using free GMT (Generic Mapping Tools) software (Wessel and Smith, 1991).
References
Burchfiel, B. C., L. H. Royden, R. D. van der Hilst, B. H. Hager, Z. Chen, R. W. King, C. Li, J. Lu, H. Yao, and E. Kirby, A geological and geophysical context for the Wenchuan earthquake of 12 May 2008, Sichuan, People’s Republic of China,GSA Today,18, 4–11, 2008. Cakir, Z., J. B. Chablier, R. Armijo, B. Meyer, A. Barka, and G. Peltzer,
Coseismic and early post-seismic slip associated with the 1999 Izmit earthquake (Turkey), from SAR interferometry and tectonicfield obser-vations,Geophys. J. Int.,155, 93–110, 2003.
Hsu, Y. J., N. Bechor, P. Segall, S. B. Yu, L. C. Kuo, and K. F. Ma, Rapid afterslip following the 1999 Chi-Chi, Taiwan Earthquake,Geophys. Res. Lett.,29, 1–4, 2002.
Huang, Y., J. P. Wu, T. Z. Zhang, and D. N. Zhang, Relocation of theM
8.0 Wenchuan earthquake and its aftershock sequence,Sci. China Ser. D-Earth Sci.,51, 1307–1311, 2008.
Ji, C. and G. Hayes, Preliminary result of the May 12, 2008Mw7.9 east-ern Sichuan, China earthquake, http://earthquake.usgs.gov/eqcenter/ eqinthenews/2008/us2008ryan/finite fault.php, 2008.
Kanamori, H., The energy release in great earthquakes,J. Geophys. Res., 82, 2981–2987, 1977.
Liu, J., Z. H. Zhang, L. Wen, J. Sun, X. C. Xing, G. Y. Hu, Q. Xu, P. Tapponier, L. S. Zeng, L. Ding, and Y. L. Liu, TheMs8.0 Wenchuan earthquake co-seismic rupture and its tectonic implications—An out-of-sequence thrusting event with slip partitioned on multiple faults,Acta Geol. Sinica,82, 1–16, 2008 (in Chinese).
Miyazaki, S., K. M. Larson, K. Choi, K. Hikima, K. Kazuki, P. Bodin, J. Haase, G. Emore, and A. Yamagiwa, Modeling the rupture process of the 2003 September 25 Tokachi-Oki (Hokkaido) earthquake using 1-Hz GPS data,Geophys. Res. Lett.,31, 1–4, 2004.
Mooney, W. D., G. Laske, and T. G. Masters, CRUST 5.1: A global crustal model at 5◦×5◦,J. Geophys. Res.,103, 727–747, 1998.
Nishimura, N. and Y. Yagi, Rupture process for May 12, 2008 Sichuan earthquake (preliminary result), http://www.geol.tsukuba.ac.jp/ ˜nisimura/20080512/, 2008.
Segall, P. and J. L. Davis, GPS applications for geodynamics and earth-quake studies,Ann. Rev. Earth Planet. Sci.,25, 301–336, 1997. Teng, J. W., D. H. Bai, H. Yang, Y. F. Yan, H. S. Zhang, Y. Q. Zhang, and
X. M. Ruan, Deep processes and dynamic responses associated with the WenchuanMs8. 0 earthquake of 2008,Chinese J. Geophys.,51, 1385– 1402, 2008 (in Chinese).
Wang, R., Y. Xia, H. Grosser, H. U. Wetzel, H. Kaufmann, and J. Zschau, Das 2003 Bam Erdbeben: Prazise Herdparameterbestimmung¨ mit Hilfe der differentiellen Radar-Interferometrie,Zweijahresbericht, GeoForschungsZentrum Potsdam, 2006.
Ward, S. N. and S. Barrientos, An inversion for slip distribution and fault shape from geodetic observations of the 1983, Borah Peak, Idaho, earth-quake,J. Geophys. Res.,91, 4909–4919, 1986.
Wessel, P. and W. H. F. Smith, Free software helps map and display data,
Eos Trans. AGU,72, 445–446, 1991.
Working Group of the“Crustal Motion Observation Network of China” Project, The coseismic displacementfield of 2008 Wenchuan earth-quake observed by GPS technique,Sci. China Ser. D-Earth Sci.,38, 1195–1206, 2008 (in Chinese).
Zhang, P. Z., The recent tectonic deformation, strain distribution and deep dynamic processes in eastern margin of the Tibet plateau,Sci. China Ser. D-Earth Sci.,38, 1041–1056, 2008 (in Chinese).
Zhang, P. Z., X. W. Xu, X. Z. Wen, and Y. K. Ran, Slip rates and re-currence intervals of the Longmen Shan active fault zone, and tectonic implications for the mechanism of the May 12 Wenchuan earthquake, 2008, Sichuan, China,Chinese J. Geophys.,51, 1066–1073, 2008 (in Chinese).