Cite as: Can Urol Assoc J 2017;11(5):E215-21. http://dx.doi.org/10.5489/cuaj.4192 Published online May 9, 2017
Abstract
Introduction: We aimed to develop a scoring system to quantify the distance between the renal hilum and renal tumour, termed the modified C index (m-CI), and to predict renal functional loss (RFL) following laparoscopic partial nephrectomy (LPN).
Methods: The m-CI was measured by using computed tomography in 113 patients who underwent LPN between May 2003 and June 2014. The RFL following LPN was calculated by examining the estimated glomerular filtration rate (eGFR) and radioisotope renog-raphy one year postoperatively. The Pythagorean theorem was used to calculate the distance from the tumour centre to the renal hilum. The distance was divided by the tumour radius to obtain the m-CI. The correlation between the m-CI and the postoperative RFL were evaluated using Pearson’s coefficient values. Multivariate logistic regression models were used to assess the potential predictive fac-tors of RFL following LPN. The correlation between the m-CI and the operative time, ischemia time, and blood loss during LPN were also evaluated by the unpaired t-test.
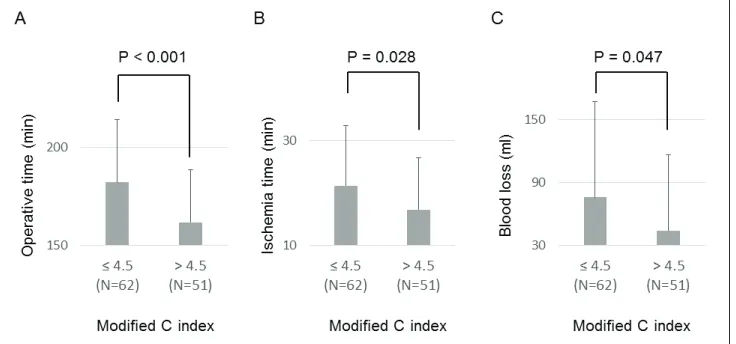
Results: Pearson’s coefficient values between the postoperative RFL and the m-CI and C index were 0.294 and 0.173, respec-tively. In the multivariate analysis, the resected volume (p=0.031) and m-CI (p=0.036) significantly correlated with the postoperative RFL following LPN. The operative time (p<0.001), ischemia time (p=0.028), and blood loss (p=0.047) during LPN was significantly longer and larger, respectively, in the group with shorter m-CI (≤4.5) than in the group with the longer m-CI (>4.5).
Conclusions: The present study demonstrates that the m-CI can predict RFL following LPN, as well as the surgical difficulty.
Introduction
In the last two decades, partial nephrectomy (PN) has emerged as a treatment that is oncologically equivalent to radical nephrectomy in most cases of localized renal cell
carcinoma (RCC) in terms of cancer-specific1,2 and overall
survival.2 Therefore, initially open nephrectomy and later
laparoscopic PN (LPN) have been widely accepted as
stan-dard treatment options for localized renal tumours.3,4 With
the increased use of LPN, sparing renal function following LPN has become the most critical issue, in addition to the
oncological outcome.5,6
Renal functional loss (RFL) following LPN has been well-evaluated and several reports have attempted to pre-dict RFL following LPN on the basis of preoperative infor-mation. Some anatomical classification systems, such as
the Centrality index (C index),7 Preoperative Aspects and
Dimensions Used for an Anatomical (PADUA)
classifica-tion system,8 and R.E.N.A.L. nephrometry score,9 have been
developed. These systems allow for comparisons of data between reports and have become almost a standard require-ment for clinical studies on renal tumours. In addition, recent studies have indicated that these anatomical scoring systems
can predict the technical difficulty of LPN,10 the risk of
sur-gical perioperative complications,8,11 and ischemia time12
during LPN on the basis of renal anatomical characteristics. So far, several studies have validated the accuracy of these anatomical scores in predicting postoperative RFL; however, the ability of these scoring systems to predict postoperative
RFL is still controversial.10,12-15 Some previous studies have
indicated that these scoring systems fail to predict RFL after LPN10,12,13 and that there are few indices designed to predict
RFL after LPN. Accurate prediction of RFL after LPN is crucial when choosing the optimal treatment for renal tumours and minimizing RFL during LPN.
The C index represents the distance between the renal
centre and renal tumour.7 However, based on the principles
of renal anatomy, the distance between the renal hilus and renal tumour would have a greater influence on the RFL following LPN. Therefore, to predict RFL following LPN, the present study aimed to modify the C index to quantify the distance between the renal hilum and the renal tumour, termed the modified C index (m-CI), and to validate the accuracy and superiority of the m-CI.
Hiroki Ito, MD; Kazuhide Makiyama,
MD, PhD; Takashi Kawahara, MD; Kimito Osaka, MD; Koji Izumi, MD;
Yumiko Yokomizo, MD; Noboru Nakaigawa, MD; Masahiro Yao, MD
Department of Urology, Yokohama City University Graduate School of Medicine, Yokohama, Japan
Methods
Patients
One hundred and forty-five consecutive patients with solitary renal tumours that were suspected to be RCC cT1aN0M0 who underwent LPN at Yokohama City University Hospital between May 2003 and June 2014 were retrospectively reviewed. Among them, 113 patients who underwent a renogram one year postoperatively were enrolled in the pres-ent study. All procedures were performed with the arterial clamping method by a single surgeon.
According to our hospital’s criteria for selecting the sur-gical method for RCC, the main indication for LPN (both transperitoneal and retroperitoneal approaches) is RCC cT1N0M0. The choice of approach is based on the tumour location. Among LPN cases, the retroperitoneal approach is chosen for tumours located on the posterior side of the kidney, while the transperitoneal approach is chosen for all other tumours. For cT2-T3aN0M0 RCC, as well as cT1 tumours located at the central part of the kidney, open PN or open/laparoscopic radical nephrectomy is indicated.
This study (#B110901012) was approved by the ethics committee of Yokohama City University Hospital. Written informed consent was obtained from all patients for their data to be used for research purposes.
Surgical techniques
The details of the surgical techniques in our hospital have
been previously reported in detail.16,17 Briefly, after Gerota’s
fascia is opened, the renal capsule is visualized around the tumour. After visualization with ultrasound, the renal capsule is cut in a monopolar fashion around the tumour. After the renal artery is clamped with a bulldog clamp, cold cut-ting by scissors into the renal parenchymal boundary of the tumour is performed with an optimal surgical margin (a few mm). After retrograde injection of diluted indigo carmine, continuous suturing of the opened collecting system and transection of the major vessel is performed with intracor-poreal knot-tying. Parenchymal suturing is performed in a continuous fashion. The 20–30 cm length of thread is used, and a knot is made at the end of the thread. A large Hem-o-lok polymer clip (Weck Closure System, Research Triangle Park, NC, U.S.) is attached on the proximal side of the knot. Before the thread is tightened or cinched, the parenchyma is sutured in a running fashion with three or four stitches without any bolster so that the renal bed is kept in its natural position during the suturing. The thread is tightened from the distal to proximal end with application of suitable ten-sion. Subsequently, the tightened thread is fixed with a large Hem-o-lok, one stitch at a time.
Development of m-CI (Fig. 1)
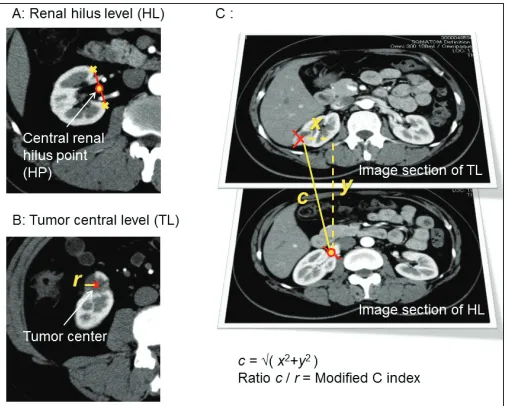
All patients underwent contrast-enhanced computed tomog-raphy (CT) scanning before LPN. The m-CI and C index were calculated for all tumours using high-resolution arterial con-trast phase images. To measure the m-CI, transverse image sections obtained by standard two-dimensional CT images were used, as well as C index measurement. The widest part of the renal hilum on the image section was identified as the central renal hilum level (HL), and the midline of the central renal cortex at this transverse level was identified as the central renal hilum point (HP, Fig. 1A). The largest tumour diameter on the images section was identified as the tumour
central level (TL), and the tumour radius (r) was determined
at this level (Fig. 1B). The vertical distance between HL and
TL (y) was calculated by using the CT slice number of each
transverse image section of HL and TL (Fig. 1C). The distance between the tumour centre and 90-degree axial reference
point of the HP at the TL section (x) was measured (Fig. 1C).
To perform this step accurately, the cursor was stabilized on the HP during scrolling in the same way as the C index was
measured previously.7 The Pythagorean theorem was used to
calculate the distance c based on the equation, √(x2+y2)=c.
The m-CI was obtained by dividing c by r (Fig. 1C).
Fig. 1. The methodology of the modified C index (m-CI) measurement. (A) Image section of the renal hilum level (HL). Yellow circle outlined by red is the central renal hilum point (HP), which indicates the midline of the most central renal cortex (yellow cross) at the image level showing the widest renal hilum; (B) the image section of the tumour central level (TL) showing the largest tumour diameter. A red cross marks the center of the tumoru, and tumour radius (r) is measured at this section; (C) the vertical distance between the image section of HL and TL (y) was calculated by the CT slice number of each transverse image section of HL and TL. The distance between the tumour centre and 90-degree axial reference point of HP at the section of TL (x) was measured. The distance c was calculated based on the equation, √(x2+y2)=c, and the ratio
Clinical parameters
The m-CI, C index and the R.E.N.A.L. nephrometry score 9
were examined as possible factors for predicting postoperative RFL following LPN. The other clinical factors analyzed in the present study included the maximum tumour diameter, lapa-roscopic approach (transperitoneal or retroperitoneal), opera-tive time, volume of bleeding, weight of the specimen, and postoperative pathological findings, including the histological subtypes. In addition to m-CI and C index, the R.E.N.A.L. nephrometry score and the tumour diameter were measured by a urologist (Hiroki Ito) using preoperative CT scans.
Renal functional outcome
All enrolled patients underwent the renal functional reno-gram examination using technetium-99m-mercaptoacetyl-triglycine (Tc99m-MAG3) and blood examination one year postoperatively. We calculated eGFR using the four-variable Chronic Kidney Disease Epidemiology Collaboration (CKD-EPI) equation, which has been suggested to be more accurate
than the modification of diet in the renal disease equation.18
The postoperative renal function of the treated kidney was calculated by multiplying eGFR one year postoperatively by the split renal function ratio (%) measured by renal Tc99m-MAG3 renogram one year postoperatively. The preopera-tive renal function of the treated kidney was determined as the preoperative eGFR divided in half. The rate of RFL of the treated kidney was measured by the postoperative renal function of the treated side divided by the preoperative renal function as follows:
The rate of RFL of the treated kidney=postoperative esti-mated glomerular filtration rate (eGFR)/preoperative eGFR of the treated kidney=(eGFR one year postoperatively x split renal function ratio (%))/half of the preoperative eGFR.
Statistical analysis
Statistical analysis was performed using the Statistical Package for Social Sciences, version 22 (SPSS Inc., Chicago, IL, U.S.). The patient characteristics and preoperative factors were analyzed using the unpaired t-test and chi-square test.
Pearson’s coefficient was used to measure the correla-tion between postoperative RFL and the m-CI or C index. The cutoff points used for categorizing the m-CI, resected volume, blood loss, and operative time were set according to the highest values of both the sensitivity and specific-ity determined from the receiver operating characteristics (ROC) curve. Univariate and multivariate logistic regression models were used to assess the potential predictive factors of RFL following LPN. The factors that showed correlation in the univariate analysis (p<0.1) were used in multivariate
analysis. In all statistical tests, p<0.05 was considered
sig-nificant. The correlation of the m-CI and the operative time, ischemia time, and blood loss during LPN was also evalu-ated by the unpaired t-test. Pearson correlation analysis was used for comparison of m-CI to test the reproducibility of the m-CI measurements.
Results
RFL following LPN and patients’ backgrounds
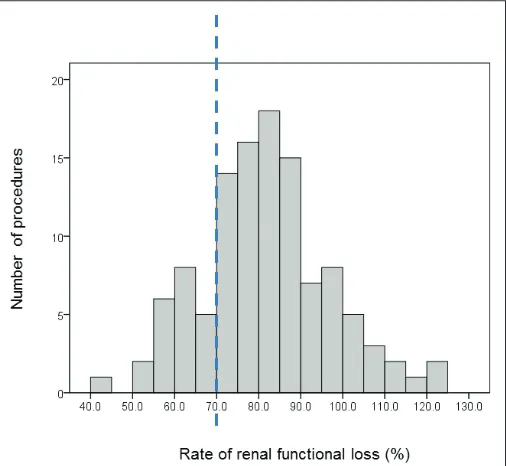
The mean rate of RFL of the treated side following LPN was 81.73% (standard deviation 15.10). The first quartile, median, and third quartile were 72.05, 81.12, and 90.07%, respectively. The histogram of the rate of RFL showed two bimodal curves (Fig. 2) and approximately 70% (near the first quartile value) was found to be an ideal cutoff point for the rate of RFL. Therefore, in the present study, we defined the patients with RFL less than the first quartile value, 72.05%, as the poor functional group, and more than 72.05% as the good functional group.
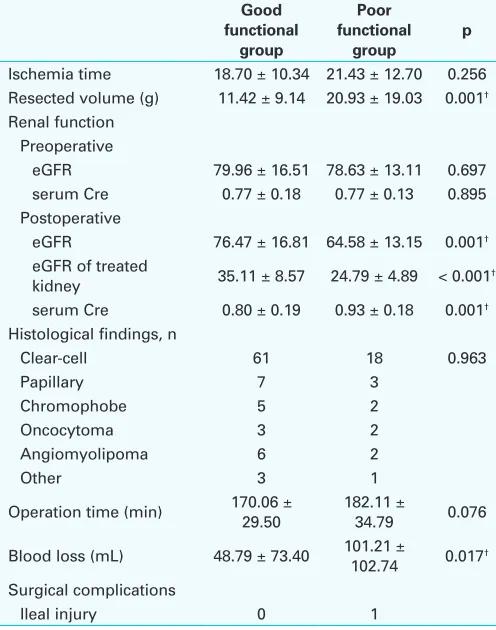
The patients’ backgrounds and tumour factors in the poor and good functional groups are shown in Table 1. The m-CI (p=0.001) and C index (p=0.046) were significantly smaller in the poor group (3.70 ± 1.00 and 2.98 ± 1.09 mm, respectively) than in the good functional group (4.69 ± 1.93 and 3.75 ± 1.93, respectively). The resected volume (p=0.001), maximum tumour diameter (p=0.002), and blood loss (p=0.017) were significantly larger in the poor group
(20.93 ± 19.03 g, 28.46 ± 7.81 mm, and 101.21 ± 102.74 mL, respectively) than in the good functional group (11.42 ± 9.14 g, 23.20 ± 7.51 mm, and 48.79 ± 73.40 mL, respective-ly). No difference was observed in the total R.E.N.A.L. score (p=0.913), except for the E score (p=0.028) or ischemia time (p=0.256) between the poor and good functional groups.
Surgical complications
In terms of surgical complications, an ileal injury caused by trocar insertion was observed in one case (Table 1) and treated by suturing the injured site during surgery and sub-sequent antibiotic treatment (Clavien-Dindo Classification Grade IIIb).
ROC curve analysis of clinical factors to predict RFL following LPN
Since the m-CI, resected volume, blood loss, and operative time showed the highest sensitivity and specificity in the ROC curve at 4.5, 15 g, 60 mL, and 200 min, respectively
(Fig. 3); these values were set as the cutoff point in the sub-sequent analyses.
Correlation between postoperative RFL and m-CI or C index
The values of Pearson’s coefficient between postoperative RFL and both the m-CI and C index were 0.294 and 0.173, respectively.
Univariate and multivariate analyses of factors to predict postoperative
RFL following LPN
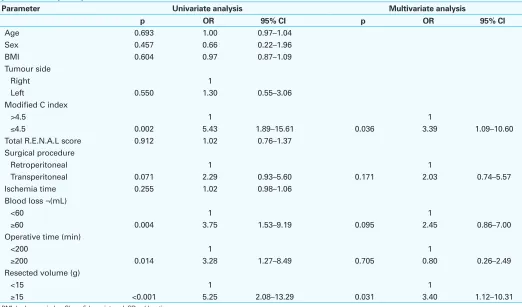
Univariate assessment showed that the m-CI (p=0.002), surgical procedure (p=0.071), blood loss (p=0.004), oper-ative time (p=0.014)p and resected volume (p<0.001) were significantly associated with the postoperative RFL following LPN (p<0.1; Table 2). In the multivariate analy-sis, resected volume (p=0.031) and m-CI (p=0.036) were significantly correlated with postoperative RFL following LPN (p<0.05; Table 2).
Table 1. Comparison of patient characteristics and pre- and perioperative factors between those with good and poor renal function (n=113)
No. of patients 85 28
Age (years) 57.22 ± 12.50 58.32 ± 13.85 0.695 Sex, n
Table 1 (cont’d). Comparison of patient characteristics and pre- and perioperative factors between those with good and poor renal function (n=113)
Good
Ischemia time 18.70 ± 10.34 21.43 ± 12.70 0.256 Resected volume (g) 11.42 ± 9.14 20.93 ± 19.03 0.001†
Renal function Preoperative
eGFR 79.96 ± 16.51 78.63 ± 13.11 0.697 serum Cre 0.77 ± 0.18 0.77 ± 0.13 0.895
Operation time (min) 170.06 ± 29.50 182.11 ± 34.79 0.076
Blood loss (mL) 48.79 ± 73.40 101.21 ± 102.74 0.017†
Surgical complications
Ileal injury 0 1
†Significant differences between two groups as determined by unpaired t-test,
Correlation between the m-CI and the operative time, ischemia time,
and blood loss during LPN
The operative time and ischemia time of LPN was
significant-ly longer in the group with shorter m-CI (≤4.5) than in the
group with the longer m-CI (>4.5) (p<0.001 and p=0.028,
respectively; Figs. 4A, 4B). The blood loss during LPN was
significantly larger in the group with shorter m-CI (≤4.5) than
in the group with the longer m-CI (>4.5) (p=0.047; Fig. 4C).
Table 2. Univariate and multivariate logistic regression analysis of tumour characteristics and operative method for prediction of postoperative renal functional loss (n=113)
Parameter Univariate analysis Multivariate analysis
p OR 95% CI p OR 95% CI
Age 0.693 1.00 0.97–1.04
Sex 0.457 0.66 0.22–1.96
BMI 0.604 0.97 0.87–1.09
Tumour side
Right 1
Left 0.550 1.30 0.55–3.06
Modified C index
>4.5 1 1
≤4.5 0.002 5.43 1.89–15.61 0.036 3.39 1.09–10.60
Total R.E.N.A.L score 0.912 1.02 0.76–1.37 Surgical procedure
Retroperitoneal 1 1
Transperitoneal 0.071 2.29 0.93–5.60 0.171 2.03 0.74–5.57
Ischemia time 0.255 1.02 0.98–1.06
Blood loss ¬(mL)
<60 1 1
≥60 0.004 3.75 1.53–9.19 0.095 2.45 0.86–7.00
Operative time (min)
<200 1 1
≥200 0.014 3.28 1.27–8.49 0.705 0.80 0.26–2.49
Resected volume (g)
<15 1 1
≥15 <0.001 5.25 2.08–13.29 0.031 3.40 1.12–10.31
BMI: body mass index; CI: confidence interval; OR: odds ratio.
Reproducibility of m-CI measurement
To test the reproducibility of m-CI measurement, the m-CI were measured by the other senior urologist (Kazuhide Makiyama) in 30 cases randomly selected from the same cohort. The Pearson correlation value of these m-CI was 0.966 (p<0.001).
Discussion
Recently, a few scoring systems to quantify anatomical char-acteristics have been developed, and these are useful for pre-dicting the difficulties of PN, ischemia time during surgery, and perioperative surgical complication risks. However, the predictive scoring system for postoperative RFL has not been sufficiently developed or validated. Unfortunately, some pre-vious reports have shown that the C index, PADUA and R.E.N.A.L. nephrometry score cannot predict postoperative RFL,10,12,13 although a few previous studies have shown that
all three scoring systems are significantly associated with the
percentage change in creatinine level,14,15 as well as warm
ischemia time and tumour size.14
Therefore, in the present study, we developed a highly accurate index to predict the postoperative RFL following LPN. The short distance between renal hilum and the renal tumour was the most relevant factor for predicting nephron damage during LPN because the renal hilum involves the renal artery complex, vein, and urinary tract. Therefore, pro-cedural damage of the renal hilum must be a main contribu-tor to RFL following surgery. One highly accepted score, the
C index,7 represents the distance between the renal center
and renal tumour, thus we modified this C index, termed the m-CI, and successfully quantified the distance between the renal hilum and renal tumour.
The present multivariate logistic regression model proves that the m-CI was an independent predictor of postoperative
RFL following LPN. In addition, the correlation coefficient indicated the predictive ability of the m-CI to be superior to that of the C index. This m-CI, an anatomical indicator that enables physicians to predict the RFL following LPN, requires only the measurement of stan-dard two-dimensional transverse CT scan images. Furthermore, the m-CI measurements showed the high reproducibility. Therefore, it is a simple and reliable indicator that is easy to obtain and adapt to clini-cal use. A previous report indicated that the tumour contact area was a potent anatomical indicator to
pre-dict RFL during LPN.19 However,
the calculation of the tumour contact area requires three-dimensional reconstructive CT imaging and these images might be difficult to obtain in some institutions.
Some anatomical scoring systems were reported to be
able to predict the technical difficulty of LPN,10 including the
risk of surgical complications8,11 and ischemia time12 during
LPN. The present study indicated that the m-CI might predict the operative time and ischemia time of LPN and blood loss during LPN, which should represent the surgical difficulty of LPN. These findings also supported that 4.5 is a reliable cutoff point of the m-CI, which is a predictor of not only RFL following LPN, but also the surgical difficulty of LPN.
In addition to the m-CI, the resected volume is another independent predictor of postoperative RFL after LPN. This
finding is consistent with that of a previous study20 and seems
to be reasonable, because a larger resected volume also results in loss of functioning nephrons due to resection of normal parenchyma.
Additionally, blood loss is a possible predictive factor for postoperative RFL. This result is also reasonable because larger blood loss might represent renal arterial or venous injury, which can cause normal renal nephron damage. Moreover, increased coagulation efforts or deep suturing may be needed to achieve hemostasis during LPN, which leads to damage of normal renal parenchyma and postop-erative RFL.
The present study has some limitations. First, this was a retrospective study, although consecutive patients were included in the analysis. Furthermore, this study involved a single surgeon and a single centre. Multicentre and mul-tinational assessments will be needed to test the reliability of our findings. Nonetheless, we believe that evaluation of the surgical outcomes of a single surgeon in a single centre enables us to exclude many confounding factors, such as differences in surgical techniques. Theoretically, the m-CI can be applied to not only laparoscopic, but also to open Fig. 4. The bar chart indicated the (A) operative time; (B) ischemia time; and (C) blood loss during LPN in
and robotic nephron-sparing surgery. We need to confirm the utility of the m-CI in the other nephron-sparing surgery in the future. Finally, a preoperative renal renogram was not performed in all enrolled cases in the present study. However, none of the patients had chronic kidney disease; therefore, we used the halved preoperative eGFR to identify the preoperative renal function of the treated side.
Conclusion
The m-CI is a useful scoring system to quantify the distance between the renal hilum and the renal tumour. The present study demonstrates that the m-CI can predict RFL following LPN, as well as the operative difficulties, including operative time, ischemia time, and blood loss during LPN. In addition, its predictive potential for RFL following LPN is thought to be superior to previous renal anatomical scoring systems. This measurement can easily be made using standard two-dimensional CT images, and clinical usage of the m-CI is not difficult.
Competing interests: The authors report no competing personal or financial interests.
This paper has been peer-reviewed.
References
1. Tan HJ, Norton EC, Ye Z, et al. Long-term survival following partial vs. radical nephrectomy among older patients with early-stage kidney cancer. JAMA 2012;307:1629-35. https://doi.org/10.1001/ jama.2012.475
2. Weight CJ, Larson BT, Fergany AF, et al. Nephrectomy-induced chronic renal insufficiency is associated with increased risk of cardiovascular death and death from any cause in patients with localized cT1b renal masses. J Urol 2010;183:1317-23. https://doi.org/10.1016/j.juro.2009.12.030
3. Marszalek M, Meixl H, Polajnar M, et al. Laparoscopic and open partial nephrectomy: A matched-pair com-parison of 200 patients. Eur Urol 2009;55:1171-8. https://doi.org/10.1016/j.eururo.2009.01.042 4. Springer C, Hoda MR, Fajkovic H, et al. Laparoscopic vs. open partial nephrectomy for T1 renal tumours:
Evaluation of long-term oncological and functional outcomes in 340 patients. BJU Int 2013;111:281-8. https://doi.org/10.1111/j.1464-410X.2012.11280.x
5. Shah PH, George AK, Moreira DM, et al. To clamp or not to clamp? Long-term functional outcomes for elec-tive off-clamp laparoscopic partial nephrectomy. BJU Int 2016;117:293-9. https://doi.org/10.1111/ bju.13309
6. MacLennan S, Imamura M, Lapitan MC, et al. Systematic review of perioperative and quality-of-life outcomes following surgical management of localized renal cancer. Eur Urol 2012;62:1097-117. https://doi.org/10.1016/j.eururo.2012.07.028
7. Simmons MN, Ching CB, Samplaski MK, et al. Kidney tumour location measurement using the C index method. J Urol 2010;183:1708-13. https://doi.org/10.1016/j.juro.2010.01.005
8. Ficarra V, Novara G, Secco S, et al. Preoperative aspects and dimensions used for an anatomical (PADUA) classification of renal tumours in patients who are candidates for nephron-sparing surgery. Eur Urol 2009;56:786-93. https://doi.org/10.1016/j.eururo.2009.07.040
9. Kutikov A, Uzzo RG. The R.E.N.A.L. nephrometry score: A comprehensive standardized system for quan-titating renal tumour size, location and depth. J Urol 2009;182:844-53. https://doi.org/10.1016/j. juro.2009.05.035
10. Hayn MH, Schwaab T, Underwood W, et al. RENAL nephrometry score predicts surgical outcomes of laparoscopic partial nephrectomy. BJU Int 2011;108:876-81. https://doi.org/10.1111/j.1464-410x.2010.09940.x
11. Bruner B, Breau RH, Lohse CM, et al. Renal nephrometry score is associated with urine leak after partial nephrectomy. BJU Int 2011;108:67-72. https://doi.org/10.1111/j.1464-410X.2010.09837.x 12. Bylund JR, Gayheart D, Fleming T, et al. Association of tumour size, location, R.E.N.A.L., PADUA, and
central-ity index score with perioperative outcomes and postoperative renal function. J Urol 2012;188:1684-9. https://doi.org/10.1016/j.juro.2012.07.043
13. Buethe DD, Moussly S, Lin HY, et al. Is the R.E.N.A.L. nephrometry scoring system predictive of the functional efficacy of nephron-sparing surgery in the solitary kidney? J Urol 2012;188:729-35. https://doi.org/10.1016/j.juro.2012.04.115
14. Okhunov Z, Rais-Bahrami S, George AK, et al. The comparison of three renal tumour scoring sys-tems: C-Index, P.A.D.U.A., and R.E.N.A.L. nephrometry scores. J Endourol 2011;25:1921-4. https://doi.org/10.1089/end.2011.0301
15. Simmons MN, Hillyer SP, Lee BH, et al. Nephrometry score is associated with volume loss and func-tional recovery after partial nephrectomy. J Urol 2012;188:39-44. https://doi.org/10.1016/j. juro.2012.02.2574
16. Osaka K, Makiyama K, Nakaigawa N, et al. Predictors of trifecta outcomes in laparoscopic partial nephrec-tomy for clinical T1a renal masses. Int J Urol 2015;22:1000-5. https://doi.org/10.1111/iju.12893 17. Makiyama K, Nakaigawa N, Miyoshi Y, et al. Improvement on parenchymal suturing technique in
laparoscopic partial nephrectomy. Int J Urol 2008;15:854-5. https://doi.org/10.1111/j.1442-2042.2008.02101.x
18. Levey AS, Stevens LA, Schmid CH, et al. A new equation to estimate glomerular filtration rate. Ann Intern Med 2009;150:604-12. https://doi.org/10.7326/0003-4819-150-9-200905050-00006 19. Leslie S, Gill IS, de Castro Abreu AL, et al. Renal tumour contact surface area: A novel
param-eter for predicting complexity and outcomes of partial nephrectomy. Eur Urol 2014;66:884-93. https://doi.org/10.1016/j.eururo.2014.03.010
20. Leslie S, Goh AC, Gill IS. Partial nephrectomy — contemporary indications, techniques, and outcomes. Nat Rev Urol 2013;10:275-83. https://doi.org/10.1038/nrurol.2013.69
Correspondence: Dr. Kazuhide Makiyama, Department of Urology, Yokohama City University