PIC50PRED: A PIC50 PREDICTION TOOL FOR 5-ALPHA REDUCTASE ENZYME
URVASHI BALEKUNDRI*, SHIVAKUMAR MADAGI
Department of Bioinformatics, Karnataka State Women’s University, Vijayapur - 586 108, Karnataka, India. Email: [email protected] Received: 03 December 2015, Revised and Accepted: 22 December 2015
ABSTRACT
Objectives: Prostate cancer is a major health burden all over the world. 5-alpha reductase (5AR) enzyme is a significant drug target for prostate cancer. Identification of drug targets and their inhibitors are a challenging task in drug designing. The prediction of potential inhibitors against 5AR may help in designing effective drugs against prostate cancer.
Methods: The compounds having proven inhibitory action against 5AR in experimental settings were trained and tested to build two-dimensional quantitative structure-activity relationship (2D QSAR) models based on molecular descriptors. The molecular descriptors were extracted from E-Dragon 1.0 program. The 2D QSAR prediction models were built using linear regression and least median of squares using Weka 3.7. The optimized 2D QSAR models were implemented in a web-based server by employing XAMPP package and using hyper processed language (PHP) as a scripting language.
Results: The 2D QSAR models were built using molecular descriptors and achieved a positive correlation of 0.69 (r) and 0.46 (r) between predicted and actual pIC50 from linear regression and least square of median, respectively.
Conclusion: In silico QSAR modeling along with machine learning techniques seems to be a promising approach for prediction of novel 5AR inhibitors. To serve the scientific community, a web server “pIC50 Pred” has been developed which allows the prediction of pIC50 value of any novel compounds thought to have 5AR inhibitory activity before jumping into in vitro experimental assays.
Availability: The prediction tool is freely available at http://www.biopred.org.
Keywords: 5-alpha reductase, Two-dimensional quantitative structure-activity relationship, pIC50, Weka, Linear regression, Least median of squares.
INTRODUCTION
Prostate cancer is a type of cancer characterized by uncontrolled growth of prostate gland. It is the second most common type of cancer leading to death among men and women in the United States. According to American Cancer Society, 233,000 people are diagnosed and 29,480 people were dead in 2014 [1]. Chemoprevention is an attractive strategy that reduces the incidence and mortality of cancer.
5-alpha reductase (5AR) is a promising target for prostate cancer. The enzyme is used in the irreversible conversion of testosterone to dihydrotestosterone (DHT). The concentration of DHT within the cell increases compared to testosterone concentration. It is followed by binding of DHT to androgen receptor which acts as a transcription factor for gene expression in prostate cancer. Thereby, 5AR plays an important role in the pathology of prostate cancer [2]. The inhibitors of 5AR have been used extensively in prevention and treatment of adenocarcinoma in prostate cancer. They are relatively less toxic compared to other inhibitors. To design new 5AR inhibitors, a ligand library of potential inhibitors must be tested for their biological activity in bioassays which is an expensive and time-consuming process [3,4]. Henceforth, there is an urgent need to design new strategies to predict the biological activity of compounds before their actual synthesis.
Quantitative structure-activity relationship (QSAR) is a reliable in silico technique developed to model the biological activity based on the chemical structure [5-7]. The biological activity of the candidate drug molecules can be predicted before the actual chemical synthesis. The prediction is based on the structural descriptors which contribute to the biological activity. The structural descriptors along with the molecular properties are depicted using QSAR models. This strategy can be utilized to develop novel inhibitors against 5AR.
Various machine learning and data mining methodologies have been employed for development of QSAR models in drug design. The activity of 1, 4-dihydropyridine calcium channel antagonists were predicted using QSAR model employed by using least square support vector machines [8]. The Src kinase inhibitors were classified using two-dimensional QSAR (2D QSAR) models developed using support vector machines [9]. The potential inhibitors for dihydrodipicolinate synthase were predicted using QSAR models followed by docking studies. A web server was deployed to calculate the ligand affinity using docking energy scores [10]. The anti-tubercular activity of different classes of organic compounds was predicted using QSAR models [11]. The inhibitors were predicted for bacterial GlmU protein using QSAR models. The compounds were further docked in their active site using AutoDock [12]. 13 novel inhibitors for aryl acid adenylating enzyme of Mycobacterium tuberculosis were identified using 3D-QSAR studies and virtual screening procedures [13]. The inhibitory concentration at half maximal concentration (IC50) is the measure of the inhibition of the action of a biological entity by the compound. The value of pIC50 is the negative logarithm of IC50. Higher the value of pIC50, greater is the compound’s potential to inhibit a molecule. Some tools have been developed to calculate the IC50 values for compounds in the recent past. Sanjeev’s lab is a prediction tool used to calculate pIC50 values from IC50 values in nanomolar and micromolar ranges [10,14].
Some tools have been developed based on QSAR prediction models. They include MetaPred [15], KiDoQ [10]. Currently, there exists no screening predictive system to compute pIC50 value for potential 5AR inhibitors. To fill this gap, in this study an attempt has been made to develop a 2D QSAR based predictive system to compute pIC50 values for prospective 5AR inhibitors.
METHODS Dataset
A literature review was performed to collect the compounds having established inhibitory activity against 5AR enzyme and possessing low IC50 values. The IC50 values were retrieved from different bioassays of 5AR [16]. A total of 24 compounds were identified with known IC50 values and proven potencies against 5AR. Another 24 compounds were selected from diverse categories of compounds such as anti-microbial, anti-inflammatories, anti-mutagens, and anti-carcinogens. The IC50 values for these compound dataset were not considered for the study. This diverse set of inhibitors and non-inhibitors containing 48 compounds formed the dataset for model building.
Generation of molecular descriptors using QSAR
The structure data file “sdf files” of the 48 compounds having inhibitory action against 5AR were retrieved from PubChem Compound database [17] and this was used as an input for computing values of diverse molecular descriptors. To compute the values of molecular descriptors, the sdf file was uploaded in E-Dragon web-tool [18]. E-Dragon is the electronic version of Dragon software. The software is used to compute the molecular descriptors. The tool provides 1666 descriptors used to compute the structure-activity relationship for molecules. A total 1666 molecular descriptors for each compound of the 48 compound dataset were obtained from the E-dragon tool.
Selection of molecular descriptors
The selection of relevant molecular descriptors is critical for the development of accurate QSAR models. The high dimensionality of molecular descriptors hampers the model development. It is, therefore, important to select relevant molecular descriptors to build an accurate model. The molecular descriptors obtained from E-Dragon were further reduced using CfssubsetEval algorithm in Weka 3.7. Weka is a popular machine learning repository that consists of different algorithms and visualization tools [19]. Principal Component Analysis algorithm is used for feature reduction. The algorithm computes the importance of each subset by comparing the performance of each feature. The redundancy between each feature is also computed. The features which are having a high correlation with the independent attribute and less correlation among different features are selected [20]. The dataset was divided into training set (36 compounds) and test set (12 compounds) prior to the application of different machine learning techniques.
Model generation
Linear regression
The 2D QSAR equation was developed to study the interrelationship between the dependent variable (i.e., pIC50) and the independent variables (i.e., molecular descriptors). Linear regression is a statistical technique that is used to predict the relationship between multiple independent variables and one dependent variable. In this study, the molecular descriptors are independent variables and pIC50 is the dependent variable.
Least median of squares
The 2D QSAR equation was developed to study the interrelationship between the dependent variables and the independent variable. Least median of squares is a technique that estimates the relationship between the dependent variables and independent variables. The correlation coefficient obtained by linear regression is optimized by squaring the value. It reduces the error ratio obtained from linear regression.
Model validation
The QSAR models were validated using the test dataset, and the performance of the models was estimated using 10-fold cross-validation technique. The dataset is randomly divided into ten sets of equal size. Training and testing was carried out 10 times on different datasets with nine sets for training and remaining one set for testing. The step was iterated ten times in each fold having a single set for testing. The prediction models were improved in an iterative manner and were taken for building the web-based prediction system.
Deployment of model in a web-server
User interface schema
The webserver was developed using RDBMS (Relational Database Management System) schema. The database was implemented using sequence query language (MySQL) database using free web server XAMPP 1.8 on windows platform. The schema was developed to accommodate the basic information regarding compound information, different submission methods and predicted pIC50 values for compounds. The schema supports addition of further details regarding compound structure, compound properties, and compound function in future.
Testing of the predictive system
The predicted pIC50 values from the tool were compared with the actual pIC50 values of the compounds. Different parameters were used to determine the performance of QSAR models. Pearson Correlation Coefficient was used to measure the strength of the linear association between the two variables. of x or y, r: correlation coefficient.
The square of the Pearson correlation coefficient (r2), known as the coefficient of determination, describes how much of the variance
between the two variables is described by the linear fit. The methodology used in the work is shown in Fig. 1.
RESULTS AND DISCUSSION
2D QSAR equations were built using linear regression and least median of squares algorithms in Weka. Using these models a predictive system was generated to predict the pIC50 values of 5AR inhibitors. The lists of compounds used in this study are shown in Table 1.
The dataset used in this study comprises of 48 compounds. Development of ideal QSAR models requires reliable data and hence only those compounds were taken which are experimentally proved to be inhibitors of 5AR in bioassays. The non-inhibitors were collected from different classes of compounds.
The molecular descriptors utilized in the machine learning techniques are shown in Table 2.
These descriptors were screened from the large set of molecular descriptors. The performance of the QSAR models depends directly on the quality of the molecular descriptors. Hence, repeated screening was performed to obtain the relevant molecular descriptors.
The 2D QSAR models
Based on the molecular descriptorsthe 2D QSAR models developed using linear regression and least median of squares are illustrated below:
Model developed using linear regression:
pIC50=2.1203*(X0Av)-1.1039*(MATS7e)+7.8763*(
JGI1)-18.1016*(JGI5)+1.9854 Equation (1)
From equation (1), pIC50= Predicted IC50 value, X0Av = Average connectivity index of order 0, MATS7e = Moran autocorrelation lag 7 weighted by Sanderson electronegativity, JGI1 = Mean topological charge index of order 1, JGI5 = Mean topological charge index of order 5.
Model developed using least median of squares:
pIC50=0.016*(nN)-1.3772*(PJI2)-0.3106*(X0Av)
0.5593*(MATS7e)+4.8457*(JGI1)+3.1887*(JGI2)-9.5549*(JGI5)+
5.176 Equation (2)
From equation (2), pIC50= Predicted IC50 value, nN = Number of Nitrogen atoms, PJI2 = 2D Petitjean shape index, X0Av = Average connectivity index of order 0, MATS7e = Moran autocorrelation lag 7 weighted by Sanderson electronegativity, JGI1 = Mean topological charge index of order 1, JGI2 = Mean topological charge index of order 2, JGI3 = Mean topological charge index of order 3, JGI5 = Mean topological charge index of order 5.
These two models were used in the construction of the prediction system. The accuracy of the prediction is depended on these QSAR models.
The web server
The snapshot of the prediction tool is shown in Fig. 2.
The pIC50 prediction tool is developed to predict the pIC50 value in (µm) of any compound having 5AR inhibitory action and is user friendly. The users need to follow the instructions and insert the values of molecular descriptors of the compound. Two prediction methods, linear regression method and least median of squares are available in the tool. The user can use any method.
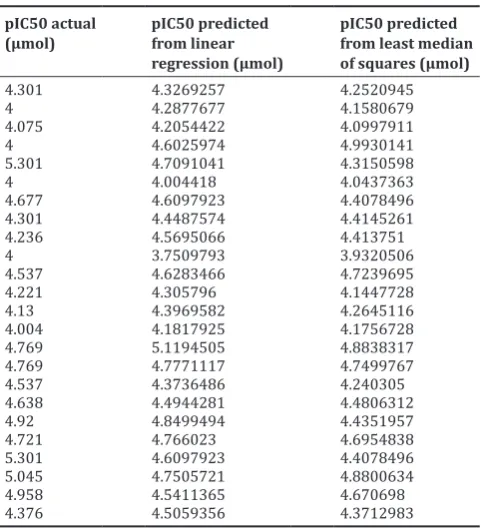
The actual and predicted values of pIC50 for each inhibitor present in the dataset are shown in Table 3.
Table 1: List of compounds used for training and testing for model building
5-alphareductase
Type 2 inhibitors Pubchem ID pIC50 values µmol 5-alphareductase Type 2 non-inhibitors Pubchem ID
Antrarobin 11342 4.301 Daunorubicin 30323
Alizarin 6293 4 Pinitol 164619
Bromopyrogallol red 24847472 4.075 Limonene 440917
Coniferol 124072 4 Estragole 8815
Curcumin 969516 5.301 Morphine 5288826
Eugenol 3314 4 Tolnaftate 5510
Gossypol 3503 4.677 Tinidazole 5479
Nordihydrogaiaretic acid 4534 4.301 Thiram 5455
Octyl gallate 61253 4.236 Sulfhanilamide 5333
Pyrocatechol violet 66993 4 Saffranal 61041
Tetrahydrocurcumin 124072 4.537 Natamycin 23835497
Epicatechin gallate 107905 4.221 Iornoxicam 54690031
Epigallocatechin gallate 65064 4.13 Amantadine 2130
Baicalein 5281605 4.004 Ergosterol 12304306
Biochanin a 5280373 4.769 CDK inhibitor, p35 4155347
2,6-dichloroindophenol 13726 4.769 Tocopherol acetate 86472
Daidzein 5281708 4.537 Pentachlorophenol 992
Genistein 5280961 4.638 Rimantadine 5071
Kaempferol 5280863 4.92 Norzimelidine 6437872
Linoleic acid 5280450 4.721 ML211 56593118
Menadione 4055 5.301 Kinome_3850 11524200
Alpha-linolenic acid 5280934 5.045 Hydrocortisone 5754
Gamma linolenic acid 5280933 4.958 EGFR inhibitor 9549299
Oleic acid 445639 4.376 Thymol 6989
EGFR: Epidermal growth factor receptor
Table 2: List of final set of molecular descriptors
SI. no Molecular
descriptors Description
1 JGI1 Mean topological charge index of order 1 2 JGI2 Mean topological charge index of order 2 3 JGI3 Mean topological charge index of order 3 4 JGI5 Mean topological charge index of order 4 5 MATS7e Moran autocorrelation lag 7 weighted
by Sanderson electronegativity
6 nN Number of Nitrogen atoms
7 PJI2 2D Petitjean shape index
Correlation analysis
Based on the actual and predicted values of the inhibitory coefficient, correlation values (r) and (r2) calculated for both linear regression model and least median of the square, Table 4.
From the Table 4, we can conclude that the values show a positive correlation between the actual pIC50 of the compounds and predicted pIC50 from the tool. Furthermore, the performance of linear regression model is better compared to the least median of square model.
CONCLUSION
This study describes the development of the web server freely available for users to compute the pIC50 value for diverse range of compounds having inhibitory effects against 5AR. The study facilitates the prediction of pIC50 values for compounds based on the QSAR models without performing any biological assays. The prediction method is based on the structural descriptors generated from the QSAR equation. The tool will serve as a useful screening platform for pharmacologist and medicinal chemistry to screen any novel compounds thought to have a 5AR inhibitory activity before jumping into in vitro experimental assays. This technique is expected to be used further in drug design and development strategies.
ACKNOWLEDGMENTS
The authors would like to acknowledge Department of Bioinformatics, DBT-BIF center, Karnataka State Women’s University, Vijayapur for the continuous support during the research work.
REFERENCES
1. National Center for Health Statistics, Division of Health Interview Statistics. National Health Interview Survey Public Use Data File 2014. Hyattsville, MD: Centres for Disease Control and Prevention. 2. Hudak SJ, Hernandez J, Thompson IM. Role of 5 alpha-reductase
inhibitors in the management of prostate cancer. Clin Interv Aging 2006;1(4):425-31.
3. Ding K, Lu Y, Nikolovska-Coleska Z, Wang G, Qiu S, Shangary S,
et al. Structure-based design of spiro-oxindoles as potent, specific
small-molecule inhibitors of the MDM2-p53 interaction. J Med Chem 2006;49(12):3432-5.
4. Li N, Thompson S, Schultz DC, Zhu W, Jiang H, Luo C, et al. Discovery of selective inhibitors against EBNA1 via high throughput in silico
virtual screening. PLoS One 2010;5(4):e10126.
5. Núñez MB, Maguna FP, Okulik NB, Castro EA. QSAR modeling of the MAO inhibitory activity of xanthones derivatives. Bioorg Med Chem Lett 2004;14(22):5611-7.
6. Mandal AS, Roy K. Predictive QSAR modelling of HIV reverse transcriptase inhibitor TIBO derivatives. Eur J Med Chem 2009;44(4):1509-24.
7. Pasha FA, Muddassar M, Srivastava AK, Cho SJ. In silico QSAR studies of anilinoquinolines as EGFR inhibitors. J Mol Model 2010;16(2):263-77.
8. Kahraman P, Turkay M. QSAR analysis of 1,4-Dihydropyridine calcium channel antagonists. In: Plesu V, Agachi PS, editors. 17th European
Symposium on Computer Aided Process Engineering - ESCAPE17. Amsterdam: Elsevier; 2007.
9. Zhu J, Lu W, Liu L, Gu T, Niu B. Classification of Src kinase inhibitors based on support vector machine. QSAR Comb Sci
Fig. 2: The home page of the web server
Table 3: pIC50 values computed from the tool and the actual pIC50 values of the compounds
pIC50 actual
(µmol) pIC50 predicted from linear regression (µmol)
pIC50 predicted from least median of squares (µmol)
4.301 4.3269257 4.2520945
4 4.2877677 4.1580679
4.075 4.2054422 4.0997911
4 4.6025974 4.9930141
5.301 4.7091041 4.3150598
4 4.004418 4.0437363
4.677 4.6097923 4.4078496
4.301 4.4487574 4.4145261
4.236 4.5695066 4.413751
4 3.7509793 3.9320506
4.537 4.6283466 4.7239695
4.221 4.305796 4.1447728
4.13 4.3969582 4.2645116
4.004 4.1817925 4.1756728
4.769 5.1194505 4.8838317
4.769 4.7771117 4.7499767
4.537 4.3736486 4.240305
4.638 4.4944281 4.4806312
4.92 4.8499494 4.4351957
4.721 4.766023 4.6954838
5.301 4.6097923 4.4078496
5.045 4.7505721 4.8800634
4.958 4.5411365 4.670698
4.376 4.5059356 4.3712983
Table 4: Correlation coefficient values
Model r r2
Linear regression 0.6973 0.4862
2009;28(6-7):719-27.
10. Garg A, Tewari R, Raghava GP. KiDoQ: Using docking based energy scores to develop ligand based model for predicting antibacterials. BMC Bioinformatics 2010;11:125.
11. Kovalishyn V, Aires-de-Sousa J, Ventura C, Elvas Leitao R, Martins F. QSAR modeling of antitubercular activity of diverse organic compounds. Chemometr Intell Lab Syst 2011;107(1):69-74.
12. Singla D, Anurag M, Dash D, Raghava GP. A web server for predicting inhibitors against bacterial target GlmU protein. BMC Pharmacol 2011;11:5.
13. Maganti L; OSDD Consortium, Ghoshal N. 3D-QSAR studies and shape based virtual screening for identification of novel hits to inhibit MbtA in Mycobacterium tuberculosis. J Biomol Struct Dyn 2015;33(2):344-64.
14. Chandrabose S, Kumar TS, Konda RK, Kumar S. Tool development for prediction of pIC50 values from IC50 values-A pIC50 value calculator. Curr Trends Biotechnol Pharm 2011;5(2):1104-9.
15. Mishra NK, Agarwal S, Raghava GP. Prediction of cytochrome P450 isoform responsible for metabolizing a drug molecule. BMC Pharmacol 2010;10:8.
16. Richard AH, Shutsung L. Methods and Compositions for Regulation of 5-alpha Reductase Activity. 1999;WO 1999022728 A1.
17. Bolton E, Wang Y, Thiessen PA, Bryant SH. PubChem: Integrated platform of small molecules and biological activities. Ann Rep Comput Chem 2008;4:217-41.
18. Tetko IV, Gasteiger J, Todeschini R, Mauri A, Livingstone D, Ertl P,
et al. Virtual computational chemistry laboratory – Design and
description. J Comput Aided Mol Des 2005;19(6):453-63.
19. Hall M, Frank E, Holmes G, Pfahringer B, Reutemann P, Witten IH. The WEKA data mining software: An update. SIGKDD Explor 2009;11(1):10-8.