Surveillance in easy to access population
subgroups as a tool for evaluating malaria
control progress: A systematic review
Sanie S. S. Sesay
1,2*, Emanuele Giorgi
3,4, Peter J. Diggle
3,4, David Schellenberg
5, David
G. Lalloo
1,2, Dianne J. Terlouw
1,21 Malawi-Liverpool-Wellcome Trust Clinical Research Programme, Blantyre, Malawi, 2 Liverpool School of
Tropical Medicine, Liverpool, United Kingdom, 3 Medical School, Lancaster University, Lancaster, United Kingdom, 4 Institute of Infection and Global Health, University of Liverpool, Liverpool, United Kingdom,
5 London School of Hygiene and Tropical Medicine, London, United Kingdom
Abstract
Background
The need for surveillance systems generating targeted, data-driven, responsive control
efforts to accelerate and sustain malaria transmission reduction has been emphasized by
programme managers, policy makers and scientists. Surveillance using easy-to-access
population subgroups (EAGs) may result in considerable cost saving compared to
house-hold surveys as the identification and selection of individuals to be surveyed is simplified,
fewer personnel are needed, and logistics are simpler. We reviewed available literature on
the validation of estimates of key indicators of malaria control progress derived from EAGs,
and describe the options to deal with the context specific bias that may occur.
Methods
A literature search was conducted of all documents reporting validation of estimates of
malaria control indicators from EAG surveys before the 31
stof December 2016. Additional
records were identified through cross-reference from selected records, other applicable
pol-icy documents and grey literature. After removal of duplicates, 13, 180 abstracts were
evalu-ated and 2,653 eligible abstracts were identified mentioning surveillance in EAGs, of which
29 full text articles were selected for detailed review. The nine articles selected for
system-atic review compared estimates from health facility and school surveys with those of a
con-temporaneous sample of the same population in the same geographic area.
Results
Review of the available literature on EAGs suitable for surveillance of malaria control
prog-ress revealed that little effort has been made to explore the potential approach and settings
for use of EAGs; and that there was wide variation in the precision of estimates of control
progress between and within studies, particularly for estimates of control intervention
cover-age. Only one of the studies evaluated the geospatial representativeness of EAG samples, or
carried out geospatial analyses to assess or control for lack of geospatial representativeness.
a1111111111
a1111111111
a1111111111
a1111111111
a1111111111
OPEN ACCESS
Citation: Sesay SSS, Giorgi E, Diggle PJ,
Schellenberg D, Lalloo DG, Terlouw DJ (2017) Surveillance in easy to access population subgroups as a tool for evaluating malaria control progress: A systematic review. PLoS ONE 12(8): e0183330.https://doi.org/10.1371/journal. pone.0183330
Editor: Joshua Yukich, Tulane University School of
Public Health and Tropical Medicine, UNITED STATES
Received: January 30, 2017 Accepted: August 2, 2017 Published: August 16, 2017
Copyright:©2017 Sesay et al. This is an open access article distributed under the terms of the Creative Commons Attribution License, which permits unrestricted use, distribution, and reproduction in any medium, provided the original author and source are credited.
Data Availability Statement: All relevant data are
within the paper and its Supporting Information files.
Funding: SSSS is supported by the Malaria
Capacity Development Consortium which is funded by The Wellcome Trust (Grant number
Two studies attempted to measure the degree of bias or improve the precision of estimates
by controlling for bias in a multivariate analysis; and this was only successful in one study.
The observed variability in accuracy of estimates is likely to be caused by selection and/or
information bias due to the inherent nature of EAGs. The reviewed studies provided insight
into the design and analytical approaches that could be used to limit bias.
Conclusion
The utility EAGs for routine surveillance of progress in malaria control at the district or
sub-district programmatic level will be driven by several factors including whether serial point
estimates to measure transmission reduction or more precise geospatial distribution to track
‘hot-spots’ is required, the acceptable degree of precision, the target population, and the
resources available for surveillance. The opportunities offered by novel geostatistical
analy-ses and hybrid sampling frames to overcome bias justify a renewed exploration of use of
EAGs for malaria monitoring and evaluation.
Background
The need for surveillance systems that inform accelerated and sustained control efforts to
accelerate and sustain malaria transmission reduction has been emphasized by programme
managers, policy makers and scientists. A key element of these surveillance systems will be
their cost and whether they can easily be integrated with current malaria control activities.
Routine health facility-based passive case reporting, for example through Health Management
Information Systems (HMISs), has been and continues to be at the forefront of malaria
sur-veillance [
1
,
2
]. A well-functioning HMIS will provide regular data from all health facilities
nationally allowing accurate measurement of malaria control progress across the healthcare
system. This has largely not been the case for most HMISs in malaria endemic countries, with
problems like incomplete reporting and lack of diagnostic confirmation being comparatively
common [
3
,
4
]. Malaria indicator surveys (MISs) provide single cross-sectional national
as-sessments of disease burden [
5
], but are usually expensive and logistically demanding to
un-dertake. The goal of MISs is to generate nationally representative estimates and are thus not
powered to detect local-level variability[
6
,
7
]. The interval between serial MISs also affect their
direct relevance for monitoring short- and medium-term trends in malaria control progress.
Supplementary approaches are thus needed to provide timely estimates of malaria control
progress at the district and sub-district level, complementary to current malaria surveillance
systems, particularly as malaria transmission intensity falls and its distribution becomes more
localized [
8
].
Representative subsets of the population or disease at-risk groups routinely assemble at
eas-ily accessible locations (e.g. schools or health facilities) making them logistically attractive to
sample [
9
]. Alternatively, representative subgroups or the whole population of interest may be
easily accessible during public health intervention activities such as mass drug administration
and catch-up vaccination campaigns [
10
]. The opportunistic nature of surveillance in the so
called Easy Access Groups (EAGs) could thus save costs by simplifying the identification and
selection of individuals to be surveyed, requiring simplified logistics and fewer study personnel
compared to household surveys [
9
,
11
]. Evidence from school surveys indicate that EAGs are
suitable for surveillance when they are potentially representative of an at-risk stratum of the
and analysis, decision to publish, or preparation of the manuscript.
Competing interests: The authros have declared
population [
9
]. However, there are concerns about the inherent biased nature of such a sample,
as such non-probability samples depend on natural systems of selection which are likely to
result in the selection of a non-representative sample of the population of interest [
12
]. In this
systematic review, we studied the available literature on the validation of estimates of key
indi-cators of malaria control progress [
13
] derived from EAGs, focusing on EAGs that may be
suit-able for surveillance at the district or (sub)district level.
Methods
Search strategy
We searched EMBASE
1
(EMBASE, Medline, EMBASE Classic), PubMed
1
and
ScienceDir-ect
1
bibliographic databases without language restrictions from inception to 31
stDecember
2016 for articles with the following search terms in their keywords, title or abstract: "malaria"
AND "survey”; or “malaria” AND “surveillance”, or "malaria" AND “monitoring” AND
“eval-uation”; or "malaria" AND "transmission" AND "measurement. We also searched the online
WHO document centre [
14
] for relevant policy documents and for grey literature from the
WHO historical documents database on malaria (1947–2000) [
15
]. We also included pertinent
articles that were not picked up by our search from other sources including recommendation
from key experts in the field of malaria surveillance.
We compiled the results into a searchable database in EndNote X8.0.1 (Thomson Reuters).
We searched this database for abstracts detailing validation of estimates from EAGs
predeter-mined to be most suitable for routine malaria surveillance at the (sub)district-level by a review
of historical evidence of previous use for malaria surveillance. We also added EAGs that had
not been previously used for malaria surveillance but demonstrated this potential through
sur-veillance of other diseases. Selected EAGs were further validated by examination against
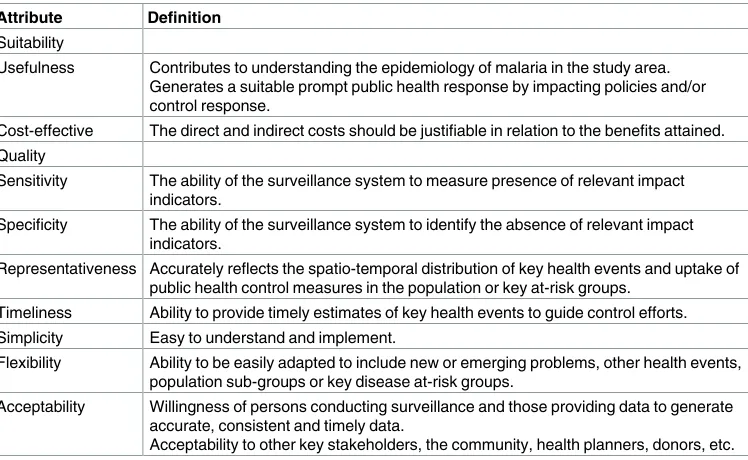
gen-eral criteria used to evaluate the suitability of a surveillance system [
16
], adapted to malaria
surveillance (
Table 1
). Based on our review we postulated that the following EAGs were
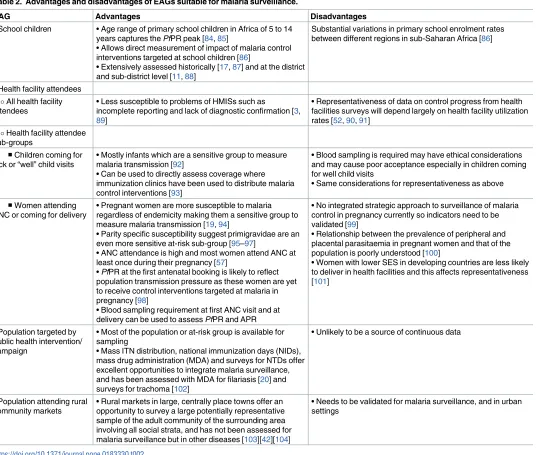
suit-able for the routine surveillance of malaria control progress (
Table 2
):
Table 1. Criteria evaluating the suitability of EAGs for malaria surveillance. Attribute Definition
Suitability
Usefulness Contributes to understanding the epidemiology of malaria in the study area. Generates a suitable prompt public health response by impacting policies and/or control response.
Cost-effective The direct and indirect costs should be justifiable in relation to the benefits attained. Quality
Sensitivity The ability of the surveillance system to measure presence of relevant impact indicators.
Specificity The ability of the surveillance system to identify the absence of relevant impact indicators.
Representativeness Accurately reflects the spatio-temporal distribution of key health events and uptake of public health control measures in the population or key at-risk groups.
Timeliness Ability to provide timely estimates of key health events to guide control efforts. Simplicity Easy to understand and implement.
Flexibility Ability to be easily adapted to include new or emerging problems, other health events, population sub-groups or key disease at-risk groups.
Acceptability Willingness of persons conducting surveillance and those providing data to generate accurate, consistent and timely data.
Acceptability to other key stakeholders, the community, health planners, donors, etc.
1. School children
2. Health facility attendees, including:
a. All health facility attendees including accompanying persons
b. Children coming for sick or routine “well” child visits
c. Women attending ANC or coming for delivery
3. Population targeted by public health intervention campaign such as mass drug
administration
4. Population attending rural community markets
Table 2. Advantages and disadvantages of EAGs suitable for malaria surveillance.
EAG Advantages Disadvantages
• School children • Age range of primary school children in Africa of 5 to 14 years captures the PfPR peak [84,85]
• Allows direct measurement of impact of malaria control interventions targeted at school children [86]
• Extensively assessed historically [17,87] and at the district and sub-district level [11,88]
Substantial variations in primary school enrolment rates between different regions in sub-Saharan Africa [86]
• Health facility attendees All health facility attendees
• Less susceptible to problems of HMISs such as
incomplete reporting and lack of diagnostic confirmation [3, 89]
• Representativeness of data on control progress from health facilities surveys will depend largely on health facility utilization rates [52,90,91]
Health facility attendee sub-groups
■Children coming for sick or “well” child visits
• Mostly infants which are a sensitive group to measure malaria transmission [92]
• Can be used to directly assess coverage where immunization clinics have been used to distribute malaria control interventions [93]
• Blood sampling is required may have ethical considerations and may cause poor acceptance especially in children coming for well child visits
• Same considerations for representativeness as above
■Women attending ANC or coming for delivery
• Pregnant women are more susceptible to malaria regardless of endemicity making them a sensitive group to measure malaria transmission [19,94]
• Parity specific susceptibility suggest primigravidae are an even more sensitive at-risk sub-group [95–97]
• ANC attendance is high and most women attend ANC at least once during their pregnancy [57]
• PfPR at the first antenatal booking is likely to reflect population transmission pressure as these women are yet to receive control interventions targeted at malaria in pregnancy [98]
• Blood sampling requirement at first ANC visit and at delivery can be used to assess PfPR and APR
• No integrated strategic approach to surveillance of malaria control in pregnancy currently so indicators need to be validated [99]
• Relationship between the prevalence of peripheral and placental parasitaemia in pregnant women and that of the population is poorly understood [100]
• Women with lower SES in developing countries are less likely to deliver in health facilities and this affects representativeness [101]
• Population targeted by public health intervention/ campaign
• Most of the population or at-risk group is available for sampling
• Mass ITN distribution, national immunization days (NIDs), mass drug administration (MDA) and surveys for NTDs offer excellent opportunities to integrate malaria surveillance, and has been assessed with MDA for filariasis [20] and surveys for trachoma [102]
• Unlikely to be a source of continuous data
• Population attending rural community markets
• Rural markets in large, centrally place towns offer an opportunity to survey a large potentially representative sample of the adult community of the surrounding area involving all social strata, and has not been assessed for malaria surveillance but in other diseases [103][42][104]
• Needs to be validated for malaria surveillance, and in urban settings
We then searched the EndNote database for articles with the following keywords in their
abstract:
1. “school” AND “survey”, “school AND “surveillance”, “school” AND “monitoring” AND
“evaluation”, and “school” AND “transmission” AND “measurement”
2. “health” AND “facility” OR “centre” AND “survey”, health” AND “facility” OR “centre”
AND “surveillance”, “health” AND “facility” OR “centre” AND “monitoring” AND
“evalu-ation”, and “health” AND “facility” OR “centre” AND “transmission” AND measurement
3. “antenatal clinic” AND “survey”, “antenatal clinic” AND “surveillance”, “antenatal clinic”
AND “monitoring” AND “evaluation”, “antenatal clinic” AND “transmission” AND
“mea-surement”, “pregnancy” OR “delivery” AND “survey”, “pregnancy” OR “delivery” AND
“surveillance”, “pregnancy” OR “delivery” AND “monitoring” AND “evaluation”, and
“pregnancy” OR “delivery” AND “transmission” AND “measurement”
4. “market” AND “survey”, “market” AND “surveillance”, “market” AND “monitoring” AND
“evaluation”, and “market” AND “transmission” AND “measurement”
5. “public health” AND “intervention” OR “campaign” AND “survey”, “public health” AND
“intervention” OR “campaign” AND “surveillance”, “public health” AND “intervention”
OR “campaign” AND “monitoring” AND “evaluation”, and “public health” AND
“inter-vention” OR “campaign” AND “transmission” AND “measurement”
Inclusion criteria
A total of 13, 180 records were compiled into a searchable database, at which the key word
search resulted in the selection of 2,653 eligible abstracts for further review. These abstracts
were reviewed for specific mention of the comparison of malaria indicator estimates from an
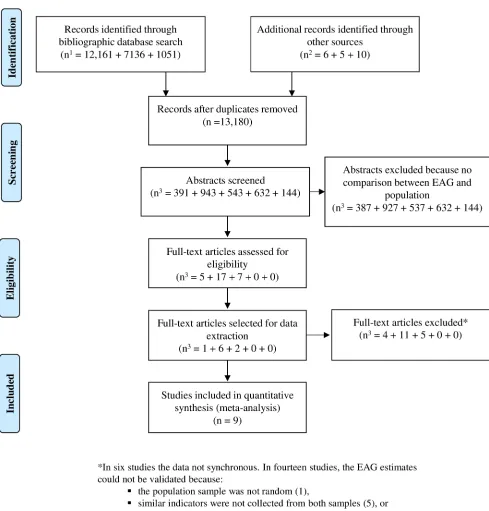
EAG sample with population sample (
Fig 1
) and 29 articles were selected for full text review.
Exclusion criteria
We searched for the full text of the selected 29 publications, and excluded studies in which
esti-mates of malaria control indicators from EAGs were not compared to a contemporaneous
ran-dom population sample from the same geographic area. Since the distribution of
Plasmodium
falciparum
infection in the population is determined by environmental factors that influence
the density of competent anopheline mosquitos, location-specific vector behaviour, and
human factors like at-risk status (e.g. age and pregnancy) and behaviour (e.g. ITN use) that
increase exposure to infectious mosquito bites [
17
–
19
]; to increase the accuracy of EAG
Pf
PR
estimates, we excluded all studies that did not compare EAG samples to population samples
from the same age or other at-risk stratum.
Selection of studies
Twenty of the twenty-nine studies selected for full review satisfied one or more exclusion
crite-ria and were not included in the systematic review (
Fig 1
). Six of the studies were excluded
because the data collected was not sufficiently synchronous between the EAG and population
sample [
20
–
25
]. In fourteen studies the validity of EAG estimates could not be determined
either because the population sample was not random [
26
], the same indicators were not
col-lected from both samples [
27
–
31
], or both samples were otherwise not comparable [
32
–
39
]. In
population, sampling frame, sampling methodology, sample size and sampling units. Data on
the first author, year of survey, survey site, year of publication, malaria transmission intensity
(e.g.
Pf
PR), and estimates of control progress were extracted for the systematic review.
Definitions
Anaemia prevalence rate (APR)
–Proportion of the population with a haemoglobin
measure-ment of
<
8 g/dL.
Antibody prevalence rate (AbPR)
–Proportion of the population seropositive to defined
malaria antigens.
Household bed net ownership
–Proportion of households with at least one bed net.
Household ITN ownership–
Proportion of households with at least one ITN.
Individual bed net use
–Proportion of population that slept under a bed net the previous
night.
Individual insecticide treated bed net (ITN) use
–Proportion of population that slept under
an ITN the previous night.
Indoor residual spraying (IRS) coverage
–Proportion of households sprayed with IRS in the
past 12 months.
Plasmodium falciparum prevalence rate (PfPR)
–Proportion of the population with malaria
infection detected by rapid diagnostic test (RDT), microscopy or polymerase chain reaction
(PCR).
Sick child visit–
Health facility visits during childhood for an illness episode.
Well child visit–
Routine health facility visits that occur during childhood that may include
immunizations, growth and development assessments, physical examination and other health
risk assessments.
Statistical analysis
Data analysis was done using Stata version 13.1
1
(StataCorp, Texas, USA). Using the
pre-sented data from tables in the selected publications, we calculated point estimates of control
progress indicators derived from EAGs and compared that to estimates from
contemporane-ous population samples. In one publication [
40
], due to absence of the numerator, we derived
the numerator from the reported rates and the denominator, and then calculated point
esti-mates and corresponding 95% confidence intervals. Where surveys were repeated either
sea-sonally or after a specific period [
41
,
42
], we presented these estimates separately to account
for seasonal or temporal effect respectively. We assessed the degree of accuracy in estimates
derived from EAG samples by examining the absolute difference in prevalence difference and
corresponding 95% confidence intervals and Pearson’s
χ
2 p values. Mean prevalence was
derived for the overall individual level estimates from the EAG and population samples. The
estimates for
Pf
PR were derived individually for each method of detection of parasitaemia e.g.
blood film, rapid diagnostic test. Malaria endemicity was classified according to the revised
Global Malaria Eradication Program classification [
43
]. Due to the inherent differences in
EAGs and the paucity of studies, we did not derive pooled estimate effects for each malaria
control indicator. To evaluate the effect of population coverage of control interventions and
transmission intensity on the validity of EAG estimates of control interventions and
Pf
PR
respectively, where possible, we correlated the prevalence difference with the population
prev-alence. We also evaluated the potential for any of the EAG samples to misclassify an area into
the wrong malaria endemicity category by comparing the classification of each area by
Results
Description of studies
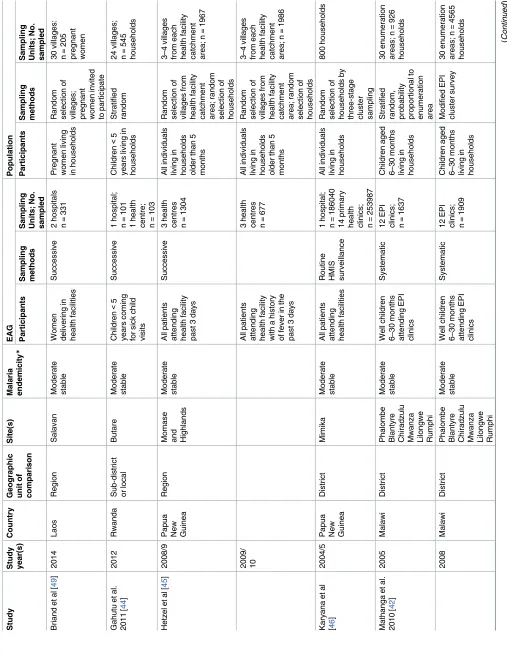
Nine studies were included in the systematic review (
Table 3
), all of which were from sites
with intense stable or moderate stable malaria transmission. Six studies assessed the accuracy
of estimates from health facilities [
40
–
42
,
44
–
46
], two studies assessed the accuracy of
esti-mates from school surveys [
47
,
48
], and one study assessed the accuracy of estimates from
antenatal clinics [
49
]. Three studies compared estimates from children less than 5 years old
[
40
,
42
,
44
], two studies compared estimates from older children [
47
,
48
], and four studies
compared estimates from all presenting individuals at health facilities (including ANC)
regard-less of age [
41
,
45
,
46
,
49
].
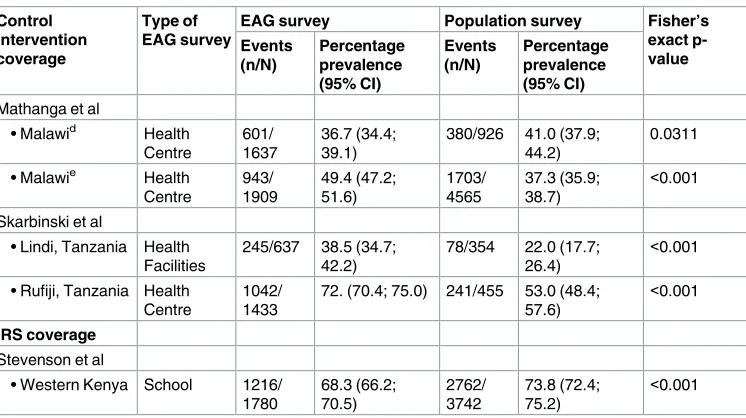
Comparison of estimates
Estimates of coverage of control interventions. Seven studies assessed the accuracy of
estimates of coverage of control interventions. (
Table 4
) [
40
–
42
,
44
,
47
–
49
]. The estimates of
coverage of different control interventions derived from EAGs were significantly higher than
those of the population in three studies [
40
,
44
,
47
], except for the estimates of household ITN
ownership which was concordant with the population in one of these studies [
47
]. In three
studies, estimates of control intervention coverage were significantly lower in EAGs [
41
,
48
,
49
]. In one study, estimates derived from parents/guardians of children aged 6–30 months
coming for well child visits in Malawi were concordant in the first year of survey (2005) but
significantly higher in the second survey (2008) [
42
]. In 2005, the estimates of individual bed
net use derived from this EAG (PR = 41.0%, 95% CI 38.9%, 47.4%) were slightly lower than
that in the same age stratum in the population (PR = 45.4%, 95% CI 39.0%, 51.7%, p = 0.0339),
though this difference is not significant due to overlapping confidence intervals. Similarly, the
estimate of individual ITN use derived from the EAG in the same survey (PR = 36.7%, 95% CI
31.1%, 42.4%) was not significantly different from that of the population (PR = 41.0%, 95% CI
34.1%, 40.5%, p = 0.0311). The study by Stevenson et al [
48
] investigated the concordance in
school and catchment area-based estimates of control intervention coverage across a range of
circumferential distances around each school. Estimates of individual bed net use derived
from school children living 601-1000m (PR = 31.3%, 95%CI 29.1%, 33.5%) and
>
1000m
(PR = 32.9%, 95%CI 29.1%, 33.5%) from the school were not significantly different from those
from school children within 600m of the school (PR = 33.4%, 95% CI 31.2%, 35.6%),
indicat-ing that inaccuracy remained relatively constant with changes in circumferential area within
the school’s catchment area. In the same study, estimates of IRS coverage from school children
living 601-1000m (PR = 70.7%, 95%CI 68.5%, 72.8%) and
>
1000m (PR = 72.9%, 95%CI
68.5%, 72.8%) from the school were not significantly different from those from school children
within 600m (PR = 68.3%, 95%CI 66.1%, 70.4%) of the school again indicating the inaccuracy
was not affected by circumferential area within the school’s catchment area.
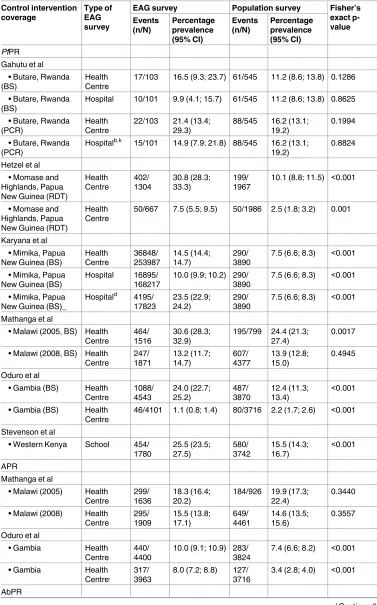
Estimates of malaria morbidity. Six studies assessed the accuracy of estimates of malaria
morbidity (
Table 5
) [
41
,
42
,
44
–
46
,
48
]. All six studies evaluated estimates of
Plasmodium
fal-ciparum
prevalence rate (
Pf
PR) either by rapid diagnostic test (RDT), microscopy or
polymer-ase chain reaction (PCR). In the studies where
Pf
PR was determined by microscopy, slides
were double read [
41
,
44
,
45
] or single read by an expert microscopist [
42
]. As an additional
measure, in two studies there was external quality control [
41
,
42
], and in one study PCR was
used to complement missing second reads and to disambiguate discordant species read results
[
45
]. In three studies, estimates of
Pf
PR derived from EAGs were significantly higher than
Table
health clinics; n=
Table
Stratified cluster sampling (Lindi)
5
46 government primary schools; n=
4888
Table 4. Comparison of estimates of coverage of control interventions between EAGs and the
EAG survey Population survey Fisher’s
exact
p-• Salavan, Laos ANC 307/331 92.8 (90.0; 95.5)
204/205 99.5 (98.5; 100.0)
<0.001
Ndyomugyeni et al
• Hoima, Uganda School 1261/ 3602
• Lindi, Tanzania Health Facilities
• Rufiji, Tanzania Health Centre
• Hoima, Uganda School 814/ 3602
• Salavan, Laos ANC 305/331 92.2 (89.3; 95.0)
Hospital 74/102 72.6 (63.9; 81.2)
286/543 52.7 (48.5; 56.9)
<0.001
Mathanga et al
• Malawid Health
Centre
• Malawie Health
Centre
• Gambia (2005) Health Centre
• Gambia (2008) Health Centre
• Lindi, Tanzania Health Facilities
• Rufiji, Tanzania Health Centre
attending health facilities for sick visits were not only concordant with population estimates
but there was also concordance between results derived by microscopy and PCR. The accuracy
of estimates
Pf
PR by RDT (Paracheck
1
, Orchid Biomedical Systems, India) derived from
school children with circumferential distance was assessed in one study [
48
], and the estimate
from this EAG remained consistently higher with increasing distance within the school
catch-ment area.
Three studies assessed the ability of EAGs to measure changes in
Pf
PR as result of changes
in coverage of interventions [
42
,
45
] or seasonal transmission [
41
]. When data was collected
before and one year after an ITN campaign in Papua New Guinea, the derived reduction in
Pf
PR by RDT in patients with a history of fever attending health facilities (absolute Risk
Dif-ference or RD = 23.3%, 95%CI 20.1%, 26.5%) was almost thrice that in the population (RD =
7.6%, 95%CI 6.1%, 9.1%) [
45
]. After a period of intense distribution of ITNs and a change in
first line therapy of malaria from sulphadoxine-pyrimethamine to artemether-lumefantrine
in Malawi, the reduction in
Pf
PR by malaria microscopy measured in children 6–30 months
attending well child clinics (RD = 17.4%, 95%CI 14.6%, 20.2%) was higher than that in the
same age strata in the population (RD = 10.5%, 95% CI 7.4%, 13.7%) [
41
], probably due to
sig-nificantly higher EAG estimates in the first survey (
Table 5
). The study by Oduro et al [
41
]
assessed the effect of seasonality on summary estimates
Pf
PR by malaria microscopy in all
patients attending HFs in six ecologically diverse areas in Gambia, a country with intensely
seasonal malaria transmission. In patients attending health facility regardless of cause, the
reduction in
Pf
PR between the rainy season and the dry season (RD = 22.8%, 95%CI 21.6%,
24.1%) was almost twice that from the HF catchment population (RD = 10.4%, 95%CI 9.3%,
11.6%), probably due to the significantly higher estimates in the rainy/post-rainy season.
Two studies compared estimates of anaemia prevalence rate (APR) between EAGs and the
population [
41
,
42
]. In the study by Mathanga et al [
42
], estimates of APR from children
attending well child clinics were not only concordant with values derived from the same age
strata in the population but this metric in children attending well child clinics (RD = 2.8%,
95% CI 0.4%, 5.3%) accurately reflected the reduction in the population (RD = 5.3%, 95% CI
2.6%, 8.1%). The other study in Gambia assessed the impact of seasonality on estimates of
APR derived from patients of all ages [
41
], and the difference between the rainy and dry season
Table 4. (Continued)
EAG survey Population survey Fisher’s
exact
p-• Malawid Health
Centre
• Malawie Health
Centre
• Lindi, Tanzania Health Facilities
• Rufiji, Tanzania Health Centre
1042/ 1433
72. (70.4; 75.0) 241/455 53.0 (48.4; 57.6)
<0.001
IRS coverage
Stevenson et al
Table 5. Comparison of estimates of coverage of malaria morbidity between EAGs and the
EAG survey Population survey Fisher’s
exact
p-17/103 16.5 (9.3; 23.7) 61/545 11.2 (8.6; 13.8) 0.1286
• Butare, Rwanda (BS)
Hospital 10/101 9.9 (4.1; 15.7) 61/545 11.2 (8.6; 13.8) 0.8625
• Butare, Rwanda
Hospitalb,k 15/101 14.9 (7.9; 21.8) 88/545 16.2 (13.1; 19.2)
10.1 (8.8; 11.5) <0.001
• Momase and Highlands, Papua New Guinea (RDT)
Health Centre
50/667 7.5 (5.5; 9.5) 50/1986 2.5 (1.8; 3.2) 0.001
Karyana et al
7.5 (6.6; 8.3) <0.001
• Mimika, Papua
7.5 (6.6; 8.3) <0.001
• Mimika, Papua
7.5 (6.6; 8.3) <0.001
Mathanga et al
• Malawi (2005, BS) Health Centre
• Malawi (2008, BS) Health Centre
• Gambia (BS) Health Centre
• Gambia (BS) Health Centre
46/4101 1.1 (0.8; 1.4) 80/3716 2.2 (1.7; 2.6) <0.001
Stevenson et al
• Western Kenya School 454/
1780
• Malawi (2005) Health Centre
• Malawi (2008) Health Centre
7.4 (6.6; 8.2) <0.001
• Gambia Health
3.4 (2.8; 4.0) <0.001
AbPR
estimates from this EAG (RD = 2.0%, 95%CI 0.8%, 3.2%) was similar to that in the population
(RD = 4.0%, 95%CI 3.0%, 5.0%) though both EAG estimates were consistently higher than
population estimates (
Table 5
).
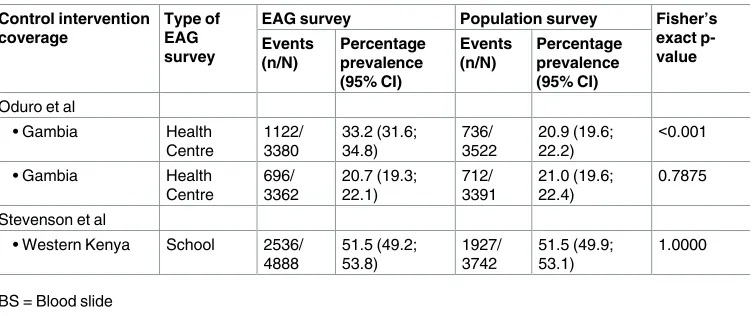
Two studies compared estimates of antibody prevalence between EAGs and the population
[
41
,
48
]. In the study in Gambia where malaria is intensely seasonal with one seasonal peak
[
41
], the difference in Merozoite Surface Protein 1
19(MSP1
19) seroprevalence between the
sea-sons in the EAG (RD = 12.5%, 95%CI 10.4%, 14.6%) was higher than the population (RD =
-0.1%, 95%CI -2.0%, 1.8%) due to overestimation of the population value in the rainy season
(
Table 5
). In a moderately stable malaria transmission setting where there are two seasonal
peaks of transmission (one major and the other minor), an assessment of AbPR using a
num-ber of antigens including Apical Membrane Antigen 1 (AMA1) and MSP1[
48
] in the month
immediately after the major peak revealed that the estimate from school children
(AbPR = 51.5%, 95% CI 49.2%, 53.8%) was concordant with that of the same age strata in the
population (AbPR = 51.5%, 95% CI 49.9%, 53.1%, p = 1.000), and remained so with increasing
distance within the school catchment area.
Assessment of accuracy of EAG estimates
Except for the study by Ndyomugyenyi et al [
47
] were estimates of household ITN ownership
derived from primary school children accurately represented population coverage (RD = 0,
95% CI -0.02, 0.02, p = 0.9759), estimates of control intervention coverage derived from EAGs
were subject to widely varying degrees of inaccuracy (RD range: -0.24–0.42), with EAGs
esti-mates more commonly but not exclusively over-estimating population values (
Fig 2
). In the
two studies that assessed the accuracy of multiple indicators of intervention coverage [
40
,
42
],
estimates of related indicators usually had a similar level of inaccuracy (
Fig 2
). In the study by
Mathanga et al [
42
], serial estimates of control intervention exhibited similar degree of bias in
estimates of individual bed net and ITN use in the first survey but were markedly different in
the subsequent survey (
Fig 2
). In the study by Skarbinski et al [
40
], the degree of accuracy in
estimates of household bed net ownership, individual bed net and ITN use was the same for
both well and sick child visits in Rufiji and ITN use in Lindi, whilst estimates of household bed
net ownership and individual bed net use were much higher in Lindi (
Table 2
,
Fig 2
) indicting
regional-specific bias (
Fig 2
).
Table 5. (Continued)
EAG survey Population survey Fisher’s
exact
p-• Western Kenya School 2536/
4888
BS = Blood slide
PCR = Polymerase chain reaction RDT = Rapid diagnostic test.
Estimates of
Pf
PR were on average more consistent than estimates of intervention coverage
(
Fig 2
). In the study by Gahutu et al [
44
], estimates of
Pf
PR by microscopy and PCR derived
from EAGs at different health facility levels were concordant with population values (
Fig 2
). In
the study by Mathanga et al [
42
], though serial estimates of
Pf
PR from children aged 6–30
months attending well child clinics accurately detected transmission reduction in the same age
strata in the population, the estimate of P
f
PR from this EAG was slightly higher than that in
the population in 2005 (RD = 0.06, 95% CI 0.02, 0.10, p = 0.002). Estimates of APR derived
from EAGs in two studies [
41
,
42
] were overall a more consistent estimation of population
prevalence than
Pf
PR (
Fig 2
). The close approximation of EAG estimates of APR together with
its accurate measurement of a reduction in population prevalence suggests that it is a good
sur-rogate indicator for APR in the population [
42
]. Estimates of AbPR derived from EAGs were
more accurate in the dry season in the Gambia [
41
], with rainy season estimates being higher
than population estimates (RD = 0.12, 95% CI 0.10, 0.02, p
<
0.001).
Two of the studies attempted to measure the degree of inaccuracy or improve the precision
of estimates by controlling for bias [
40
,
42
]. After controlling for potential confounders (age in
months, child’s sex, survey type and study area)in a multivariable analysis, in the study by
Skarbinski et al [
40
], the adjusted odds ratio (aOR) between the health facility survey and the
EAG survey for individual bed net use (aOR = 2.05, 95% CI 1.36, 3.08) and ITN use (aOR =
2.41, 95% CI 1.69, 3.44) still indicated an overestimation of population coverage. In the study
by Mathanga et al [
42
], after adjusting for confounders in a multivariate analysis, parasitaemia
in 2008 vs 2005 in children attending well child clinic (aOR = 0.31, 95% CI 0.22, 0.46) was
equivalent to that in the same age strata in the population (aOR = 0.40, 95% CI 0.30, 0.52), and
this was similar for anaemia (Hb
<
8.0d/dl) in this EAG (aOR = 0.85, 95% CI 0.65, 1.65)
com-pared to the population (aOR = 0.74, 95% CI 0.59, 0.94).
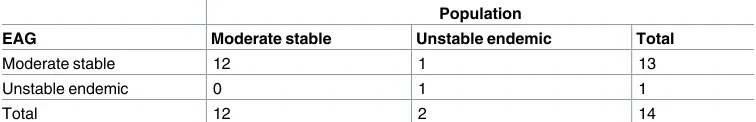
For EAG to guide control efforts, it should correctly classify the uptake of control
interven-tions and malaria endemicity. The prevalence difference in bed net use suggested that EAG
surveys overestimated population levels up to a certain point (population coverage of
ap-proximately 72%), after which they overestimated population values, but this trend was not
statistically significant (p = 0.993) (
Fig 3A
). The prevalence difference in
Pf
PR overestimated
population prevalence with increasing transmission (p = 0.979) (
Fig 3B
), but our assumptions
are also limited by the fact that the studies included in this review only covered moderately
sta-ble and unstasta-ble endemic transmission intensities. Based on the classification of malaria
endemicity from the
Pf
PR results, most of the EAG surveys (13/14) were concordant with that
of the population (
Table 6
). During the post-ITN survey in Papua New Guinea [
45
],
popula-tion
Pf
PR dropped to unstable endemic levels (
Pf
PR = 2.5%, 95%CI 1.8%; 3.2%) but was
wrongly classified to be moderate stable by the EAG (PfPR = 7.5%, 95%CI 5.5%; 9.5%.).
Discussion
Monitoring control progress is important to assess the effectiveness and coverage of malaria
control programmes. Easy access group surveys are easier to conduct than population surveys
and could provide accurate monitoring of control progress if the EAG sample is representative
of our population stratum of interest [
30
,
33
,
50
–
53
]. Review of the available literature on
there may be other sources of grey literature that may have been missed. We phrased our
search terms as simply as possible to allow a wider inclusion of possible papers and in this
regard, we may have missed some papers with highly selective titles. The studies selected for
the systematic review only included health facility (including ANC) and school surveys, and
were from settings with moderate and intense stable malaria transmission, so our results may
not be applicable to other EAGs or transmission settings. Our literature search was guided by
categories of EAGs with historical evidence of use for malaria surveillance or which we
theo-rized would be suitable for malaria surveillance at the district or sub-district level. This may
have excluded publications on other potential EAGs. We limited our review to studies that
compared EAG samples to populations samples of the same age or other at-risk stratum.
Whilst this may improve the accuracy of EAG estimates of
Pf
PR, especially in moderate to
severe transmission settings, this does not mean that EAGs could not be used to estimate
con-trol intervention coverage in any population stratum or
Pf
PR at the lower end of the
transmis-sion spectrum in other population at-risk strata. Given the pace of developments in analytical
technics, this is an area where substantial gains can be made and we discuss this below.
Dealing with bias in EAG surveillance
The main cause of bias in EAG surveillance is due to the selection of an unrepresentative
sam-ple of the population of interest. The opportunistic nature of the sampling frame in EAGs is
inherently susceptible to selection bias when EAG sampling captures an unrepresentative
sub-set of the population of interest. Particularly, if the reason for inclusion in the EAG sample is
associated with the indicator of interest. For example, given the fact that those who are
wealth-ier and more educated are more likely to attend health facilities, and have access to or use
ITNs [
54
,
55
], self-reported ITN possession and use from health facility surveys is likely to
over-estimate ITN coverage in the population. This could be corrected using the verification
rate measured from a small random sample of the catchment population. Also, the
representa-tiveness of estimates of
Pf
PR from health facilities is likely to be affected by the difference in
transmission between malaria seasons, overall malaria transmission and the prevalence of
non-malaria fevers. This could be limited by the use of EAGs excluding individuals coming for
sick visits [
56
,
57
] or prioritizing indictors that are less sensitive to short-term changes in
transmission like AbPR [
58
,
59
]. Population APR is also less sensitive to short term changes in
transmission [
60
], but whether this makes it an appropriate indicator to measure changes in
transmission is debatable. Though malaria is an important correlate of anaemia in children,
the aetiology of anaemia is multifactorial and in particular the role of other infections, poor
nutrition and the interaction between malaria and nutrition needs to be clarified [
61
]. Where
there is a high probability of inclusion in the EAG sample, the difference in the estimates of an
indicator measured from individuals who are and are not included in the EAG sample is likely
to be less significant, and the EAG sample is more likely to be representative of the true
situa-tion in the populasitua-tion. For example, coverage rates of public health intervensitua-tions were similar
between vaccinated and unvaccinated children if population vaccine coverage was over 60%
[
62
]. Most of the standard methods for analysis of data from convenience samples are based
on the questionable assumption that selection bias can be exclusively ascribed to measured
risk factors for malaria. Novel geostatistical methods have been recently developed to relax this
assumption [
63
]. By combining data from unbiased gold-standard surveys and opportunistic
Fig 2. Absolute prevalence difference in estimates of standard malaria indicators. ANC = Antenatal Clinic
OPD = All OPD SC = School children WSC = Well or sick child BS = Blood slide PCR = Polymerase chain reaction RDT = Rapid diagnostic test.
samples, these methods are able to correct for the selection bias in the convenience samples
that is induced by both measured and unmeasured risk factors. Though the aetiology of health
facility access and utilization is multifactorial [
64
–
69
], health facility utilization follows a
geo-graphic pattern [
70
–
73
] and if this can be accurately measured through a small geospatially
random sample of the population and accounted for in the model, will allow correction for
bias and the production of accurate maps of control progress. Where point estimates are
required, combining the EAG sample with a small and presumably far less expensive random
sample of the population [
74
], the so-called hybrid sampling methodology will generate more
accurate hybrid prevalence estimates. Pooling data from multiple EAGs in our area of interest
is also likely to improve the precision of point estimates [
47
,
75
].
Another cause of bias in EAG samples mainly affecting reported coverage of control
in-terventions is social desirability bias. Survey respondents may answer questions in a manner
they consider favourable to the interviewee leading to erroneously high self-reporting of
co-verage of control interventions [
76
]. This may be further compounded by the inability to
directly validate the presence and use of household-level and individual control measures as in
population surveys. Few studies have assessed the effect of social desirability bias on the effect
of bed net use [
77
–
80
], and the wide range in verification rate of bed net use after self-report
(60.9–96.2%) suggests variability in the effect of social desirability bias from setting to setting.
Social desirability bias can be limited by modifying the standard MIS questionnaire [
13
] to
include questions aimed at detecting and measuring social desirability bias so it can be directly
accounted for in analysis [
81
], improving interviewee confidence by indicating the anonymity
of their responses [
81
], or indirectly by correcting for the verification rate measured from a
random sample of the catchment population.
Use of EAG surveys to measure progress in malaria control
Before EAGs can be routinely used to measure malaria control progress, there are a few issues
to address. Firstly, how much inaccuracy we are willing to tolerate? If the purpose of the survey
is to measure trends in point estimates of control progress, some degree of inaccuracy is
tolera-ble if EAG data displays similar trends to population data; as evidenced by the successful
dem-onstration of transmission reduction from health facility surveys in some endemic countries
[
30
,
33
,
50
–
53
], and increasing endorsement by WHO as a surveillance tool in different
trans-mission settings and phases of control [
1
]. One study suggested that estimates of population
Pf
PR from health facility surveys might misclassify malaria endemicity at the lower end of the
transmission spectrum [
45
], but the population in this study (i.e. all health facility attendees)
may not be the most suitable to capture the most at-risk population at low transmission
set-tings. When more accurate point estimates are required or accurate data is required over a
large geographic area, pooling data from multiple similar EAGs [
47
,
75
] or hybrid sampling
methodology [
74
] may improve precision. If the purpose of the survey is to measure changes
Fig 3. Prevalence difference of bed net use and PfPR with population levels. https://doi.org/10.1371/journal.pone.0183330.g003
Table 6. Relationship between the results of the classification of malaria endemicity between EAG and population sampling.
Population
EAG Moderate stable Unstable endemic Total
Moderate stable 12 1 13
Unstable endemic 0 1 1
Total 12 2 14
in the the geospatial distribution of uptake of control interventions and transmission intensity,
to identify areas of low intervention coverage and potential hotspots respectively for targeted
control intervention delivery; the smaller sized EAG catchment areas compared to
commu-nity-based surveys [
70
–
73
] means the maps derived using EAG sampling will not be consistent
with those derived using community-level data and would require geospatial statistical
meth-ods to correct for bias [
63
].
Secondly, are EAGs surveys more cost effective than standard approaches? Because of the
ease of EAG sampling, conducting an EAG survey should theoretically be cheaper than a
pop-ulation survey in the same catchment area. Reports from school surveys in Kenya seem to
sug-gest that the financial cost of school surveys is less than half that of a household survey [
9
,
11
].
Though a detailed economic costs analysis of school surveys has not been done in comparison
to those from household surveys, and the lower financial costs has not been validated in other
EAGs; the decreased expenditure on personnel, transportation and communication in school
surveys compared to household surveys suggest that surveillance in EAGs is likely to be more
cost-effective [
9
].
Thirdly, when are EAG surveys most likely to be beneficial i.e. to complement malaria
pro-grammatic efforts? At moderate to high malaria transmission intensity, surveillance systems
rely on passive surveillance (e.g. HMISs) supplemented by large serial populations surveys
(e.g. MISs), with data reported at the national, regional and sometimes district level.
Surveil-lance in EAGs in such settings will be beneficial in providing more detailed sub-district
esti-mates from “problematic” districts with poor control progress compared to national average,
estimates from hard-to-reach communities (e.g. opportunistic surveys during MDA) who
would otherwise not be covered by population surveys, or when data is required to assess
at-risk stratum specific control interventions (e.g. ANC and delivery surveys to assess the impact
of Intermittent Preventive Treatment in pregnancy or IPTp). These EAG surveys should be
carried out at the same time as population surveys i.e. every 2–3 years, so that the estimates
can be interpreted within the context of a wider perspective of population control progress. As
transmission intensity falls and we approach the elimination phase, reorientation of
program-matic efforts are required to identify hotspots [
8
] and special high-risk populations [
82
,
83
]
both of which serve as reservoirs of infection that should be targeted for malaria elimination.
Population surveys become less logistically attractive and less practical given the fact that more
regular (e.g. quarterly) local (sub-district) level data is required on control progress.
Surveil-lance in EAGs becomes more attractive as a more sustainable method of surveilSurveil-lance including
the high-risk groups (e.g. rural community market surveys at border crossings).
Finally, how do we integrate surveillance in EAGs with current control strategies? EAG
sur-veillance can provide timely data of reasonable accuracy on control progress that reflect local
variation at the district or sub-district level, and is complementary to national
community-based surveys like MISs [
13
]. EAG surveys can provide a means of rapid assessment of areas
Conclusions
This review describes the previous experiences with the validation of estimates of malaria
con-trol progress from different EAGs and highlights the potential of surveillance in EAGs as a
complementary approach to current surveillance systems. The utility of an EAG for routine
surveillance of progress in malaria control at the district or sub-district programmatic level
will be driven by several factors including whether serial point estimates or more precise
geos-patial distribution is required, the degree of precision accepted, the desired population of
inter-est (e.g. at-risk groups), and the resources available for surveillance (both financial and
otherwise).The low cost of EAG surveillance, its flexibility and potential to offer locally
appli-cable timely estimates of control which could improve programmatic responses suggest that
further validation and optimization is required.
Supporting information
S1 Document. PRISMA 2009 checklist.
(DOC)
Acknowledgments
SSSS is supported by the Malaria Capacity Development Consortium which is funded by The
Wellcome Trust (Grant number WT084289MA), DJT is supported by the ACT consortium
(Grant number ACTia main/VA10). We would also like to acknowledge Marc Vittori of Sanofi
Pasteur Library Services Marcy L’Etoile who assisted with the updated bibliographic search.
Author Contributions
Conceptualization: Sanie S. S. Sesay, Dianne J. Terlouw.
Data curation: Sanie S. S. Sesay.
Formal analysis: Sanie S. S. Sesay.
Funding acquisition: Sanie S. S. Sesay, Dianne J. Terlouw.
Investigation: Sanie S. S. Sesay.
Methodology: Sanie S. S. Sesay, Peter J. Diggle, David Schellenberg, David G. Lalloo, Dianne J.
Terlouw.
Project administration: Sanie S. S. Sesay.
Resources: Sanie S. S. Sesay.
Software: Sanie S. S. Sesay.
Supervision: Peter J. Diggle, David G. Lalloo, Dianne J. Terlouw.
Validation: Sanie S. S. Sesay, David G. Lalloo, Dianne J. Terlouw.
Visualization: Sanie S. S. Sesay.
Writing – original draft: Sanie S. S. Sesay, Emanuele Giorgi, David G. Lalloo, Dianne J.
Terlouw.
Writing – review & editing: Sanie S. S. Sesay, Emanuele Giorgi, Peter J. Diggle, David
References
1. WHO. Disease surveillance for malaria control: an operational manual. Geneva2012 [cited 2017 13th April]. Available from:http://apps.who.int/iris/bitstream/10665/44851/1/9789241503341_eng.pdf?ua= 1.
2. WHO. Disease surveillance for malaria elimination: an operational manual. Geneva: World Health Organization; 2012 [cited 2017 13th April]. Available from:http://apps.who.int/iris/bitstream/10665/ 44852/1/9789241503334_eng.pdf?ua=1.
3. Cibulskis RE, Aregawi M, Williams R, Otten M, Dye C. Worldwide incidence of malaria in 2009: esti-mates, time trends, and a critique of methods. PLoS medicine. 2011; 8(12):e1001142. Epub 2011/12/ 30.https://doi.org/10.1371/journal.pmed.1001142PMID:22205883; PubMed Central PMCID: PMCPMC3243721.
4. Rudan I, Lawn J, Cousens S, Rowe AK, Boschi-Pinto C, Tomaskovic L, et al. Gaps in policy-relevant information on burden of disease in children: a systematic review. Lancet. 2005; 365(9476):2031–40. Epub 2005/06/14.https://doi.org/10.1016/S0140-6736(05)66697-4PMID:15950717.
5. RBM. Malaria Indicator Survey: Basic Documentation for Survey Design and Implementation: Roll Back Malaria; 2005 [cited 2017 13th April]. Available from:http://malariasurveys.org/toolkit.cfm.
6. Greenwood BM. The microepidemiology of malaria and its importance to malaria control. Transactions of the Royal Society of Tropical Medicine and Hygiene. 1989; 83 Suppl:25–9. Epub 1989/01/01. PMID:2576161.
7. Snow RW, Rowan KM, Lindsay SW, Greenwood BM. A trial of bed nets (mosquito nets) as a malaria control strategy in a rural area of The Gambia, West Africa. Transactions of the Royal Society of Tropi-cal Medicine and Hygiene. 1988; 82(2):212–5. Epub 1988/01/01. PMID:3055456.
8. Bousema T, Griffin JT, Sauerwein RW, Smith DL, Churcher TS, Takken W, et al. Hitting hotspots: spa-tial targeting of malaria for control and elimination. PLoS medicine. 2012; 9(1):e1001165. Epub 2012/ 02/04.https://doi.org/10.1371/journal.pmed.1001165PMID:22303287; PubMed Central PMCID: PMCPMC3269430.
9. Brooker S, Kolaczinski JH, Gitonga CW, Noor AM, Snow RW. The use of schools for malaria surveil-lance and programme evaluation in Africa. Malaria journal. 2009; 8:231. Epub 2009/10/21.https://doi. org/10.1186/1475-2875-8-231PMID:19840372; PubMed Central PMCID: PMCPMC2768743.
10. Santos LM, Paes-Sousa R, Silva Junior JB, Victora CG. National Immunization Day: a strategy to monitor health and nutrition indicators. Bulletin of the World Health Organization. 2008; 86(6):474–9. Epub 2008/06/24.https://doi.org/10.2471/BLT.07.043638PMID:18568277; PubMed Central PMCID: PMCPMC2647466.
11. Gitonga CW, Karanja PN, Kihara J, Mwanje M, Juma E, Snow RW, et al. Implementing school malaria surveys in Kenya: towards a national surveillance system. Malaria journal. 2010; 9:306. Epub 2010/ 11/03.https://doi.org/10.1186/1475-2875-9-306PMID:21034492; PubMed Central PMCID: PMCPMC2984573.
12. Law GR, Pascoe S, W. Foundations of Epidemiology. In: Law GR, Pascoe S, W., editors. Statistical Epidemiology. Boston: CAB International; 2013. p. 1–35.https://doi.org/10.1097/EDE.
0b013e31827623b1
13. MEASURE Evaluation, MEASURE DHS, PMI, RBM, UNICEF, World Health Organization Malaria Action Programme. Household Survey Indicators for Malaria Control: WHO; 2013. Available from: http://www.malariasurveys.org/documents/Household%20Survey%20Indicators%20for%20Malaria% 20Control.pdf.
14. WHO. WHO Document centre 2017 [cited 2017 13th April]. Available from:http://www.who.int/ malaria/publications/en/.
15. WHO/MAL. WHO/MAL series of OFFSET documents (1947–2000). Geneva: World Health Organiza-tion; 2012. Available from:http://www.who.int/malaria/publications/atoz/whomal_2012.1119.pdf.
16. Thacker SB, Parrish RG, Trowbridge FL. A method for evaluating systems of epidemiological surveil-lance. World health statistics quarterly Rapport trimestriel de statistiques sanitaires mondiales. 1988; 41(1):11–8. Epub 1988/01/01. PMID:3269210.
17. Boyd MF PP, Christophers R. Malariology A comprehensive survey of all aspects of this group of dis-eases from a global standpoint. Philadelphia and London: W.B. Saunders; 1949.
18. Molineaux LG G. The Garki Project: Research on the epidemiology and control of malaria in the Sudan Savanna of West Africa. Geneva: World Health Organization; 1980.
20. Mitja O, Paru R, Selve B, Betuela I, Siba P, De Lazzari E, et al. Malaria epidemiology in Lihir Island, Papua New Guinea. Malaria journal. 2013; 12:98.https://doi.org/10.1186/1475-2875-12-98PMID: 23497296; PubMed Central PMCID: PMCPMC3606355.
21. Stewart L, Gosling R, Griffin J, Gesase S, Campo J, Hashim R, et al. Rapid assessment of malaria transmission using age-specific sero-conversion rates. PloS one. 2009; 4(6):e6083. Epub 2009/06/30. https://doi.org/10.1371/journal.pone.0006083PMID:19562032; PubMed Central PMCID:
PMCPMC2698122.
22. Hagmann R, Charlwood JD, Gil V, Ferreira C, do Rosario V, Smith TA. Malaria and its possible control on the island of Principe. Malaria journal. 2003; 2:15. Epub 2003/07/24. https://doi.org/10.1186/1475-2875-2-15PMID:12875660; PubMed Central PMCID: PMC166171.
23. Howard N, Enayatullah S, Mohammad N, Mayan I, Shamszai Z, Rowland M, et al. Towards a strategy for malaria in pregnancy in Afghanistan: analysis of clinical realities and women’s perceptions of malaria and anaemia. Malaria journal. 2015; 14:431. Epub 2015/11/06.https://doi.org/10.1186/ s12936-015-0964-0PMID:26537247; PubMed Central PMCID: PMCPMC4633046.
24. Ilombe G, Maketa V, Mavoko HM, da Luz RI, Lutumba P, Van geertruyden JP. Performance of HRP2-based rapid test in children attending the health centre compared to asymptomatic children in the com-munity. Malaria journal. 2014; 13:308. Epub 2014/08/12.https://doi.org/10.1186/1475-2875-13-308 PMID:25108305; PubMed Central PMCID: PMCPMC4248466.
25. Parekh FK, Hernandez JN, Krogstad DJ, Casapia WM, Branch OH. Prevalence and risk of Plasmo-dium falciparum and P. vivax malaria among pregnant women living in the hypoendemic communities of the Peruvian Amazon. Am J Trop Med Hyg 2007; 77(3):451–7. PMID:17827359
26. Rulisa S, Kateera F, Bizimana JP, Agaba S, Dukuzumuremyi J, Baas L, et al. Malaria prevalence, spa-tial clustering and risk factors in a low endemic area of Eastern Rwanda: a cross sectional study. PloS one. 2013; 8(7):e69443. Epub 2013/08/13.https://doi.org/10.1371/journal.pone.0069443PMID: 23936018; PubMed Central PMCID: PMCPMC3720654.
27. Hanson K, Marchant T, Nathan R, Mponda H, Jones C, Bruce J, et al. Household ownership and use of insecticide treated nets among target groups after implementation of a national voucher programme in the United Republic of Tanzania: plausibility study using three annual cross sectional household sur-veys. BMJ (Clinical research ed). 2009; 339:b2434. Epub 2009/07/04.https://doi.org/10.1136/bmj. b2434PMID:19574316; PubMed Central PMCID: PMCPMC2714691.
28. Marchant T, Hanson K, Nathan R, Mponda H, Bruce J, Jones C, et al. Timing of delivery of malaria pre-ventive interventions in pregnancy: results from the Tanzania national voucher programme. Journal of epidemiology and community health. 2011; 65(1):78–82. Epub 2009/11/10.https://doi.org/10.1136/ jech.2008.085449PMID:19897468.
29. Parise ME, Lewis LS, Ayisi JG, Nahlen BL, Slutsker L, Muga R, et al. A rapid assessment approach for public health decision-making related to the prevention of malaria during pregnancy. Bulletin of the World Health Organization. 2003; 81(5):316–23. Epub 2003/07/12. PMID:12856049; PubMed Central PMCID: PMCPMC2572460.
30. Nyarango PM, Gebremeskel T, Mebrahtu G, Mufunda J, Abdulmumini U, Ogbamariam A, et al. A steep decline of malaria morbidity and mortality trends in Eritrea between 2000 and 2004: the effect of combination of control methods. Malaria journal. 2006; 5:33. Epub 2006/04/26.https://doi.org/10. 1186/1475-2875-5-33PMID:16635265; PubMed Central PMCID: PMCPMC1501031.
31. Owusu-Agyei S, Awini E, Anto F, Mensah-Afful T, Adjuik M, Hodgson A, et al. Assessing malaria con-trol in the Kassena-Nankana district of northern Ghana through repeated surveys using the RBM tools. Malaria journal. 2007; 6.https://doi.org/10.1186/1475-2875-6-103PMID:17683584
32. Sahu SS, Gunasekaran K, Vanamail P, Jambulingam P. Persistent foci of falciparum malaria among tribes over two decades in Koraput district of Odisha State, India. Malaria journal. 2013; 12:72. Epub 2013/02/26.https://doi.org/10.1186/1475-2875-12-72PMID:23433186; PubMed Central PMCID: PMCPMC3598688.
33. Rodrigues A, Schellenberg JA, Kofoed PE, Aaby P, Greenwood B. Changing pattern of malaria in Bis-sau, Guinea Bissau. Tropical medicine & international health: TM & IH. 2008; 13(3):410–7. Epub 2008/02/27.https://doi.org/10.1111/j.1365-3156.2008.02016.xPMID:18298608.
34. Pacific Malaria Initiative Survey Group on behalf of the Ministries of Health of V, Solomon I. Malaria on isolated Melanesian islands prior to the initiation of malaria elimination activities. Malaria journal. 2010; 9:218. Epub 2010/07/28.https://doi.org/10.1186/1475-2875-9-218PMID:20659316; PubMed Central PMCID: PMCPMC2921077.
36. Dicko A, Barry A, Dicko M, Sagara I, Rogier C, Doumbo OK. Seasonality and age specific malaria mor-bidity in Didieni, District Of Kolokani, Mali. ASTMH 62nd Annual Meeting November 13–17, 2013 Mar-riott Wardman Park, Washinton DC: ASTMH; 2010. p. 289.
37. Drakeley C, Stevenson J, Gitonga C, Spencer L, Oduor A, Oriango R, et al. A comparison of school-and community-based cross-sectional surveys for collection of serological measures of malaria trans-mission. ASTMH 62nd Annual Meeting November 13–17, 2013 Marriott Wardman Park, Washington DC: ASTMH; 2010. p. 231.
38. Stresman GH, Stevenson J, Owaga C, Marube E, Odongo W, Shaggari S, et al. Operational approaches for detecting foci of malaria infection: How do school and health facility surveys compare against a community based approach. ASTMH 62nd Annual Meeting November 13–17, 2013 Marriott Wardman Park, Washington DC: ASTMH; 2013. p. 436–7.
39. Onori E. Distribution of Plasmodium ovale in the eastern, western and northern regions of Uganda. Bulletin of the World Health Organization. 1967; 37(4):665–8. Epub 1967/01/01. PMID:5301742; PubMed Central PMCID: PMCPMC2554359.
40. Skarbinski J, Winston CA, Massaga JJ, Kachur SP, Rowe AK. Assessing the validity of health facility-based data on insecticide-treated bednet possession and use: comparison of data collected via health facility and household surveys—Lindi region and Rufiji district, Tanzania, 2005. Tropical medicine & international health: TM & IH. 2008; 13(3):396–405. Epub 2008/04/10. https://doi.org/10.1111/j.1365-3156.2008.02014.xPMID:18397401.
41. Oduro AR, Bojang KA, Conway DJ, Corrah T, Greenwood BM, Schellenberg D. Health centre surveys as a potential tool for monitoring malaria epidemiology by area and over time. PloS one. 2011; 6(11): e26305.https://doi.org/10.1371/journal.pone.0026305PMID:22073155; PubMed Central PMCID: PMCPMC3208541.
42. Mathanga DP, Campbell CH Jr., Vanden Eng J, Wolkon A, Bronzan RN, Malenga GJ, et al. Compari-son of anaemia and parasitaemia as indicators of malaria control in household and EPI-health facility surveys in Malawi. Malaria journal. 2010; 9:107. Epub 2010/04/23. https://doi.org/10.1186/1475-2875-9-107PMID:20409342; PubMed Central PMCID: PMCPMC2864286.
43. Hay SI, Smith DL, Snow RW. Measuring malaria endemicity from intense to interrupted transmission. Lancet Infect Dis. 2008; 8:369–78.https://doi.org/10.1016/S1473-3099(08)70069-0PMID:18387849
44. Gahutu JB, Steininger C, Shyirambere C, Zeile I, Cwinya-Ay N, Danquah I, et al. Prevalence and risk factors of malaria among children in southern highland Rwanda. Malaria journal. 2011; 10:134. Epub 2011/05/20.https://doi.org/10.1186/1475-2875-10-134PMID:21592380; PubMed Central PMCID: PMCPMC3121650.
45. Hetzel MW, Reimer LJ, Gideon G, Koimbu G, Barnadas C, Makita L, et al. Changes in malaria burden and transmission in sentinel sites after the roll-out of long-lasting insecticidal nets in Papua New Guinea. Parasites & vectors. 2016; 9(1):340. Epub 2016/06/16. https://doi.org/10.1186/s13071-016-1635-xPMID:27301964; PubMed Central PMCID: PMCPMC4908799.
46. Karyana M, Burdarm L, Yeung S, Kenangalem E, Wariker N, Maristela R, et al. Malaria morbidity in Papua Indonesia, an area with multidrug resistant Plasmodium vivax and Plasmodium falciparum. Malaria journal. 2008; 7:148. Epub 2008/08/05.https://doi.org/10.1186/1475-2875-7-148PMID: 18673572; PubMed Central PMCID: PMCPMC2518158.
47. Ndyomugyenyi R, Kroeger A. Using schoolchildren’s reports of bed net use monitored by schoolteach-ers as a proxy of community coverage in malaria endemic areas of Uganda. Tropical medicine & inter-national health: TM & IH. 2007; 12(2):230–7. Epub 2007/02/16.https://doi.org/10.1111/j.1365-3156. 2006.01767.xPMID:17300630.
48. Stevenson JC, Stresman GH, Gitonga CW, Gillig J, Owaga C, Marube E, et al. Reliability of school surveys in estimating geographic variation in malaria transmission in the western Kenyan highlands. PloS one. 2013; 8(10):e77641. Epub 2013/10/22.https://doi.org/10.1371/journal.pone.0077641 PMID:24143250; PubMed Central PMCID: PMCPMC3797060.
49. Briand V, Le Hesran JY, Mayxay M, Newton PN, Bertin G, Houze S, et al. Prevalence of malaria in pregnancy in southern Laos: a cross-sectional survey. Malaria journal. 2016; 15(1):436.https://doi. org/10.1186/s12936-016-1492-2PMID:27566274; PubMed Central PMCID: PMCPMC5002160.
50. Ceesay SJ, Casals-Pascual C, Erskine J, Anya SE, Duah NO, Fulford AJ, et al. Changes in malaria indices between 1999 and 2007 in The Gambia: a retrospective analysis. Lancet. 2008; 372 (9649):1545–54. Epub 2008/11/06.https://doi.org/10.1016/S0140-6736(08)61654-2PMID: 18984187; PubMed Central PMCID: PMCPMC2607025.
52. Erhart A, Thang ND, Xa NX, Thieu NQ, Hung LX, Hung NQ, et al. Accuracy of the health information system on malaria surveillance in Vietnam. Transactions of the Royal Society of Tropical Medicine and Hygiene. 2007; 101(3):216–25. Epub 2006/09/19.https://doi.org/10.1016/j.trstmh.2006.07.003 PMID:16979202.
53. O’Meara WP, Bejon P, Mwangi TW, Okiro EA, Peshu N, Snow RW, et al. Effect of a fall in malaria transmission on morbidity and mortality in Kilifi, Kenya. Lancet. 2008; 372(9649):1555–62. Epub 2008/ 11/06.https://doi.org/10.1016/S0140-6736(08)61655-4PMID:18984188; PubMed Central PMCID: PMCPMC2607008.
54. Zegers de Beyl C, Koenker H, Acosta A, Onyefunafoa EO, Adegbe E, McCartney-Melstad A, et al. Multi-country comparison of delivery strategies for mass campaigns to achieve universal coverage with insecticide-treated nets: what works best? Malaria journal. 2016; 15:58. Epub 2016/02/05.https:// doi.org/10.1186/s12936-016-1108-xPMID:26842732; PubMed Central PMCID: PMCPMC4740992.
55. Babalola S, Ricotta E, Awantang G, Lewicky N, Koenker H, Toso M. Correlates of Intra-Household ITN Use in Liberia: A Multilevel Analysis of Household Survey Data. PloS one. 2016; 11(7):e0158331. Epub 2016/07/13.https://doi.org/10.1371/journal.pone.0158331PMID:27403877; PubMed Central PMCID: PMCPMC4942134.
56. UNICEF. Expanded Immunization Coverage 2017 [cited 2017 13th April]. Available from:http://www. unicef.org/immunization/index_coverage.html.
57. UNICEF. Antenatal Care 2017 [cited 2017 13th April]. Available from:https://data.unicef.org/topic/ maternal-health/antenatal-care/.
58. Voller A, Draper CC. Immunodiagnosis and sero-epidemiology of malaria. British medical bulletin. 1982; 38(2):173–7. Epub 1982/05/01. PMID:6810986.
59. Corran P, Coleman P, Riley E, Drakeley C. Serology: a robust indicator of malaria transmission inten-sity? Trends Parasitol. 2007; 23(12):575–82.https://doi.org/10.1016/j.pt.2007.08.023PMID: 17988945.
60. Korenromp EL, Armstrong-Schellenberg JR, Williams BG, Nahlen BL, Snow RW. Impact of malaria control on childhood anaemia in Africa—a quantitative review. Tropical medicine & international health: TM & IH. 2004; 9(10):1050–65. Epub 2004/10/16.https://doi.org/10.1111/j.1365-3156.2004. 01317.xPMID:15482397.
61. McCuskee S, Brickl