Migration of lymphatic endothelial cells and lymphatic
vascular development in the craniofacial region
of embryonic mice
YUJI TAYA*, KAORI SATO, YOUICHI SHIRAKO and YUUICHI SOENO
Department of Pathology, The Nippon Dental University School of Life Dentistry at Tokyo, Tokyo, JapanABSTRACT Lymphatic development in mice is initiated in the trunk at embryonic day (E) 9.5. This study aimed to examine the origin of craniofacial lymphatic endothelial cells (LECs) and the developmental process of lymphatic vessels in the mouse craniofacial region. Serial sections from ICR mouse embryos at E9.5–E14.5 were immunolabeled with LEC and venous endothelial cell (VEC) markers. These markers included prospero homeobox protein 1 (Prox1), vascular endothelial growth factor receptor 3 (Vegfr3), lymphatic vessel endothelial hyaluronan receptor 1 (Lyve1), and C-C motif chemokine 2 (Ccl21) for LEC, and COUP transcription factor 2 (CoupTF2) and endomucin (Emcn) for VEC. LECs were monitored as an index in Prox1/Vegfr3 double-positive cells using three-dimensional analysis because LECs express Prox1 and Vegfr3 ab initio during lymphatic vascular development. LECs appeared in VECs of the lateral walls of cardinal veins (CVs) at E9.5. These LECs were dichotomized into LEC populations that formed lymph sacs close to CVs and were scattered in the surrounding CVs. The scattered LECs formed cellular streams and extended from the trunk to the mandibular arches at E10.5 - E11.5. In the mandibular arches, individual LECs aggregated, and formed lymph sacs and tubular lymphatic vessels at E11.5–E14.5. Expression of the LEC marker proteins Lyve1 and Ccl21 in LECs changed during craniofacial lymphatic vascular development. Col-lectively, these findings suggest that craniofacial LECs originate from CVs of the trunk and migrate into the mandibular arches. Additionally, we found that craniofacial lymphatic vessels are formed according to morphogenesis of individual LECs that migrate from CVs.
KEY WORDS:
lymphatic vascular development, lymphatic endothelial cell, craniofacial development, migration
Introduction
Lymphatic development in the mouse embryo is initiated in a subpopulation of venous endothelial cells (VECs) in the walls of cardinal veins (CVs) at approximately embryonic day (E) 9.5 (Alitalo 2011; Koltowska et al., 2013). Lymphatic endothelial cells (LECs) differentiate directly from VECs in CVs. Recently, Klotz et al., (2015) showed that 20% of LECs in the lymphatic vasculature of the heart originate in the yolk sac. Yang et al., (2012) showed that LECs are present in CVs and intersomitic vessels.
LECs that differentiate from VECs in CVs form the lymph sacs and lymphatic vessels near the CVs in the trunk. There are several hypotheses for the development of tubular lymphatic vasculature (Koltowska et al., 2013; Neufeld et al., 2014; Chen et al., 2014). In the balloon and sprouting model, LECs form pre-lymphatic
www.intjdevbiol.com
*Address correspondence to: Yuji Taya. Department of Pathology, The Nippon Dental University School of Life Dentistry at Tokyo, 1-9-20 Fujimi, Chiyoda-ku, Tokyo
102-8159, Japan. Tel: +81-3-3261-8911. Fax: +81-3-3261-8969. E-mail: taya-yu@tky.ndu.ac.jp - web: http://www.ndu.ac.jp/~pathhome/index.html - https://orcid.org/0000-0001-5663-0835
Supplementary Material (two figures and 4 videos) for this paper is available at: https://doi.org/10.1387/ijdb.170218yt
Submitted: 26 August, 2017. Accepted: 14 February, 2018. Edited by: Makoto Asashima.
ISSN: Online 1696-3547, Print 0214-6282
© 2018 UPV/EHU Press Printed in Spain
Abbreviations used in this paper: Ccl21, C-C motif chemokine 2; CoupTF2, COUP
transcription factor 2; CV, cardinal vein; Emcn, endomucin; LEC, lymphatic en-dothelial cell; Lyve1, lymphatic vessel enen-dothelial hyaluronan receptor 1; Prox1, prospero homeobox protein 1; VEC, venous endothelial cell; Vegfr3, vascular endothelial growth factor receptor 3; 3D, three-dimensional.
vessels (Tammela and Alitalo 2010). Lymphatic capillaries collect lymph from the interstitium and drain it into collecting lymphatic vessels (Chen et al., 2014).
The transcription factor prospero homeobox protein 1 (Prox1) is required for LEC commitment (Wigle and Oliver 1999). Initial lymphangiogenesis in the mouse embryo involves onset of ex-pression of the transcription factor Prox1 in a subpopulation of VECs at E9.5 (Koltowska et al., 2013). COUP transcription factor
2 (CoupTF2) functions in VECs and CoupTF2 interacts with Prox1 in differentiation of VECs into LECs (Yamazaki et al., 2009). The tyrosine kinase receptor, vascular endothelial growth factor receptor 3 (Vegfr3), lies downstream of Prox1 (Tammela and Alitalo 2010). Prox1 upregulates Vegfr3 in LECs prior to migration. Directed migration of LECs depends on Vegfc, which is the ligand of Vegfr3 (Karkkainen et al., 2004).
Many studies have demonstrated the use of the other
pheno-Fig. 1. Lymphatic endothelial cell differentiation in the cardinal vein and lymphatic development in the trunk. Histological frontal serial sections of mouse embryos were dual immunolabeled with anti-Prox1 antibody (red) in com-bination with anti-Emcn, Vegfr3, CoupTF2, Ccl21, or Lyve1 antibody (green) at E9.5 (A–F), E10.5 (G–L), and 11.5 (M–R). Cell nuclei were stained with DAPI (blue). Panels of (B), (H), and (N) are a higher magnification of the boxes in (A), (G), and (M), respectively. Panels (C–F), (I–L), and (O–R) are equiva-lent to the same regions as (B), (H), and (N) in the adjacent sections, respectively. Notably, individual Lyve1-negative/ Prox1-positive cells (arrowheads) are distributed in the vicin-ity of CVs (F,L,R). Arrows show Prox1/Lyve1 double-positive cells (F,L,R). Asterisks show lymph sacs in the proximity of the CVs (N–R). MaA, mandibular arches; TN, neural tube; TrB, trunk of the body; Trc, trachea. Scale bars, 200 mm (A,G,M) and 50 mm (B–F, H–L, N–R).
typic molecules, such as lymphatic vessel endothelial hyaluronan receptor 1 (Lyve1), C-C motif chemokine 2 (Ccl21), and podoplanin, as markers of LECs. Lyve1 is a transmembrane receptor for the glycosaminoglycan hyaluronan. Lyve1 expression remains nearly exclusively confined to lymphatic vessels (Jurisic and Detmar 2009; Hill et al., 2015). Ccl21 functions in adaptive immune responses and inflammation (Comerford et al., 2013). Ccl21 is secreted by LECs, but not by VECs. Podoplanin is a mucin-type transmembrane glycoprotein that is highly expressed in LECs (Oliver and Srinivasan 2010).
However, these markers are expressed in other cell types. Prox1 is also expressed in various tissues, including brain, liver and pancreas other than LECs (Alitalo 2011; Tammela and Alitalo 2010). Vegfr3 is expressed in VECs in early angiogenesis, as well as in LECs (Koltowska et al., 2013). Macrophages, T lympho-cytes, and basal cells in stratified squamous epithelium express Lyve1, Ccl21, and podoplanin, respectively (Ji et al., 2006; Noda et al., 2010). François et al., (2012) showed that Lyve1 expression was weak in LECs that migrate from the CVs in E10.5–11.5 mouse embryos. Therefore, there is difficulty in choosing LEC markers to identify LECs because the state of LECs varies ac-cording to embryonic stage and location.
There have been few studies on lymphangiogenesis in the craniofacial region in mouse embryos. Hill et al., (2015) reported impairment in lymphatic development in the palatal shelves at E13.5–14.5 in genetically modified mice by monitoring Lyve1-immunolabeled LECs. Taka-hashi et al., (2012) demonstrated that mesenchymal cells that are positive for Vegfc, Vegfd, and Vegfr3 are present in the dental papilla of mandibular molars at E14 and that lymphatic vessels comprise Vegfr3-positive LECs
G
O
B
C
D
E
F
H
I
J
K
L
P
Q
R
A
in presumptive molar pulps after E17. Saaristo et al., (2000) showed that Vegfr3 is expressed in blood and lymphatic ves-sels in the nasal mucosa at E16.5.
Thus far, when and where craniofacial LECs originate, and how craniofacial lymphatic vessels are formed are unknown. Therefore, to determine the precise mechanism of lymphatic development, we examined the origin of craniofacial LECs and morphological development of lymphatic vessels in the craniofacial region of embryonic mice.
Results
Initial lymphatic development in the vicinity of cardinal veins
To identify LECs in the process of lymphatic development in the trunk, dual immunolabeling with the combination of Prox1 and Vegfr3, CoupTF2, Ccl21, or Lyve1 was carried out. In the lateral walls of CVs, VECs that were Emcn- and CoupTF2-positive were Prox1-positive at E9.5 (Fig. 1 A–C). These Prox1-positive cells were Vegfr3-positive and Ccl21-negative, and Lyve1-positive or Lyve1-negative (Fig. 1 D–F). At E10.5, double-positive cells of Emcn/Prox1, CoupTF2/Prox1, Vegfr3/Prox1, and Lyve1/Prox1 became more obvious (Fig. 1 G–J, L). At E11.5, Prox1-positive cells in the CVs showed the same phenotype as that at E10.5 (Fig. 1 M–R).
Additionally, Prox1-positive cells that budded or were scattered from the CVs were observed at E9.5. These Prox1-positive cells were Emcn-, CoupTF2-, and Vegfr3-Prox1-positive, but Ccl21-negative, and Lyve1-positive or Lyve1-negative (Fig. 1 A–C). Ccl21/Prox1 double-positive cells appeared near the CVs at E10.5 (Fig. 1K). At E11.5, Prox1-positive cells in the lymph sacs that were formed near the CVs were Vegfr3-, CoupTF2-, Ccl21-, and Lyve1-positive, but Emcn-negative (Fig. 1 M–R). Additionallyx, individual Lyve1-negative/Prox1-positive cells still remained in the vicinity of CVs (Fig. 1R).
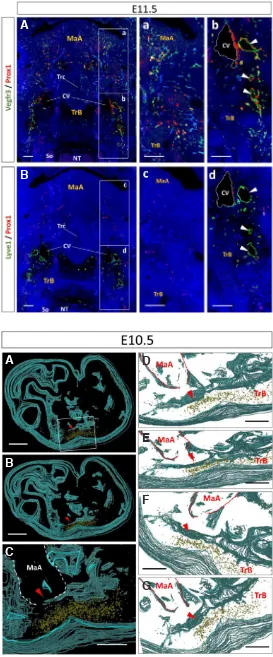
Our observations showed that VECs in the lateral walls of Fig. 2. Lymphatic endothelial cells moving from cardinal veins toward the craniofacial region. Histological frontal sections were dual immunolabeled with anti-Prox1 antibody (red) in combination with anti-Vegfr3 (A,a,b) or Lyve1 (B,c,d) antibody (green) at E11.5. Cell nuclei were stained with DAPI (blue). Panels of (a,b) and (c,d) are a higher magnification of the boxes in (A) and (B), respectively. (B) Shows the adjacent section to (A). Arrowheads show lymph sacs. Notably, individual LECs (Vegfr3/Prox1 double-positive) that were distributed from the CVs to the craniofacial region remained Vegfr3/ Prox1 double-positive, but were Lyve1-negative. MaA: mandibular arches; So: somite; TN: neural tube; TrB: trunk of the body; Trc: trachea. Scale bars, 200 mm (A,B) and 50 mm (a,b,c,d).
Fig. 3. Three-dimensional visualization of the lymphatic endo-thelial cell population distributed in the trunk. Three-dimensional images were constructed from 34 sagittal serial sections (approxi-mately 136 mm in width) with Prox1 and Vegfr3 dual immunolabeling at E10.5. Yellow areas indicate Vegfr3/Prox1 double-positive cells. Blue
areas indicate the outline of embryonic tissues (including the tissue septum and body surface). (A) Lateral view of a mouse embryo. (B) Inclined view. (C) Higher magnification of the boxed region in (A). (D–G) Various views in the same area as (C). Arrowheads show the leading group of the LEC stream. MaA, mandibular arches; TrB, trunk of the body. Scale bars, 500 mm (A, B, C) and 250 mm (D–G).
B
A
B
C
A
G
D
E
CVs expressed Prox1 in initial lymphatic development after E9.5. These Prox1-positive cells were Vegfr3-positive ab initio during lymphangiogenesis (Fig. 1), but were not always Ccl21- or Lyve1-positive. Therefore, we considered Vegfr3/Prox1 double-positive cells as LECs, and use the term LECs for Vegfr3/Prox1 double-positive cells hereafter.
Distribution of lymphatic endothelial cells from the cardinal veins to the craniofacial region
Fig. 2 shows the distribution of LECs as an index in Prox1 and Vegfr3 in a wide visual field, including the mandibular arches and neural tube, as well as the trunk at E11.5. LECs were localized in the lateral regions of mandibular arches, where were distant to the CVs, as well as in the vicinity of CVs (Fig. 2A, a,b). These LECs showed cellular streams that were scattered individually, and continuously distributed from CVs to the lateral regions of mandibular arches.
In adjacent sections that were dual immunolabeled with the combination of Lyve1 and Prox1, Lyve1/Prox1 double-positive cells and Lyve1-negative/Prox1-positive cells were localized in the vicinity of CVs. However, in the mandibular arches and surrounding area, Lyve1-negative/Prox1-positive cells, but not Lyve1/Prox1 double-positive cells, were localized (Fig. 2B, c,d). Notably, the distribution of these Lyve1-negative/Prox1-positive cells was comparable with that of Vegfr3/Prox1 double-positive cells. Additionally, these LECs were CoupTF2- and Emcn-positive, but Ccl21-negative (data not shown).
Three-dimensional visualization of lymphatic endothelial cell streams
At E10.5, LEC streams were distributed from the middle of the trunk to the adjacent mandibular arches (n = 3, Fig. 3, Supp. videos 1, 2). Although LEC streams were observed as a cluster of cells, these cells were isolated individually. A small number of LECs at the tip of stream were observed in the entrance of the mandibular arches. At E11.5, the LEC streams were distributed from the middle of the trunk to the mandibular arches (n = 2, Fig. 4, Supp. videos 3, 4). The tip of the LEC streams were localized in the mandibular arches. Notably, these LECs were distributed in the mandibular arches earlier than in other craniofacial regions.
The LEC streams were distributed to the middle areas of the sagittal half of the body in the left–right axis (data not shown). These LECs were restricted to a narrow space (approximately 120–150-mm
wide at E10.5, 160–200-mm wide at E11.5) in the left–right axis as
shown by three-dimensional (3D) measurements. However, these LECs were scattered over a relatively wide area (approximately 180–220-mm wide at E10.5, 250–300-mm wide at E11.5) in the
dorsoventral axis. There was almost no difference in distribution of LEC streams between individual embryos at each stage.
Lymphatic vascular development in the craniofacial region LECs were not detected in the craniofacial region until E9.5 (Fig. 5 A,B). Few LECs were observed for the first time in the mandibular arches of the craniofacial region at approximately E10.5 (Fig. 5 C,D). LECs formed cell masses that comprised several LECs at E11.5 (Fig. 5 E,F). LEC masses rearranged themselves, resulting in formation of unlumenized lymph sacs at approximately E12.5 (Fig. 5 G,H). Additionally, the distribution of LECs extended gradually into the craniofacial region. Finally, lumenized lymph sacs and lymphatic vessels were formed in the craniofacial region after approximately E14.5 (Fig. 5 I,J).
Histomorphometric analysis validated these findings. To evaluate the change in number of LECs during cra-niofacial development, LECs were counted in the unit area (0.035 mm2) of the sublingual regions at E9.5–E14.5 (Fig. 6). A small number of LECs appeared at E10.5. LECs significantly increased after E11.5 compared with E10.5 (p < 0.01).
LECs were CoupTF2- and Emcn-positive, but Lyve1- and Ccl21-negative, before E11.5 (data not shown).
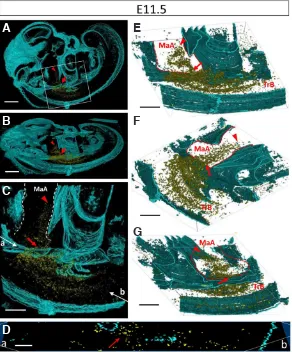
Fig. 4. Three-dimensional visualization of the lymphatic endothelial cell population distributed from the trunk to the mandibular arches. Three-dimensional images were constructed from 45 sagittal serial sections (approximately 180 mm in width) with Prox1 and Vegfr3 dual immunolabeling at E11.5. Yellow areas indicate Vegfr3/Prox1 double-positive cells. Blue areas indicate the outline of embryonic tissues (including the tissue septum and body surface). (A) Lateral view of a mouse embryo. (B) Inclined view. (C) Enlargement of the boxed region in (A). (D) Slice image of (a–b) plate in (C). (E–G) Various views in the same area as (C). Panel (G) shows the back view of (E). Arrowheads show the leading group of the LEC stream. Arrows show the narrow insertion site of LECs into the mandibular arches. MaA, mandibular arches; TrB, trunk of the body. Scale bars, 500 mm (A,B), 250 mm (C, E–G), and 100 mm (D).
B
C
D
A
G
E
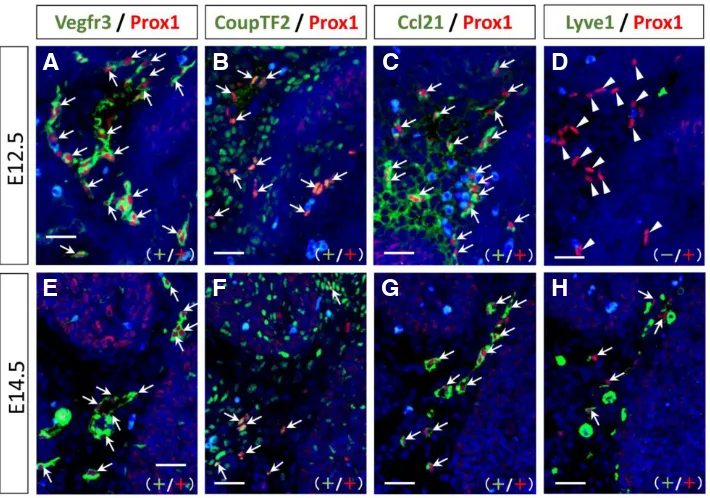
However, LECs became Ccl21-positive and Emcn-negative (data not shown) in the sublingual regions of the mandibular arches at E12.5 (Fig. 7 A–D). At E14.5, LECs became Lyve1-positive, and thus expressed the markers of Prox1, Vegfr3, CoupTF2, Lyve1, and Ccl21. Notably, any state of LECs, including individually, ag-gregated, and forming lymph sacs and lymphatic vessels, showed the same phenotype in the mandibular arches at E14.5 (Fig. 7 E–H).
This phenotypic change in LECs regarding Lyve1 immunoreac-tion at E12.5–E14.5 was validated by histomorphometric analysis. Fig. 8 shows the relationship between the densities of Vegfr3/Prox1 double-positive cells and Lyve1-positive or -negative/Prox1-positive cells in the mandibular arches. At E12.5, the density of Lyve1/Prox1 double-positive cells was low compared with that of Vegfr3/Prox1 double-positive cells (Fig. 8A). There was a small number of Lyve1/ Prox1 double-positive cells at this stage. However, at E14.5, the density of Vegfr3/Prox1 double-positive cells was almost equal to that of Lyve1/Prox1 double-positive cells in the same area (cor-relation coefficient: r = 0.99, y = 0.98x + 0.37, p < 0.001) (Fig. 8B). Notably this graph is similar to the graph of “y = x”.
Moreover, at E12.5, the density of Vegfr3/Prox1 double-positive cells and Lyve1-negative/Prox1-positive cells was nearly equal in the same area (correlation coefficient: r = 0.96, y = 0.88x + 1.03, p < 0.001) (Fig. 8C). This graph is also similar to the graph of “y = x”.
At E14.5, Lyve1-negative/Prox1-positive cells were not observed in the sublingual regions (Fig. 8D). Additionally, there were no Vegfr3-negative and Prox1-positive cells in the sublingual regions of the mandibular arches at E12.5 and E14.5.
Discussion
In early lymphangiogenesis in mouse embryos, a distinct cluster of VECs in CVs express the Prox1 transcription factor in mouse embryos, indicating differentiation into the first LECs (Alitalo 2011; Koltowska et al., 2013). LECs that differentiate from VECs in CVs form the lymph sacs and lymphatic vessels near the CVs in the trunk (Chen et al., 2014). Immunohistochemical analysis in our study showed that Vegfr3/Prox1 double-positive cells appeared in the VECs of the lateral walls of CVs at E9.5–E11.5. A portion of these LECs budded from CVs and formed lymph sacs adjacent to CVs. These data suggest differentiation from VECs to LECs.
Additionally, we found that the other LECs were scattered in the proximity of CVs. These scattered LECs were distributed individu-ally from the surrounding CVs to the lateral region of mandibular arches. Moreover, the combination of immunohistochemistry and 3D analysis showed that the tip of LEC streams was localized in the mandibular arches earlier than in other craniofacial regions at E11.5, although LEC streams were distributed from the middle of the trunk to the adjacent mandibular arches at E10.5. Histomorphometric analysis also indicated that LECs were significantly increased after E11.5 compared with E10.5 in the mandibu-lar arches. François et al., (2012) suggested that streams of LECs that sprout from CVs form the superficial lymphatic capillary network via cell migration toward the dorsolateral edge of embryos (migrating model). Therefore, our data support the migrating model in which a population of LECs sprouts, migrates away from the CVs, and gives rise to superficial lymphatic vessels. Craniofacial LECs may have the same origin as LECs of other regions, such as the surrounding mesenchyme of CVs and the back skin of the trunk (Yang et al., 2012; François et al., 2012; Hägerling et al., 2013). Collectively, these findings suggest that craniofacial LECs may originate from VECs of CVs in the trunk and migrate into the mandibular arches.
This study is the first to examine early
cranio-Fig. 5. Lymphatic vascular development in the cra-niofacial region. Histological frontal sections of the craniofacial regions were dual immunolabeled with anti-Prox1 (red) and Vegfr3 antibodies (green) at E9.5 (A,B), E10.5 (C,D), E11.5 (E,F), E12.5 (G,H), and E14.5 (I,J). Cell nuclei were stained with DAPI (blue). Panels of (B,D,F,H,J) are a higher magnification of the boxes in (A,C,E,G,I), respectively. Arrows show Vegfr3/Prox1 double-positive LECs. Small arrowheads show small masses of LECs (Vegfr3/Prox1 double-positive). The asterisk shows a lymph sac. Large arrowheads show lymphatic vessels. MaA, mandibular arches; MxA, maxillary arches; T, tongue; 2BA, secondary branchial arches. Scale bars, 200 mm (A,C,E,G,I) and 50 mm in the magnified figures (B,D,F,H,J).
B
C
D
E
F
A
G
H
I
facial lymphangiogenesis in embryonic mice. A diagram of this process, based on our findings, is shown in Fig. 9. We examined lymphatic vascular morphogenesis chronologically after craniofacial LECs arrive at the mandibular arches at E10.5–E11.5. Individual LECs aggregated and became lymph sacs, and finally, tubular lymphatic vessels formed in the craniofacial region. With regard to the development of tubular lymphatic vasculature near the CVs, several hypotheses such as the balloon and sprouting model and the budding model, have been proposed (Koltowska et al., 2013; Neufeld et al., 2014; Chen et al., 2014). This progression of lym-phatic vascular morphogenesis in the craniofacial region differs from that in these models (Yang et al., 2012; François et al., 2012; Hägerling et al., 2013) because the lymphatic vasculature in these models is formed directly from CVs. A population of LECs has been proposed to migrate from the CVs via direct sprouting (François et al., 2012). Early development of craniofacial lymphatic vasculature
is assumed to shares feature with the migrating model.
To discriminate craniofacial and truncal LECs during early lym-phangiogenesis, we monitored expression of several markers (i.e., Lyve1, Ccl21, CoupTF2, and Emcn) by immunohistochemistry. We found that LECs became Ccl21-positive and Emcn-negative after aggregation in the mandibular arches, although Prox1, Vegfr3, and CoupTF2 were constitutively expressed throughout embryo-genesis. Hägerling et al., (2013) also showed that Emcn became undetectable concomitantly with aggregation of LECs after E12.0. LECs may lose the property of VECs when Emcn is lost from ag-gregated LECs. LECs express Ccl21 in the primordium of lymph nodes in mouse embryos (Comerford et al., 2013). The Ccl21 receptor Ccr7 is widely expressed in various types of immune cells, including naive and central memory T cells and naive B cells after birth. Therefore, LECs that express Ccl21 might be prepared to interact with immune cells in the lymphatic system.
We also found that LECs that were distributed from the sur-rounding CVs of the trunk to the mandibular arches were Lyve1-negative until the stages at which the lymph sac and lymphatic vessels formed in the mandibular arches. However, LECs that differentiated in the CVs were Lyve-1-positive. The density of Lyve1-negative/Prox1-positive cells was nearly equal to that of Vegfr3/Prox1 double-positive cells at E12.5. Additionally, the density of Lyve1/Prox1 double-positive cells was almost equal to that of Vegfr3/Prox1 double-positive cells at E14.5. Notably the graphs of these relationships were similar to the graph of “y = x”. There were also no Vegfr3-negative and Prox1-positive cells in the sublingual regions of the mandibular arches at E12.5 and E14.5. These findings suggest that most LECs that were Lyve1-negative at E12.5 became Lyve1-positive at E14.5 in the mandibular arches. With regard to the reduction of Lyve1 expression in LECs, Norrmén et al., (2009) demonstrated that superficial LECs in the skin downregulated Lyve1 during lymphangiogenesis in mouse embryos. LECs in the dorsal superficial lymphatic plexus have significantly lower Lyve1 levels (Hägerling et al., 2013). François et al., (2012) also showed that individual LECs or groups of LECs
Fig. 7. Phenotypic changes in lymphatic endothelial cells in the sublingual regions of the mandibular arches during craniofacial development. Histological serial sections were dual immunolabeled with anti-Prox1 antibody (red) in combination with anti-Vegfr3, CoupTF2, Ccl21, or Lyve1 antibody (green) at E12.5 (A–D) and E14.5 (E–H). Cell nuclei were stained with DAPI (blue). Panels of (A) and (E) are higher magnification views from Figure 5H and 5J, respectively. Panels (B–D) and (F–H) are equivalent to the same regions as (A) and (E) in the adjacent sections, respectively. Ar-rows indicate double-positive cells with each combination of antibodies. Arrowheads show Lyve1-negative/Prox1-positive cells. Notably, although Lyve1 was not detected in LECs at E12.5, LECs became Lyve1-positive at E14.5. Scale bars, 25 mm.
Fig. 6. Increase in lymphatic endothelial cell count in the sublingual regions of the mandibular arches during craniofacial development. LECs in the unit area (0.035 mm2) of the sublingual regions were evaluated for an index in Vegfr3/Prox1 double-positive cells at E9.5–E14.5 (number of embryos at each stage: n = 3 for E12.5 and E13.5; n = 4 for E9.5, E10.5, and E14.5; n = 5 for E11.5). *p < 0.01.
G
B
C
D
E
F
H
migration in the trunk and the aggregation in the mandibular arches, although LECs were Lyve1-positive in the states of differentiation in CVs and lumenized tube formation in the vicinity of CVs in the trunk. However, our study showed that LECs became Lyve1-positive in any state of LECs, such as individual cells, aggregated cells, and formed into lymph sacs and lymphatic vessels at E14.5. Recently, Hill et al., (2015) demonstrated abnormal lymphatic develop-ment at E13.5–14.5 in transforming growth factor beta receptor 3 (Tgfbr3)-null mice according to Lyve1-immunolabeled LECs. They also showed that Lyve1 expression declined according to Tgfbr3 deletion. They suggested that Tgfbr3 signaling regulates lymphatic development and Lyve1 is a downstream factor of Tgfbr3. Lyve1 expression through Tgfbr3 signaling may be associated with Lyve1 expression in the craniofacial region at E14.5.
Several studies on early lymphangiogenesis in the craniofacial region of mouse embryos used Lyve1 or Vegfr3 as LEC markers (Saaristo et al., 2000; Takahashi et al., 2012; Hill et al., 2015). Lyve1 levels in craniofacial LEC aggregates decline after they arrive to the mandibular arches and as cells migrate away from the CVs. Moreover, Vegfr3 is expressed in VECs in the embryonic stage (Yang et al., 2016). We observed Vegfr3-positive VECs in developing venous vessels. Therefore, to precisely identify LECs, suitable LEC markers need to be chosen, depending on the cellular status and embryonic stage.
Fig. 8. Relationship between the densities of Vegfr3/Prox1 double-positive cells and Lyve1-double-positive or -negative/Prox1-double-positive cells in the mandibular arches. Each plot shows the densities of Vegfr3/Prox1 double-positive cells versus Lyve1-positive (A,B) or Lyve1-negative (C,D)/ Prox1-positive cells in the same square of the same area at the sublingual regions of the mandibular arches in sections next to each other at E12.5 (A,C) and E14.5 (B,D) (number of embryos at each stage: n = 3). Notably, that graphs of (B) and (C) are similar to the graph of “y = x”.
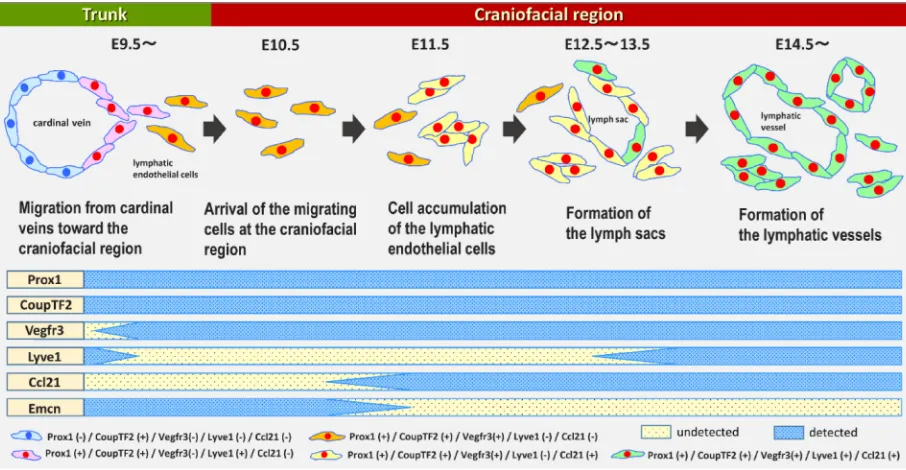
Fig. 9. Schema of the process of lymphatic development in the craniofacial region and phenotypic change in lymphatic endothelial cells. The top of the figure shows the process of lymphatic differentiation from venous endothelial cells (VECs) of cardinal veins (CVs), migration of LECs from the trunk to the craniofacial region, and lymphatic vascular development in the craniofacial region based on our findings. The bottom of the figure indicates the phenotypic changes in LEC and VEC markers in craniofacial LECs during lymphangiogenesis.
migrated from the CVs, beginning at approximately E10.0, and that Lyve1 expression was weak in cells that were migrating from the CVs at E10.5–11.5. These authors speculated that this differential expression of markers in LECs might reflect disparate levels of dependence on certain lymphangiogenic signals for the genesis of each state of LECs in lymphangiogenesis (e.g., cell migration and aggregation, and lumenized tube formation). In our observation, Lyve1 was also undetectable in the states of LECs such as the
B
C
D
In this study, the LEC streams were located in a narrow space along well-defined regions from CVs to the mandibular arches at E10.5 and E11.5. Moreover, histological analysis showed that craniofacial LECs migrated to the mandibular arches earlier than into other areas of the craniofacial region at approximately E11.5. Therefore, we speculate that migration of craniofacial LECs from the surrounding CVs to the mandibular arches is controlled by a guidance system. Many studies in embryonic mice have reported a guidance system in which various cell populations, such as neural crest cells, neuronal cells, and myogenic cells, migrate along well-defined routes toward target tissues (Taya and Aoba 2007; Kuo and Erickson 2010; Marín et al., 2010). During lymphangiogenesis, Cxcl12a-Cxcr4 signaling directs assembly and patterning of the early truncal lymphatic network (Cha et al., 2015). Leu et al., (2016) also showed that semaphorin 3G, which arises from blood vessels, provides a repulsive guidance cue to LECs during dermal lymphatic vascular development. With regard to LEC migration from CVs into the craniofacial region, Tgfbr3 signaling and its downstream factor Lyve1 may be associated with this guidance system. To identify such a navigational program for craniofacial LECs, the factors that propel craniofacial LECs toward the mandibular arches should be examined.
Materials and Methods
Mice
Pregnant time-mated ICR mice were obtained from a local supplier (Charles River, Yokohama, Japan). All mice were kept under a 12-h/12-h light-dark cycle and were provided standard laboratory chow and water ad libitum. The morning of the day on which a vaginal plug was found was designated E0.5. Animal maintenance and use protocols complied with approved institutional use and followed the guidelines of Nippon Dental University. To collect tissue specimens, dams were euthanized by cervical dislocation. Their uteri were dissected and placed in Hanks’ balanced salt solution (Invitrogen, Carlsbad, CA, USA) at 4°C. Embryos were rinsed with fresh Hanks’ balanced salt solution to remove amniotic fluid and blood, and tissue that included the selected craniofacial regions was removed.
Tissue preparation
Tissue specimens were fixed in 4% paraformaldehyde, dehydrated in alcohol, immersed in xylene, and embedded in paraffin wax. We prepared serial transverse or frontal sections (4-mm thick) from the head, neck, and trunk regions of embryos at E9.5–14.5 (number of embryos at each stage: n > 3). For histology-based 3D reconstruction, we used an electronic, motorized, semi-automatic rotary microtome (HM355S; Microm, Walldorf, Germany) with a section transferring system (STS; Microm) under estab-lished conditions for tissue preparation to eliminate uneven thickness and distortion of sections (Sugimoto et al., 2015). The section transferring system was mounted directly on the microtome to guide the sections by continuous laminar flow of water from the knife edge into the water bath without manual manipulation. Glass slides were mounted with more than 18 sections each to save time and labor during the dual immunolabeling process.
Immunohistochemistry
For examination by laser scanning confocal microscopy (LSM 700; Zeiss, Jena, Germany) with LSM software (ZEN 2014; Zeiss), serial sec-tions were immunolabeled with anti-mouse Prox1 (1:50; 11-002, AngioBio; CA, USA), anti-mouse Vegfr3 (1:50; AF743, R&D; MN, USA), anti-mouse Lyve1 (1:1000; AF2125, R&D), anti-mouse Ccl21 (1:300; AF457, R&D), anti-mouse CoupTF2 (1:1000; PP-H7147, Perseus Proteomics; Tokyo, Japan), and anti-mouse Emcn (1:1250; AF4666, R&D).
Antigen retrieval was performed by heating the sections in a microwave for 10 min at 90°C (H2800; Energy Beam Sciences, Inc., East Granby,
CT, USA) in 10 mM Tris buffer with 0.05% Tween 20, pH 9.0. Nonspecific binding sites were blocked with 5% skim milk, followed by incubation in a humidified chamber with primary antibodies for 15 h at 4°C. Alexa Fluor-conjugated secondary antibodies (Abcam, Cambridge, MA, USA) were applied at a final dilution of 1:100 in phosphate-buffered saline for 60 min at room temperature. Immunoreactivity was visualized using Alexa Fluor 488 (excited at 488 nm, green) and Alexa Fluor 568 (excited at 568 nm, red) for the various combinations of antibodies. Cell nuclei were stained with 4’,6-diamidino-2-phenylindole (DAPI) (excited at 358 nm, blue, S24535, SlowFade Antifade kit with DAPI; Invitrogen). Specific staining was validated with secondary antibodies alone or normal immunoglobulin G.
For histology-based 3D reconstruction, we performed dual immunola-beling for all serial sections from mouse embryos at E10.5–11.5 using a combination of Prox1 and Vegfr3 antibodies to distinguish LECs from other types of cells as previously described (Sugimoto et al., 2015). Deparaffinized sections were heated for antigen retrieval, treated with 3% H2O2 for 20 min, and blocked in 5% skim milk. This was followed by incubation with a anti-Prox1 and anti-Vegfr3 cocktail for 15 h at 4°C. The sections were incubated with biotinylated anti-rabbit and anti-goat immunoglobulin G (Vector Labo-ratories, Burlingame, CA, USA), diluted to 1:200 for 1 h, and treated with avidin/biotin complex solution (ABC Elite kit; Vector Laboratories) for 30 min at room temperature. The signal was detected with PermaBlue (K051; DBS, CA, USA) and aminoethylcarbazole (AEC, 415011; Nichirei, Tokyo, Japan).
Histology-based 3D reconstruction
Histology-based 3D reconstruction was used to investigate the distribution of craniofacial LECs from the trunk to the craniofacial region as previously described (Sugimoto et al., 2015). To obtain high-resolution digitization of consecutive wide-range images in series, all immunolabeled serial sections were digitized by virtual microscopy using a 20× objective (NanoZoomer HT; Hamamatsu Photonics, Hamamatsu, Japan). The manufacturer provided viewing software with which we could automatically adjust the scanning mode freely to capture individual histological areas on a glass slide according to their numerical order. Each dataset comprised 150–180 images at E10.5 and 250–300 images at E11.5 from the sagittal half of embryos. An entire series of digitized histological images (resolution of 0.46 mm per pixel, 8246 × 5642 pixels, and 140-MB, 32-bit RGB TIFF format) were stored. Image registration (rough and fine alignment of consecutive histological images), segmentation (identification of the boundaries of target structures in the images), 3D configuration, and 3D representation were performed using the FIJI plug-in for open source ImageJ software (NIH, Bethesda, MD, USA). This plug-in provides practical solutions for managing memory and automated approaches to 3D registration and visualization (Supp. Fig. S1). Finally, we obtained a stack of serial images that were used to recon-struct the 3D configuration of the specimen. The Z-depth was adjusted to the thickness of each slice (4 mm) to yield an accurate 3D representation of tissue volume. Image processing and visualization were performed on a 64-bit Windows-based personal computer with 32 gigabytes of random-access memory (Dell, Plano, TX, USA) that was capable of handling large volumes of images. To segment Prox1 (nuclear) and Vegfr3 (cell membrane and cytoplasm) double-positive cells, overlapping regions of double positivity were acquired according to dilation of Vegfr3 regions using the dilate com-mand in FIJI software. After image processing, we validated the results of segmentation for each microscopic field by overlaying segmented elements onto the original immunolabeled sections on a computer screen.
Moreover, 3D movies were reconstructed from the 3D image of the LEC stream based on serial sections of E10.5 and E11.5 mouse embryos with Vegfr3 and Prox1 dual immunolabeling. The 3D movies were represented using the 3D viewer plug-in for open source ImageJ software. The movie files were saved as the format of video clips (avi) and were set to view us-ing Windows Media Player.
Morphometric analysis
were counted for an index in Vegfr3/Prox1 double-positive cells (number of embryos at each stage: n = 3 for E12.5 and E13.5; n = 4 for E9.5, E10.5, and E14.5; n = 5 for E11.5, Supp. Fig. S2). Measurement of sublingual regions occurred in the location where LECs appeared earliest in the craniofacial region.
Moreover, to validate that LECs in the mandibular arches changed into Lyve1-positive from Lyve1-negative, correlations between the densities of Vegfr3/Prox1 double-positive cells and Lyve1-positive or Lyve1-negative/ Prox1-positive cells in the sublingual regions at E12.5 and E14.5 were determined. The sections next to each other that were dual immunolabeled with Vegfr3/Prox1 and Lyve1/Prox1 were used (number of embryos at each stage: n = 3). Measurement in sections next to each other was carried out in the same square of the same area at the sublingual regions. The numbers of Vegfr3/Prox1 double-positive cells, Lyve1/Prox1 double-positive cells, Lyve1-negative/Prox1-positive cells, and total cells in each measurement area were counted. The ratios of the number of Vegfr3/Prox1 double-positive cells per total cells, Lyve1/Prox1 double-positive cells per total cells, and Lyve1-negative/Prox1-positive cells per total cells were calculated.
Additionally, with regard to the measurement on the 3D images, the width of the region in which LECs distributed was determined according to counting the number of serious sagittal sections (4-mm thick) in the left–right axis and measuring of the length in the dorsoventral axis on the 3D images.
Statistical analysis
Data are presented as mean ± standard error of the mean. Statistical comparisons were carried out with one-way analysis of variance with Bon-nferroni post-hoc corrections. A simple regression was carried out for cor-relation analysis. A p value was considered as significant (Microsoft Excel 2013, Microsoft, Redmond, WA, USA; add-in software Excel Toukei 2012, Social Survey Research Information Co., Ltd., Tokyo, Japan).
Acknowledgment
This work was supported by JSPS KAKENHI (grant numbers 26462799 and 15K11024). We thank Ellen Knapp, PhD, from Edanz Group (www. edanzediting.com/ac) for editing a draft of this manuscript. The authors declare no potential conflicts of interest with respect to the authorship and/ or publication of this article.
References
ALITALO K (2011). The lymphatic vasculature in disease. Nat Med 17: 1371–1380. CHA Y R, FUJITA M, BUTLER M, ISOGAI S, KOCHHAN E, SIEKMANN A F,
WEIN-STEIN B M (2012). Chemokine signaling directs trunk lymphatic network formation along the preexisting blood vasculature. Dev Cell 22: 824–836.
CHEN H, GRIFFIN C, XIA L, SRINIVASAN R S (2014). Molecular and cellular mecha-nisms of lymphatic vascular maturation. Microvasc Res 96: 16–22.
COMERFORD I, HARATA-LEE Y, BUNTING M D, GREGOR C, KARA E E, MCCOLL S R (2013). A myriad of functions and complex regulation of the CCR7/CCL19/ CCL21 chemokine axis in the adaptive immune system. Cytokine Growth Factor Rev 24: 269–283.
FRANÇOIS M, SHORT K, SECKER G A, COMBES A, SCHWARZ Q, DAVIDSON T L, SMYTH I, HONG Y K, HARVEY N L, KOOPMAN P (2012). Segmental territories along the cardinal veins generate lymph sacs via a ballooning mechanism during embryonic lymphangiogenesis in mice. Dev Biol 364: 89–98.
HÄGERLING R, POLLMANN C, ANDREAS M, SCHMIDT C, NURMI H, ADAMS R H, ALITALO K, ANDRESEN V, SCHULTE-MERKER S, KIEFER F (2013). A novel multistep mechanism for initial lymphangiogenesis in mouse embryos based on ultramicroscopy. EMBO J 32: 629–644.
HILL C R, JACOBS B H, BROWN C B, BARNETT J V, GOUDY S L (2015). Type III transforming growth factor beta receptor regulates vascular and osteoblast development during palatogenesis. Dev Dyn 244: 122–133.
JI R C, KURIHARA K, KATO S (2006). Lymphatic vascular endothelial hyaluronan receptor (LYVE)-1- and CCL21-positive lymphatic compartments in the diabetic thymus. Anat Sci Int 81: 201–209.
JURISIC G, DETMAR M (2009). Lymphatic endothelium in health and disease. Cell Tissue Res 335: 97–108.
KARKKAINEN M J, HAIKO P, SAINIO K, PARTANEN J, TAIPALE J, PETROVA T V, JELTSCH M, JACKSON D G, TALIKKA M, RAUVALA H et al., (2004). Vascular endothelial growth factor C is required for sprouting of the first lymphatic vessels from embryonic veins. Nat Immunol 5: 74–80.
KLOTZ L, NORMAN S, VIEIRA J M, MASTERS M, ROHLING M, DUBÉ K N, BOL-LINI S, MATSUZAKI F, CARR C A, RILEY P R (2015). Cardiac lymphatics are heterogeneous in origin and respond to injury. Nature 522: 62–67.
KOLTOWSKA K, BETTERMAN K L, HARVEY N L, HOGAN B M (2013). Getting out and about: the emergence and morphogenesis of the vertebrate lymphatic vasculature. Development 140: 1857–1870.
KUO B R, ERICKSON C A (2010). Regional differences in neural crest morphogenesis. Cell Adhes Migr 4: 567–585.
LEU X, UEMURA A, FUKUSHIMA Y, YOSHIDA Y, HIRASHIMA M (2016). Semaphorin 3G provides a repulsive guidance cue to lymphatic endothelial cells via neuropilin-2/ plexinD1. Cell Rep 17: 2299–2311.
MARÍN O, VALIENTE M, GE X, TSAI L H (2010). Guiding neuronal cell migrations. Cold Spring Harb Perspect Biol 2: a001834.
NEUFELD S, PLANAS-PAZ L, LAMMERT E (2014). Blood and lymphatic vascular tube formation in mouse. Semin Cell Dev Biol 31: 115–123.
NODA Y, AMANO I, HATA M, KOJIMA H, SAWA Y (2010). Immunohistochemical examination on the distribution of cells expressed lymphatic endothelial marker podoplanin and LYVE-1 in the mouse tongue tissue. Acta Histochem Cytochem 43: 61–68.
NORRMÉN C, IVANOV K I, CHENG J, ZANGGER N, DELORENZI M, JAQUET M, MIURA N, PUOLAKKAINEN P, HORSLEY V, HU J et al. (2009). FOXC2 controls formation and maturation of lymphatic collecting vessels through cooperation with NFATc1. J Cell Biol 185: 439–457.
OLIVER G, SRINIVASAN R S (2010). Endothelial cell plasticity: how to become and remain a lymphatic endothelial cell. Development 137: 363–372.
SAARISTO A, PARTANEN T A, AROLA J, JUSSILA L, HYTÖNEN M, MÄKITIE A, VENTO S, KAIPAINEN A, MALMBERG H, ALITALO K (2000). Vascular endothelial growth factor-C and its receptor VEGFR-3 in the nasal mucosa and in nasopharyngeal tumors. Am J Pathol 157: 7–14.
SUGIMOTO T, TAYA Y, SHIMAZU Y, SOENO Y, SATO K, AOBA T (2015). Three-dimensional visualization of developing neurovascular architecture in the craniofacial region of embryonic mice. Anat Rec 298: 1824–1835.
TAKAHASHI S, AMBE K, KON H, TAKADA S, OHNO T, WATANABE H (2012). Immu-nohistochemical investigation of lymphatic vessel formation control in mouse tooth development: lymphatic vessel-forming factors and receptors in tooth development in mice. Tissue Cell 44: 170–181.
TAMMELA T, ALITALO K (2010). Lymphangiogenesis: Molecular mechanisms and future promise. Cell 140: 460–476.
TAYA Y, AOBA T (2007). Molecular mechanisms governing early myogenesis of mouse tongue. J Oral Biosci 49: 211–215.
WIGLE J T, OLIVER G (1999). Prox1 function is required for the development of the murine lymphatic system. Cell 98: 769–778.
YAMAZAKI T, YOSHIMATSU Y, MORISHITA Y, MIYAZONO K, WATABE T (2009). COUPTF2 regulates the functions of Prox1 in lymphatic endothelial cells through direct interaction. Genes Cell 14: 425–434.
YANG Y, GARCÍA-VERDUGO J M, SORIANO-NAVARRO M, SRINIVASAN R S, SCAL-LAN J P, SINGH M K, EPSTEIN J A, OLIVER G (2012). Lymphatic endothelial progenitors bud from the cardinal vein and intersomitic vessels in mammalian embryos. Blood 120: 2340–2348.
Early hematopoietic and vascular development in the chick.
Hiroki Nagai, Masahiro Shin, Wei Weng, Fumie Nakazawa, Lars Martin Jakt, Cantas Alev and Guojun Sheng. Int. J. Dev. Biol. 62: 137 - 144 (2018).
https://doi.org/10.1387/ijdb.170291gs
Molecular mechanisms of lymphangiogenesis in development and cancer
Imke Albrecht and Gerhard Christofori Int. J. Dev. Biol. (2011) 55: 483-494 https://doi.org/10.1387/ijdb.103226ia
Angiogenesis in Development and Cancer Today.
Domenico Ribatti and Valentin Djonov Int. J. Dev. Biol. (2011) 55: 343-344.
5 yr ISI Impact Factor (2016) = 2.421 Vascular development: from precursor cells to branched arterial and venous networks
Anne Eichmann, Li Yuan, Delphine Moyon, Ferdinand leNoble, Luc Pardanaud and Chris-tiane Bréant
Int. J. Dev. Biol. (2005) 49: 259-267 https://doi.org/10.1387/ijdb.041941ae