SIMULTANEOUS REVERSE-PHASE ULTRA PERFORMANCE LIQUID CHROMATOGRAPHY
METHOD DEVELOPMENT AND VALIDATION FOR ESTIMATION OF GRAZOPREVIR AND
ELBASVIR
MADHAVI S*, PRAMEELA RANI A
1Department of pharmaceutical sciences, University College of Pharmaceutical Sciences, Acharya Nagarjuna University, Guntur,
Andhra Pradesh, India. Email: [email protected]
Received: 02 August 2017, Revised and Accepted: 19 December 2017
ABSTRACT
Objective: The objective of this study was to develop and validate rapid, specific, sensitive, and precise reverse-phase ultra performance liquid chromatography (RP-UPLC) method for the quantitative determination of grazoprevir and elbasvir, as there are no official monograph and no analytical method by UPLC.
Methods: Chromatographic separation was achieved on a Waters Acquity UPLC HSS C18 (2.1 mm × 100 mm, 1.8 micron) column with a 45:55 (v/v) mixture of 0.1% orthophosphoric acid (pH 2.8) and acetonitrile as a mobile phase, thermostated at 30°C with a short run time of 3.0 min.
Results: The retention times were 0.73 and 1.29 min for grazoprevir and elbasvir, respectively. Quantification is achieved with TUV detection at
254 nm over the concentration range of 25–150 μg/ml for grazoprevir and for elbasvir 12.5–75 μg/ml, with a correlation coefficient of 0.999 and
0.999, respectively. The developed method was validated according to the International Conference on Harmonization (ICH) guidelines with respect to linearity, accuracy, precision, specificity, and robustness. Forced degradation study was extended out under acidic, alkaline, oxidative, photolytic, and thermal conditions to demonstrate the stability-indicating capability of the developed UPLC method. The degradation products were well resolved from the main peak, thus proved the stability-indicating power of the method. The results of the analysis were validated statistically.
Conclusion: The method is precise, accurate, linear, robust, and fast. The short retention time allows the analysis of a large number of samples in a short period of time and, therefore, should be cost-effective for routine analysis in the pharmaceutical industry.
Keywords: Grazoprevir, Elbasvir, Ultra performance liquid chromatography, Development, Validation, Forced degradation.
INTRODUCTION
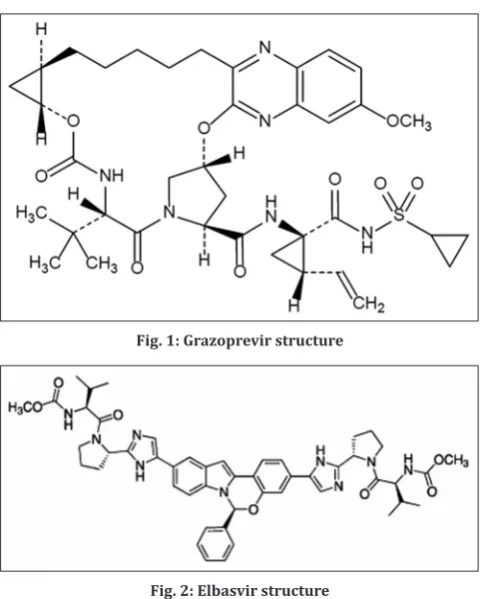
Hepatitis C virus (HCV) is a single-stranded RNA virus that is estimated to affect 130–150 million people worldwide [1]. HCV is a single-stranded RNA virus that is categorized into nine distinct genotypes. HCV infection has been associated with both hepatic and extrahepatic manifestations that increase graft loss and mortality after transplantation [2]. The combination of antiviral drugs grazoprevir (Fig. 1), and elbasvir (Fig. 2), is more effective for the treatment of patients chronically infected with
HCV. Elbasvir/grazoprevir (Zepatier) is a combination product with an
FDA-approved indication for the treatment of chronic HCV genotypes (GTs) 1 and 4 in adults [3].
Grazoprevir chemically known as (1R,18R,20R,24S,27S) -N-{(1R,2S) -1-[(cyclopropylsulfonyl) carbamoyl] -2-vinylcyclopropyl} -7-methoxy- 24-(2-methyl-2-propanyl)-22,25-dioxo-2,21-dioxa-4,11,23,26-tetraazapentacyclo [24.2.1.03,12.05,10.0,18,20] nonacosa-3,5,7,9,11-Benton-27-carboxamide is a direct acting antiviral medication used as a part of combination therapy to treat chronic hepatitis C, an infectious liver disease caused by infection with HCV. It is a protease inhibitor of
HCV NS3/4A that prevents cleavage of the poly protein necessary for
replication [4,5].
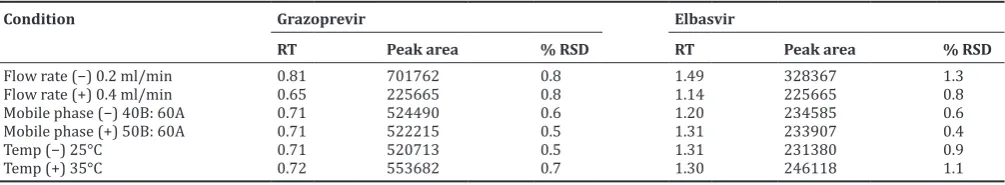
Elbasvir chemically known as dimethyl N,N’-([(6S)-6H-indolo[1,2-c] [1,3]benzoxazine-3,10-diyl]bis{1H-imidazole-5,2-diyl-(2S )-pyrrolidine-2,1-diyl[(2S)-1-oxo-3-methylbutane-1,2-diyl]}) biscarbamate is a NS5A inhibitor, preventing hepatitis C viral RNA replication and virion assembly [6]. Elbasvir is a drug approved by the FDA for the treatment of Hepatitis C.
The literature survey revealed that there are a very few analytical methods [7-10] reported for the determination of elbasvir in single and in combination with grazoprevir. Referable to the deficiency of reported ultra performance liquid chromatography (UPLC) methods describing determination of the mixtures under investigation, it was deemed useful to produce simple, sensitive, and selective reverse-phase UPLC (RP-UPLC) method that could be useful for the simultaneous determination of grazoprevir and elbasvir. The suggested method was designed to be suitable for the quality assessment of these mixes in a tablet dosage form. The proposed method was validated as per the guidelines suggested by ICH [11].
METHODS
Instruments and apparatus
The Acquity waters UPLC system equipped with TUV detector and autosampler integrated with Empower Software was used to perform development and validation of the method. A Acquity HSS C18,
100 mm × 2.1 mm, a column with particle size of 1.8 μm was used as a
stationary phase for chromatographic separation and determination of grazoprevir and elbasvir. Sartorius analytical balance was used for all weighings, Metsar pH meter was used for the pH measurement of buffer solution, and Labman Sonicator was used to dissolve the standard and samples.
Materials
Working standards of grazoprevir and elbasvir were gifted by spectrum
laboratories (Hyderabad, India). Dosage form ZEPATIER tablets purchased from the market. HPLC-grade acetonitrile, methanol, and
© 2018 The Authors. Published by Innovare Academic Sciences Pvt Ltd. This is an open access article under the CC BY license (http://creativecommons. org/licenses/by/4. 0/) DOI: http://dx.doi.org/10.22159/ajpcr.2018.v11i4.21721
orthophosphoric acid (OPA) purchased from Merck Ltd, Mumbai, India,
were used in the study.
Preparation of solutions
Preparation of standard stock solutions
Accurately weighed 10 mg of grazoprevir and 5 mg of elbasvir transferred to 10 ml of volumetric flasks separately. 8 ml of diluent was added to both of these flasks and sonicated for 10 min. Flasks were made up with diluents and labeled as standard stock solution 1 and
2 (1000 µg/ml of grazoprevir and 500 µg/ml of elbasvir).
Preparation of standard working solution (100% solutions) About 1 ml of each stock solution was pipetted out and taken into a
10 ml volumetric flask and made up with diluents (100 µg/ml of grazoprevir and 50 µg/ml of elbasvir).
Preparation of marketing sample stock solution
A total of 10 tablets were weighed and the average weight of each tablet was calculated, then, the weight equivalent to one tablet was transferred into a 10 ml volumetric flask, 8 ml of diluent was added and sonicated for 25 min, further, the volume was made up with
diluent and filtered by UPLC filters (1000 µg/ml of grazoprevir and 500 μg/ml of elbasvir).
Preparation of sample working solution (100 % solution) About 1 ml of filtered sample stock solution was transferred to 10 ml
volumetric flask and made up with diluent (100 µg/ml of grazoprevir and 50 μg/ml of elbasvir).
Buffer preparation (0.1%OPA)
About 1 ml of OPA solution taken in a 1000 ml of volumetric flask, add
about 100 ml of Milli-Q water, and final volume makes up to 1000 ml with mill-Q water. Buffer pH adjusted to 2.8 with triethylamine.
Diluent
Based on the solubility of the drugs, diluent was selected, acetonitrile and water taken in the ratio of 50:50.
Method development
Chromatography
Chromatographic analysis was performed on Acquity UPLC HSS C18 (2.1 mm × 100 mm, 1.8 micron). The mobile phase consists of
0.1% OPA (pH 2.8) buffer:acetonitrile (45:55 v/v) was used throughout
the analysis. The flow rate was 0.3 ml/min, the injection volume was 1.0 μl, column temperature was 30°C, run time 3 min, and detection was
performed at 254 nm using a TUV detector.
Calibration curve of grazoprevir
Aliquots of working standard solution (100 μg/ml) of grazoprevir (0.25,
0.5, 0.75, 1, 1.25, and 1.5 ml) were transferred into a series of 10 ml volumetric flasks and volume was adjusted to the mark with diluents
to get concentrations 25, 50, 75, 100, 125, and 150 μg/ml. Solutions
were injected into the system with stated chromatographic conditions. The graph of area of peak obtained versus respective concentration was plotted. The mean area and its standard deviation were calculated.
Calibration curve of elbasvir
Aliquots of working standard solution (50 μg/ml) of elbasvir (0.25,
0.5, 0.75, 1, 1.25, and 1.5 ml) were transferred into a series of 10 ml volumetric flasks and volume was adjusted to the mark with diluent
to get concentrations 12.5, 25, 37.5, 50, 62.5, and 75 μg/ml. Solutions
were injected into the system with stated chromatographic conditions. The graph of area of peak obtained versus respective concentration was plotted. The mean area and its standard deviation were calculated.
Method validation
System suitability parameters
The system suitability parameters were determined by preparing
standard solutions of grazoprevir (100 μg/ml) and elbasvir (50 μg/ml),
and the solutions were injected 6 times and the parameters such as peak tailing, resolution, and USP plate count were determined.
Linearity
Linearity was demonstrated from 25% to 150% of standard concentration using minimum six calibration levels (25%, 50%, 75%, 100%, 125%, and 150%) for both the title drugs. The method of linear regression was used for data evaluation.
Accuracy
The accuracy of an analytical method expresses the nearness between the reference value and found value. The accuracy of the method was measured in triplicate at three concentration levels, i.e., 50%, 100%, and 150% of standard solutions of grazoprevir and elbasvir [12-14].
Limit of detection (LOD) and limit of quantitation (LOQ)
Increasingly, dilute solution of each drug was injected into the chromatograph and signal-to-noise (S/N) ratio was calculated at each
concentration. The LOD and LOQ were calculated on the basis of signal-to-noise ratio of 3:1 and 10:1, respectively.
Robustness
Robustness of the method was determined to ensure its capacity to remain unaffected by small deliberate variation in the method parameters such as a mobile phase ratio, temperature of the column, and flow rate of the mobile phase [15,16].
Forced degradation studies
A thorough verification of method selectivity was carried out by forcing degradation studies, also known as stress testing. They are performed to determine possible degradation products and confirm the ability of the developed method to detect and separate impurities, which can possibly arise during the lifetime of an API or drug product. Stress tests are conducted in conditions exceeding those used in accelerated stability testing. Stress studies were performed under conditions of dry heat (thermal studies), hydrolysis (in the presence of acidic, alkaline, and water), oxidation, and photolysis. A minimum of four samples was generated for every stress condition, the blank solution
Fig. 1: Grazoprevir structure
stored under normal conditions. 100% sample solution subjected to stress treatment. Hydrolytic decomposition of grazoprevir and elbasvir
was conducted at 30°C in 2 N HCl, water, and 2 N NaOH. For oxidative
stress studies, sample was dissolved in 20% H2O2 and kept for 1 day at room temperature. A photolytic study, drug solution was exposed to ultraviolet light for 1 day [17].
RESULTS
System suitability
The column efficiency, resolution, and peak symmetry were calculated for the standard solutions. The retention time of grazoprevir and elbasvir was found to be 0.72 and 1.28 min, respectively. The peaks obtained for grazoprevir and elbasvir were sharp and have clear baseline separation (Fig. 3). It was observed from the results that the system suitability parameters meet the requirement of method validation. System suitability and method validation results are summarized in Table 1.
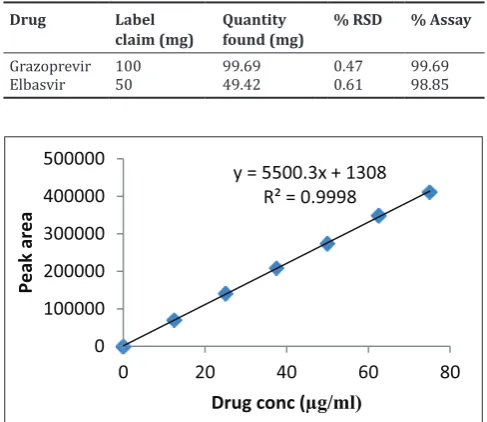
Linearity
The calibration curves plotted for grazoprevir and elbasvir were
linear over the concentration range of 25–150 µg/ml for grazoprevir, 12.5–75 µg/ml for elbasvir. Peak areas were plotted against
concentrations and linear regression analysis performed for the resultant curve (Figs. 4 and 5). The correlation coefficient values of grazoprevir and elbasvir are 0.999 and 0.999, thus indicating excellent correlation between peak areas and concentrations of the analyte. The results are summarized in Table 2.
Precision
The precision of an analytical method gives information on the random error. It expresses of agreement between a series of measurements obtained from multiple sampling of the same homogeneous sample under prescribed conditions. The proposed method was evaluated by studying the precision as percentage relative standard deviation (% RSD). The % RSD was found to be less than 2 for all the drugs, which indicate that the method is precise. Data on the relative retention times obtained in a series of four consecutive injections also showed acceptable repeatability when analyzed not only on the same day but also on the 2nd day. This is confirming good precision of the method.
Table 1: Results from system suitability studies and validation
Parameter Grazoprevir Elbasvir
Theoretical plates 4589 9546
K prime (retention factor) 6.28 11.93
Tailing factor 1.86 1.55
Linearity (r2) 0.999 0.999
% RSD for accuracy 0.88** 0.92**
% RSD for repeatability and intraday
precision 0.9* and 0.8* 0.9* and 0.7*
LOD 0.20 µg/ml 0.13 µg/ml
LOQ 0.62 g/ml 0.39 µg/ml
*Results are mean of six injections. **Results are mean of three injections,
LOD: Limit of detection, LOQ: Limit of quantitation
Table 2: Linearity data for grazoprevir and elbasvir
% Level (approx) Grazoprevir Elbasvir
Concentration (μg/ml) Peak area Concentration (μg/ml) Peak area
25 25 172958 12.5 69748
50 50 308953 25 140597
75 75 456108 37.5 208627
100 100 592958 50 274082
125 125 728638 62.5 348669
150 150 878708 75 411259
Slope 5759.3 5500.3
Intercept 16387 1308
Table 3: Robustness data for grazoprevir and elbasvir
Condition Grazoprevir Elbasvir
RT Peak area % RSD RT Peak area % RSD
Flow rate (−) 0.2 ml/min 0.81 701762 0.8 1.49 328367 1.3
Flow rate (+) 0.4 ml/min 0.65 225665 0.8 1.14 225665 0.8
Mobile phase (−) 40B: 60A 0.71 524490 0.6 1.20 234585 0.6
Mobile phase (+) 50B: 60A 0.71 522215 0.5 1.31 233907 0.4
Temp (−) 25°C 0.71 520713 0.5 1.31 231380 0.9
Temp (+) 35°C 0.72 553682 0.7 1.30 246118 1.1
Fig. 3: Ultra performance liquid chromatography chromatogram of standard
y = 5759.3x + 16387 R² = 0.999
0 200000 400000 600000 800000 1000000
0 50 100 150 200
Peak area
Drug conc(µg/ml)
Accuracy
The accuracy of the proposed method was determined by analyzing grazoprevir and elbasvir samples spiked at three different concentration levels in triplicate. To find out the accuracy, a known amount of standard drug was added to the fixed amount of preanalyzed sample solution at three different concentration levels in triplicate. Percent recovery of the drugs was calculated by comparing the area before and after the addition of the standard drug. Percent recovery of grazoprevir ranged from 98.15% to 100.88% and for elbasvir 98.36–101.03% showing better accuracy of the method.
LOD and LOQ
The LOD for grazoprevir and elbasvir was found to be 0.20 μg/ml and 0.13 μg/ml, respectively (Fig. 6). The LOQ for grazoprevir and elbasvir was found to be 0.62 μg/ml and 0.39 μg/ml, respectively (Fig. 7).
Robustness
No significant effect was observed on system suitability parameters such as theoretical plates, purity angle, and purity threshold when small but deliberate changes were made for chromatography conditions such as change in flow rate (±5%), temperature (±5%), and organic content (±2%). The results are summarized in Table 3.
Forced degradation studies
The specificity of the method was also evaluated by the forced degradation study. The peak purity angle is smaller than that of peak threshold angle means there was no interface with the analyte peak from degradation products. Major degradation occurred for grazoprevir and elbasvir under acid hydrolysis condition up to 5% and 4.81%, respectively. The results are summarized in Table.4.
Assay
The validated method was applied for the determination of grazoprevir
and elbasvir in commercially available ZEPATIER tablets. The results of the assay (n=3) undertaken yielded 99.69% (% RSD = 0.47) of grazoprevir and 98.85% (% RSD = 0.61) of elbasvir. The data are given in Table 5.
DISCUSSION
The present study was aimed at developing a precise, sensitive, rapid, and accurate UPLC method for the analysis of grazoprevir and elbasvir in bulk drug and in pharmaceutical dosage form. Developing a UPLC method was to reduce the run time of the method and solvent consumption for routine analysis such as assay, dissolution, and content uniformity during quality assurance. The author developed stability indicating RP-UPLC method and validated for simultaneous estimation of grazoprevir and elbasvir in bulk and tablet dosage form using Acquity UPLC HSS C18 (100 × 2.1 mm, 1.8 mm). The mobile
phase consists of 0.1% OPA buffer: Acetonitrile (45:55 v/v) was used throughout the analysis. The flow rate was 0.3 ml/min, the injection volume was 1.0 μl, column temperature was 30°C, run time 3 min, and
detection was performed at 254 nm using a TUV detector. The retention time of grazoprevir and elbasvir was found to be 0.73 and 1.29 min, respectively. The linearity was found satisfactory in the range of
25–150 µg/ml and 12.5–75 µg/ml for grazoprevir and elbasvir showed
good correlation coefficient values 0.999 and 0.999, respectively. Less % RSD values showed the good precision and accuracy of the method.
y = 5500.3x + 1308
R² = 0.9998
0
100000
200000
300000
400000
500000
0
20
40
60
80
Peak area
Drug conc (
µg/ml)
Fig. 5: Linearity curve for elbasvir Table 4: Degradation data of grazoprevir and elbasvir
Type of degradation Grazoprevir Elbasvir
Area % Recovered % Degraded Area % Recovered % Degraded
Acid 566244 95.00 5.00 262482 95.19 4.81
Base 580458 97.38 2.62 267861 97.14 2.86
Peroxide 586306 98.36 1.64 271028 98.29 1.71
Thermal 590308 99.03 0.97 274131 99.42 0.58
UV 591869 99.29 0.71 273416 99.16 0.84
Water 592662 99.43 0.57 273398 99.15 0.85
Table 5: Assay of formulation
Drug Label
claim (mg) Quantity found (mg) % RSD % Assay
Grazoprevir 100 99.69 0.47 99.69
Elbasvir 50 49.42 0.61 98.85
Fig. 6: Ultra performance liquid chromatography chromatogram for limit of detection of grazoprevir and elbasvir
The results obtained by the forced degradation studies were good enough to say that developed method was stable. The comparison of the developed method with published methods shows the developed method is new simple, rapid, robust, and economical method.
CONCLUSION
A rapid and robust method for the analysis of grazoprevir and elbasvir was developed and its applicability as a method for analyzing stability was checked. The method was found to be specific, accurate, precise, and reproducible. Force degradation studies confirmed its ability to determine stability because no interference from degradation products was observed. Moreover, no influence from excipients was found, allowing it to be used in the final drug product analysis. The method was also validated in accordance with ICH requirements.
CONFLICTS OF INTERESTS
All authors declare no conflicts of interests.
FINANCIAL SUPPORT AND SPONSORSHIP
Nil.
REFERENCES
1. WHO Fact Sheet, 2016. Available from: http://www.who.int/ mediacentre/Factsheets/fs164/en. [Last accessed on 2017 Jul 15]. 2. Baid-Agrawal S, Pascual M, Moradpour D, Somasundaram R,
Muche M. Hepatitis C virus infection and kidney transplantation in 2014: What’s new? Am J Transplant 2014;14:2206-20.
3. Zepatier (Elbasvir and Grazoprevir).Tablets for Oral Use. Whitehouse
Station, NJ, USA: Merck & Co.; 2016.
4. Papudesu C, Kottilil S, Bagch S. Elbasvir/grazoprevir for treatment of chronic hepatitis C virus infection. Hepatol Int 2017;11:152-60. 5. Polamreddy P, Vishwakarma V, Gundla R. A review on anti-HCV
agents targeting active site and allosteric sites of non-structural protein 5b [NS5B]. Int J Pharm Pharm Sci 2016;8:1-18.
6. Bell AM, Wagner JL, Barber KE. Elbasvir/grazoprevir: A review of the latest agent in the fight against hepatitis C. Int J Hepatol 2016;2016:1-7.
7. Liua H, Xua H, Song W. Validated UPLC/MS/MS assay for quantitative bioanalysis of elbasvir in rat plasma and application to pharmacokinetic study. J Chromatogr B 2016;1015:150-6.
8. Potluri H, Battula SR, Yeturu S. Picogram level quantification of grazoprevir and elbasvir with deuterated internal standards in human plasma samples by LC–ESI-MS/MS. Indian J Pharm Educ Res 2016;50:612-9.
9. Akram N, Umamahesh M, Ramachari T. A new validated RP-HPLC method for the determination of elbasvir and grazoprevir in its bulk and pharmaceutical dosage forms. Int J Chem Pharm Anal 2017;4:1-11. 10. Vancha AR, Naresh D, Sowjanya1 P, Kumar GV. Analytical method
development and validation for elbasvir and grazoprevir in combine pharmaceutical dosage forms by RP-HPLC. Int J Res Dev Pharm Life
Sci2016;4:94-101.
11. International Conference on Harmonization. ICH Q2 (R1) Guideline on Validation of Analytical Procedures: Text and Methodology Yokohama, Japan; 2005.
12. Ponnuri RN, Pragallapati P, Mastanamma SK, Ravindra N, Mandava VB. Development and validation of a stability indicating reverse phase high performance liquid chromatography method for simultaneous determination of clindamycin, metronidazole, and clotrimazole in pharmaceutical combined dosage forms. Asian J Pharm Clin Res 2017;10:111-7.
13. Reddy GN, Prasad VV, Maharana PK. Development and validation of a stability indicating UPLC method for determination of erlotinib in pharmaceutical formulations. Pharm Chem 2012;4:2288-97.
14. Sunnis MC, Rajput AP. Development and validation of a new stability indicating analytical method for the determination of related components of brimonidine tartrate in drug substances and drug product
using apples.Int J Pharm Pharm Sci 2011;3:145-50.
15. Balan P, Kannappan N. Development and validation of stability-indicating RP-UPLC method for simultaneous estimation of thiocolchicoside and aceclofenac in combined dosage form. Int Curr Pharm J 2014;3:296-300.
16. Yanamandra R, Vadla CS, Puppala UM, Patro B. Development and validation of a rapid RPUPLC method for the simultaneous estimation of bambuterol hydrochloride and montelukast sodium from tablets. Indian J Pharm Sci 2012;74:116-21.