DOI: 10.1534/genetics.103.025361
Heterogeneous Patterns of Variation Among Multiple Human X-Linked Loci:
The Possible Role of Diversity-Reducing Selection in Non-Africans
Michael F. Hammer,*
,†,1Daniel Garrigan,*
,†Elizabeth Wood,*
,†Jason A. Wilder,*
,†Zahra Mobasher,* Abigail Bigham,* James G. Krenz
†and Michael W. Nachman
†*Genomic Analysis and Technology Core, Division of Biotechnology, University of Arizona, Tucson, Arizona 85721 and†Department of Ecology and Evolutionary Biology, University of Arizona, Tucson, Arizona 85721
Manuscript received December 5, 2003 Accepted for publication April 13, 2004
ABSTRACT
Studies of human DNA sequence polymorphism reveal a range of diversity patterns throughout the genome. This variation among loci may be due to natural selection, demographic influences, and/or different sampling strategies. Here we build on a continuing study of noncoding regions on the X chromosome in a panel of 41 globally sampled humans representing African and non-African populations by examining patterns of DNA sequence variation at four loci (APXL, AMELX,TNFSF5, andRRM2P4) and comparing these patterns with those previously reported at six loci in the same panel of 41 individuals. We also include comparisons with patterns of noncoding variation seen at five additional X-linked loci that were sequenced in similar global panels. We find that, while almost all loci show a reduction in non-African diversity, the magnitude of the reduction varies substantially across loci. The large observed variance in non-African levels of diversity results in the rejection of a neutral model of molecular evolution with a multi-locus HKA test under both a constant size and a bottleneck model. In non-Africans, some loci harbor an excess of rare mutations over neutral equilibrium predictions, while other loci show no such deviation in the distribution of mutation frequencies. We also observe a positive relationship between recombination rate and frequency spectra in our non-African, but not in our African, sample. These results indicate that a simple out-of-Africa bottleneck model is not sufficient to explain the observed patterns of sequence variation and that diversity-reducing selection acting at a subset of loci and/or a more complex neutral model must be invoked.
P
ATTERNS of variation at multiple loci can be used tion), while demographic processes tend to affect all to infer the history of human migration patterns, loci in the genome similarly.subdivision, and changes in population size. These pat- Considerable work over the past decade has docu-terns can also shed light on the relative importance of mented DNA sequence variation in humans. Early stud-different population genetic processes (e.g., mutation, ies focused primarily on mitochondrial DNA (Vigilant
genetic drift, selection, and recombination) and thus et al. 1991) and the Y chromosome (Hammer 1995; provide clues to the mechanisms of evolutionary change Whitfieldet al.1995), while more recent single-locus at the molecular level. A current challenge is to distin- studies have focused on the X chromosome (Nachman
guish the signature of natural selection from those of et al. 1998; Harris and Hey 1999; Kaessmann et al. neutral demographic processes associated with changes 1999;NachmanandCrowell2000;Giladet al.2002; in population size, distribution, and structure. Often Saunderset al. 2002; Yuet al. 2002b) and on the au-selective and demographic processes produce identical tosomes (reviewed inPrzeworskiet al.2000;Excoffier patterns of sequence variation at a given locus. For ex- 2002). Two major features to emerge from this body of ample, an excess of rare mutations over neutral, equilib- work are (1) substantial heterogeneity among genes in rium expectations could be a signature of either recent overall patterns of variation, including differences in directional selection at the locus under investigation or the level of nucleotide diversity, the amount of linkage recent population growth. One approach to distinguish- disequilibrium, and the distribution of allele frequen-ing between selective and neutral demographic effects cies, and (2) clear differences in levels and patterns on genome variability is to sample multiple independent of variation among populations. For example, there is loci: natural selection is expected to affect variation in mounting evidence that African populations have more small regions (i.e., at sites linked to those under selec- genetic variation (Vigilantet al.1991;Tishkoffet al.
1996; Przeworski et al. 2000; Hammer et al. 2001), harbor more rare alleles (WallandPrzeworski2000), 1Corresponding author:Department of Ecology and Evolutionary
Biol-and have lower levels of linkage disequilibrium (Reich
ogy, University of Arizona, Tucson, AZ 85721.
E-mail: [email protected] et al.2001) than non-African populations.
These genetic patterns have led to contrasting infer- ported at DMD(i.e., introns 7 and 44; Nachmanand
Crowell 2000), G6PD and L1CAM (Saunders et al.
ences of human demographic history. Results from loci
with an excess of rare polymorphisms (i.e., with large 2002), andMSNandALAS2(Nachmanet al.2004). We also include comparisons with patterns of noncoding negative Tajima’s D values; Tajima 1989) have been
used to support models in which humans expanded variation seen at five additional X-linked loci that were sequenced in similar global panels:PDHA1(Harrisand dramatically from small initial size (Harpending and
Rogers 2000;Shen et al.2000;WoodingandRogers Hey1999),Xq13.3(Kaessmannet al.1999),FIX(Harris
andHey 2001),MAO-A(Giladet al.2002), and Xq21.3
2000; Alonso and Armour 2001; Rogers 2001). On
the other hand, many nuclear loci have positive Tajima’s (Yuet al.2002b). Because we studied X-linked loci only, we were able to avoid some of the complications that
Dvalues so they do not provide evidence of population
growth (Harding et al. 1997;Hey 1997;Zietkiewicz arise when comparing loci with different modes of in-heritance and effective population sizes, such as those
et al.1997;Przeworskiet al.2000). Using data from the
12 nuclear loci then available,WallandPrzeworski associated with the Y chromosome, autosomes, or the mitochondrial genome (FayandWu1999;Przeworski
(2000) tested several simple models of population
growth and found that the different patterns among et al.2000;Hellmannet al.2003). Our results indicate that, despite a common sampling strategy, there is still loci were not compatible with any of their models. This
led to the suggestion that various forms of selection substantial heterogeneity in patterns of variation among loci on the human X chromosome. This degree of heter-have influenced a subset of loci (WallandPrzeworski
2000; Excoffier2002). It is also becoming clear that ogeneity does not appear to be compatible with a simple demographic model and may reflect the effects of recent more complex models of human demography must be
considered, such as those incorporating geographic diversity-reducing selection acting on a subset of loci. structure and changes in population size (Pluzhnikov
et al.2002;PtakandPrzeworski2002).
SUBJECTS AND METHODS One of the major challenges for interpreting the
con-trasting patterns observed among human loci comes Subjects:Human genomic DNAs were isolated from lympho-from the sampling strategies used by different investiga- blastoid cell lines that were established by the Y Chromosome Consortium (2002) at the New York Blood Center from blood tors. Studies of nuclear sequence variation vary greatly
donated by volunteers who gave informed consent. All sam-with regard to the scheme for sampling populations
pling protocols were according to procedures approved by (from population-based to global “grid” sampling), the
the New York Blood Center and University of Arizona Human type of genomic regions studied (from coding to non- Subjects Committees. A total of 41 men were sampled, includ-coding), and the molecular methods of variation detec- ing 10 Africans (2 Tsumkwe San from Namibia, 1 West Bantu Herero, and 1 East Bantu Pedi, 1 East Bantu Sotho, 2 Biaka tion employed (Przeworski et al. 2000; Ptak and
Pygmies from CAR, and 3 Mbuti Pygmies from Zaire), 11
Przeworski2002). This diverse array of strategies has
Asians (3 Han Chinese, 2 Siberian Yakuts, 1 Cambodian, 3 made it difficult to compare results across studies.
Re-Japanese, and 1 Pakistani, and 1 Nasioi from Melanesia), 10 cently, several surveys have sampled DNA sequences Europeans/Middle Easterners (2 Ashkenazi Jews, 1 British, 1 from multiple loci in a common set of individuals Adygean from Krasnodar, 3 Germans, 2 Western Russians, and 1 Turk), and 10 Native Americans (1 Navajo, 1 Tohono (Frisseet al.2001;HarrisandHey2001;Stephenset
O’Odham, 1 Poarch Creek, 2 Karitianans, and 2 Surui from
al.2001;Yuet al.2002a,b;Carlsonet al.2003). These
Brazil, 1 Mayan, and 2 Amerindians of unknown tribal affilia-studies have typically focused on multiple autosomal
tion). This sample was chosen as part of a long-term project loci from either noncoding regions exclusively (Frisse in our labs to survey nucleotide variability at a number of loci et al.2001) or regions encompassing exons (Stephens throughout the genome using a common set of individuals
(Nachmanet al.1998, 2004;NachmanandCrowell 2000;
et al.2001). Studies of the X chromosome have typically
Saunders et al.2002). A single male common chimpanzee focused on coding regions and/or only a few loci (
Har-(Pan troglodytes) was surveyed from DNAs provided by O.
Ry-risandHey1999, 2001;Stephenset al.2001;Kitano
der. By sequencing X chromosomes in males we were able
et al.2003). These studies also vary in the way humans to avoid problems associated with sequencing and scoring are sampled, ranging from panels of individuals from heterozygous sites and we were also able to recover haplotypes
directly among all sites in the sample. the United States (Stephenset al.2001), to panels
con-Choice of loci:We chose to sequenceAPXL(apical protein-taining many globally dispersed samples (Harris and
likeXenopus laevis),AMELX(amelogenin, X-linked),RRM2P4 Hey 1999, 2001), to panels with multiple individuals
(ribonucleotide reductase M2 polypeptide pseudogene 4), from a limited number of human populations (Frisse andTNFSF5(tumor necrosis factor ligand superfamily,
mem-et al.2001). ber 5) because they map to telomeric regions with moderate
to high rates of recombination. These loci complement our Here we build on a continuing study of noncoding
existing database of six other genes (sequenced in the same regions on the X chromosome (Figure 1) in a panel of
global panel) mapping to X chromosome regions with a range 41 globally sampled humans representing African and
re-Figure 1.—Recombination rates and the genomic regions compared in this study. (Top) Recombination rates (centi-morgans per megabase) as esti-mated fromKonget al. (2002; see subjects and methods) for 15 loci in Table 2. (Middle) Schematic of the human X chromosome and approximate genomic positions of loci (four regions sequenced in this study are in boldface type). (Bottom) Schematic of three genes. Ex-ons are marked by solid boxes and regions sequenced are in-dicated by shaded boxes.
With the exception ofG6PDin Africa (Saunderset al.2002), Sequencher (GeneCodes). Sequences have been submitted to GenBank under accession nos. AY694820–AY694987. none of these loci wasa prioribelieved to be influenced by
selective forces. In addition, five published X chromosome Data analysis:Nucleotide diversity, (Nei and Li1979), Watterson’s (1975) estimator of, andFST(Hudsonet al. DNA sequence data sets were used for comparisons with the
10 loci examined in our global panel. These loci included 1992) were calculated using the program DNAsp 3.99 (Rozas and Rozas 1999), excluding insertion-deletion polymor-PDHA1(HarrisandHey1999),FIX(HarrisandHey2001),
Xq13.3 (Kaessmannet al.1999; referred to here asP2Y10), phisms. Under neutral equilibrium conditions bothand estimate the neutral parameter 3Nefor X-linked loci, where Xq21.1 (Yuet al.2002b; referred to here asDACH2), andMAO-A
(Giladet al.2002). We did not includeZFX(Jaruzelskaet Neis the effective population size andis the neutral mutation rate. To test for deviations from a neutral equilibrium fre-al. 1999) or DYS44 (Zietkiewicz et al. 1997) because the
polymorphism data were ascertained mainly by single-strand quency distribution, Tajima’s D(Tajima1989), Fu and Li’s Dwith an outgroup (FuandLi1993), and Fay and Wu’sH conformation polymorphism rather than by DNA sequencing.
PCR amplification and sequencing:DNA was PCR amplified (Fay andWu 2000) were also calculated using DNAsp 3.99 (Pvalues were determined by 1000 replicates of Monte Carlo in 25-l volumes with 40 cycles. Conditions for each of the
fragments described below varied slightly and are available simulation of the coalescent process under a neutral panmictic model with no recombination). Ratios of polymorphism to from the authors upon request. Amplification primers were
designed from published sequences forAPXL(AC002365), divergence were compared with the expectations under a neutral model using a multilocus Hudson-Kreitman-Aguade´ (HKA) test AMELX(AY040206),RRM2P4(NG_000871; HSJ169P22), and
TNFSF5(NT_011786) and are available upon request. Internal (Hudsonet al.1987) with the software “HKA” ( J. Hey; http:// lifesci.rutgers.edu/heylab/). This program does not take ac-primers (also available upon request) were used to generate
overlapping sequence runs on an ABI3730 automated se- count of intragenic recombination and therefore the resulting Pvalues are slightly inflated (Frisseet al.2001). Divergence quencer. Contiguous sequence that included coding and
non-coding regions (4885, 5331, 5240, and 2385 bp for APXL, data were derived for each of these loci by estimating the net divergence (DA; Nei 1987) between homologous sequences AMELX, TNFSF5, and RRM2P4, respectively) was assembled
to most recent common ancestors (TMRCAs) among sampled from five additional X-linked loci surveyed in global sequences were estimated by dividing Watterson’s estimator of samples in Table 2. Average global levels of variation at 3Ne(Watterson1975) by the locus-specific rates of neutral
these five loci (average ⫽0.00076 and ⫽0.00068) mutation, estimated from the interspecific divergence. We
are very similar to the 10 others in Table 2 (Mann-assumed a human-chimpanzee divergence of 6 million years
and a 20-year human generation time. Female estimated re- Whitney test,P⫽0.668 and 0.951, respectively), as are combination rates were taken from the University of Califor- summaries of the frequency spectra (average TD ⫽ nia, Santa Cruz, web site (http://www.genome.ucsc.edu) using ⫺0.552, FLD⫽ ⫺1.401; Mann-Whitney test,P⫽0.582 the July 2003 freeze of the Human Genome Project Working
and 0.951, respectively). Heterogeneity among loci is Draft. The recombination rates represent average rates for
also apparent: levels of variation at FIX, MAO-A, and a window of 1 Mb around each locus estimated through a
comparison of the sequence of the human X chromosome P2Y10 are low, while those atDACH2 andPDHA1 are with the deCODE Genetics map (Konget al.2002), which is average and high, respectively.P2Y10,FIX, andDACH2 based on 5136 microsatellite markers in 146 families with a show an excess of rare and/or singleton polymorphisms total of 1257 meioses.
(Table 2). In contrast,PDHA1andMAO-Ahave positive TD values. As expected given the variation in levels of polymorphism, estimates of the TMRCA also vary consid-RESULTS
erably among all 15 loci in Table 2. For example, the
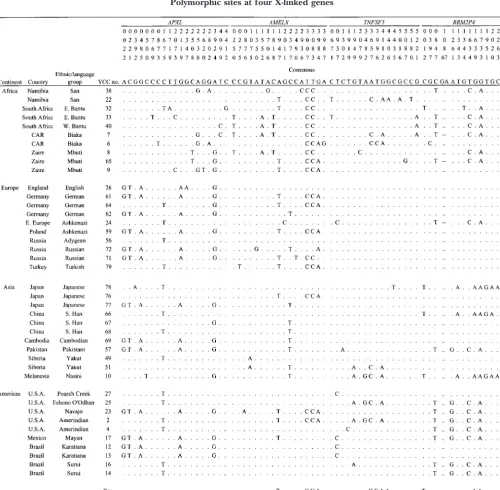
Patterns of variation at four telomeric loci:Polymor- TMRCA for FIX and MAO-A is ⬍500 KY, while 6 loci
phic sites within theAPXL,AMELX, andTNFSF5introns, have TMRCAs⬎1 MY.
as well as in the RRM2P4 pseudogene, are shown in Kitanoet al.(2003) recently surveyed sequence varia-Table 1. Numbers of segregating sites, nucleotide diver- tion at 10 X-linked genes that contain mutations known sity, measures of the frequency distribution, levels of to cause mental retardation. Global patterns of intron divergence, TMRCA, andFSTvalues are summarized in variability within these genes are similar to those re-Table 2. The number of segregating sites ranges from ported in Table 2, although the average global level of 13 to 19 for the four loci. The average nucleotide diver- diversity at their 10 loci ( ⫽0.00051 and ⫽0.00035) sity for the three gene regions (consisting mainly of isⵑ40% lower than that for the 15 loci in Table 2 ( ⫽ introns) is slightly lower than that in the pseudogene 0.00081 and ⫽ 0.00061). Their sequences also had (Table 2). The average level of Homo-Pan divergence anⵑ30% reduction in human-chimpanzee divergence is also lower at two of the three genes compared with (0.699%) relative to the 15 X-linked loci in Table 2 the pseudogene (Table 2). A four-locus HKA test does (1.01%) and a lower mean TMRCA (474vs. 1004 KY, not reject the null model (P⫽0.64). Tajima’sD(TD) respectively), possibly reflecting higher levels of selec-and Fu selec-and Li’sD(FLD) values are negative for all three tive constraint on loci involved in human cognitive func-gene regions; however, none is statistically significant. tion (Kitanoet al.2003).
RRM2P4 is the only locus with a positive FLD value Nucleotide diversity and recombination rate:Global
(⫹0.55) indicating a low proportion of singletons. Inter- nucleotide diversity () and recombination rate for the estingly,TNFSF5has an excess of high-frequency-derived 10 loci sampled in theN⫽41 panel are positively corre-polymorphisms as reflected in the statistically significant lated (Pearson linear correlation, two-tailedt-test,R2⫽ negative H value (Table 2). 0.648, P ⫽ 0.005). When all 15 loci in Table 2 are
Global patterns of variation at 10 X-linked loci sam- considered, there is still a positive but weaker
correla-pled in the same individuals:Global nucleotide diversity tion (R2⫽0.315,P⫽0.029; Figure 2A). This increased
levels exhibit a large range of values—from a high value scatter in the larger sample may reflect variation in levels of 0.00143 atDMD44to a low value of 0.00035 atALAS2 of diversity that is attributable to different sampling (Table 2). However, a single 10-locus HKA test does strategies. Similarly, inDrosophila melanogaster, the corre-not reject the null model of equal rates of molecular lation between diversity and recombination rate ob-evolution (P⫽0.53; data not shown). Interestingly, all served in heterogeneous samples (BegunandAquadro
10 loci surveyed in our global panel have negative TD 1992) is stronger when studied from multiple loci in a values. The mean global TD and FLD values for these single sample (Aquadroet al.1994). When we consider 10 loci are⫺0.759 and⫺1.135, respectively. The average the relationship of human-chimpanzee divergence lev-negative value of TD and FLD does not reveal the great els to human recombination rates, there is no statisti-extent to which frequency spectra vary among loci. Two cally significant relationship for either the set of 10 or loci have TD and FLD values close to zero (DMD44and the set of 15 loci in Table 2 (R2 ⫽ 0.073, P ⫽ 0.449; RRM2P4), while three loci (ALAS2,DMD7, andL1CAM) R2⫽0.082,P⫽0.303, respectively), which may reflect have statistically significant negative TD values. There is the small number of loci investigated (Figure 2B). an excess over neutral expectations of singleton polymor- African and non-African levels of diversity: Table 3 phisms at 2 of these 10 loci:DMD7andL1CAMas indicated summarizes the numbers of segregating sites, nucleo-by the significantly negative FLD values (Table 2). tide diversity, measures of the frequency distribution,
Comparisons with patterns of variation at other X-linked and TMRCAs within African and non-African samples.
loci:Summary statistics for the 10 loci sampled in the Consistent with many other studies (e.g.,Yuet al.2002a),
TABLE 1
Polymorphic sites at four X-linked genes
Polymorphisms atAPXL,AMELX,TNFSF5, andRRM2P4among 41 humans. The consensus sequence is shown at the top, and the chimpanzee sequence is shown at the bottom.
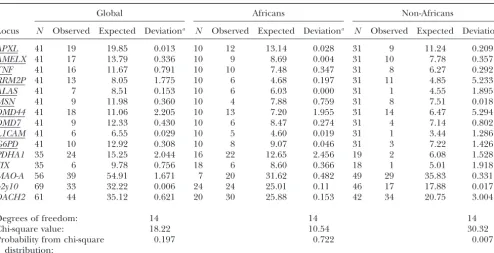
nucleotide diversity in non-Africans relative to Africans. on the entire global sample, as well as on Africans and non-Africans separately (Table 4). We found that the Two loci,RRM2P4andMSN, show the opposite pattern
(Table 3). Mean levels of nucleotide diversity are almost null model was rejected in non-Africans only (P ⫽
0.007). When we repeated the HKA tests using only the twice as high in Africans ( ⫽0.00082⫾ 0.00040, ⫽
0.00076⫾0.00049) as in non-Africans ( ⫽0.00045⫾ 10 loci sequenced in the panel of 41 individuals, similar results obtained (P⫽ 0.030; data not shown). We also 0.00036, ⫽ 0.00040 ⫾ 0.00042). These differences
are statistically significant (Mann-Whitney test, P ⫽ note that the correlation between recombination rate and nucleotide diversity was stronger in non-Africans 0.002 and 0.004, respectively).
To test for relationships between polymorphism and (R2⫽0.521,P⫽0.019) compared with Africans (R2⫽ 0.308,P ⫽0.096; data not shown).
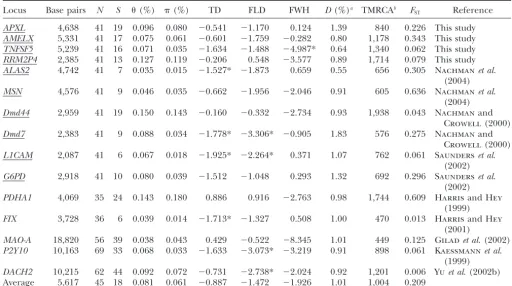
TABLE 2
Summary statistics for 15 X-linked loci in worldwide samples
Locus Base pairs N S (%) (%) TD FLD FWH D(%)a TMRCAb FST Reference
APXL 4,638 41 19 0.096 0.080 ⫺0.541 ⫺1.170 0.124 1.39 840 0.226 This study AMELX 5,331 41 17 0.075 0.061 ⫺0.601 ⫺1.759 ⫺0.282 0.80 1,178 0.343 This study TNFSF5 5,239 41 16 0.071 0.035 ⫺1.634 ⫺1.488 ⫺4.987* 0.64 1,340 0.062 This study RRM2P4 2,385 41 13 0.127 0.119 ⫺0.206 0.548 ⫺3.577 0.89 1,714 0.079 This study ALAS2 4,742 41 7 0.035 0.015 ⫺1.527* ⫺1.873 0.659 0.55 656 0.305 Nachmanet al.
(2004) MSN 4,576 41 9 0.046 0.035 ⫺0.662 ⫺1.956 ⫺2.046 0.91 605 0.636 Nachmanet al.
(2004) Dmd44 2,959 41 19 0.150 0.143 ⫺0.160 ⫺0.332 ⫺2.734 0.93 1,938 0.043 Nachmanand
Crowell(2000) Dmd7 2,383 41 9 0.088 0.034 ⫺1.778* ⫺3.306* ⫺0.905 1.83 576 0.275 Nachmanand
Crowell(2000) L1CAM 2,087 41 6 0.067 0.018 ⫺1.925* ⫺2.264* 0.371 1.07 762 0.061 Saunderset al.
(2002) G6PD 2,918 41 10 0.080 0.039 ⫺1.512 ⫺1.048 0.293 1.32 692 0.296 Saunderset al.
(2002) PDHA1 4,069 35 24 0.143 0.180 0.886 0.916 ⫺2.763 0.98 1,744 0.609 HarrisandHey
(1999) FIX 3,728 36 6 0.039 0.014 ⫺1.713* ⫺1.327 0.508 1.00 470 0.013 HarrisandHey
(2001)
MAO-A 18,820 56 39 0.038 0.043 0.429 ⫺0.522 ⫺8.345 1.01 449 0.125 Giladet al.(2002) P2Y10 10,163 69 33 0.068 0.033 ⫺1.633 ⫺3.073* ⫺3.219 0.91 898 0.061 Kaessmannet al.
(1999) DACH2 10,215 62 44 0.092 0.072 ⫺0.731 ⫺2.738* ⫺2.024 0.92 1,201 0.006 Yuet al. (2002b) Average 5,617 45 18 0.081 0.061 ⫺0.887 ⫺1.472 ⫺1.926 1.01 1,004 0.209
Only SNPs were included in all analyses except theHtest where indels were also used. Underlined loci were sequenced in same panel of 41 men. *Two-tailedPⱕ0.025 in Monte Carlo simluation.
aHuman-chimpanzee sequence divergence.
bTMRCA values are based onWatterson’s (1975) estimator of 3Neand are in units of 1000 years (KYA).
African and non-African frequency spectra:When we the result of a larger mean sample size (i.e., 32.3 vs.
12.3), we reanalyzed our non-African data by resampling estimate TD and FLD values separately in African and
non-African samples, both estimators are less negative each locus 100 times and making the sample size equal to the number of Africans sequenced at the locus. In than those in the global panel (see above): mean African
TD and FLD ⫽ ⫺0.401 and ⫺0.552, respectively, and other words, for then ⫽ 41 data set, 10 non-Africans were resampled 100 times. Resampled data sets with no mean non-African TD and FLD⫽ ⫺0.512 and⫺0.846,
respectively. TD and FLD values for all loci are consis- variation (i.e.,S⫽0) were thrown out and an additional resampling was performed. The FIX locus was not re-tent with neutral equilibrium expectations in Africans,
while four loci showed an excess over neutral expecta- sampled because equal numbers of Africans and non-Africans were surveyed initially (HarrisandHey2001). tions of rare polymorphisms and/or singletons in
non-Africans: ALAS2,MSN, DMD7, and L1CAM (Table 3). The mean TD value for the resampled non-African data set was still more negative (TD⫽ ⫺0.639) despite having There is also an excess of high-frequency-derived
poly-morphisms at MSN and DMD7 in non-Africans as re- an identical size as the African sample. This suggests that the more negative TD value in non-Africans compared flected in statistically significant negative Fay and Wu’s
H(FWH) values (Table 3). African TD values ranged with Africans is unrelated to sample size differences. To explore the relationship between frequency spec-from⫺1.72 to 0.80, while those of non-Africans ranged
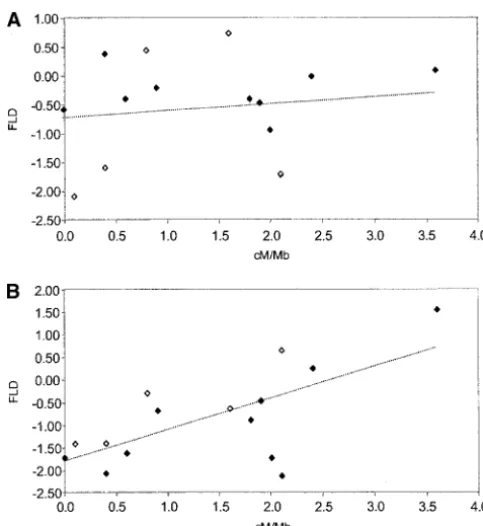
from ⫺2.06 to 0.72. The mean TD for non-Africans tra and recombination rate we plotted African or non-African FLD vs. recombination rate for each locus in (⫺0.512⫾0.906) was slightly more negative than that
of Africans (⫺0.401⫾0.736). Table 3. For Africans there is no relationship either for the set of 10 loci sampled in the same set of 41 individu-Under a model of population growth TD and FD
are negatively correlated with sample size (Ptak and als or for all 15 loci (R2 ⫽0.014,P ⫽0.747 andR2 ⫽ 0.014,P⫽ 0.675, respectively; Figure 3A). In contrast,
Przeworski2002;Hammeret al.2003). To determine
pared patterns at these 10 loci with those from five additional X-linked genes that were sequenced in simi-lar global panels (HarrisandHey1999, 2001; Kaess-mann et al. 1999; Gilad et al. 2002; Yu et al. 2002b). Nucleotide diversity varies by more than an order of magnitude among loci (Table 2):ALAS2,L1CAM, and
FIXexhibit some of the lowest levels of nucleotide diver-sity seen in the human genome, whilePDHA1,DMD44,
RRM2P4 are higher than the autosomal average (Li
andSadler1991;Przeworskiet al.2000). Likewise, the distribution of mutation frequencies differs considerably among loci, with several harboring an excess (over neutral predictions) of low-frequency polymorphisms (e.g.,ALAS2,
DMD7,L1CAM, FIX), and others with an abundance of high-frequency (e.g.,TNFSF5) or intermediate-frequency (e.g.,PDHA1,DMD44,RRM2P4)-derived polymorphisms. Patterns of heterogeneity seen among loci are differ-ent between African and non-African samples. There was a wide range of FST values, with two loci (PDHA1 andMSN) exhibiting some of the highest known levels of differentiation among populations and others with extremely low levels of differentiation (e.g.,DACH2,FIX, andDMD44;Romualdiet al.2002). As previously docu-Figure2.—Relationship between human nucleotide diver- mented for autosomal, Y-linked, and mitochondrial loci sity or human-chimpanzee divergence and recombination
(Vigilantet al.1991;Przeworskiet al.2000;Shenet
rate. (A) Scatterplot of human nucleotide diversity levels (W)
al.2000; Hammeret al. 2003), X-linked loci are more vs.recombination rate for loci in Table 2. Solid diamonds
represent 10 loci sequenced in same panel ofN⫽41 samples variable in sub-Saharan African populations than in (linear regression:R2⫽0.648,P⫽0.005). Open diamonds
non-African populations. However, the extent of the represent 5 additional X-linked loci sequenced in similar reduction in non-African diversity at X-linked loci ap-global panel (see text; linear correlation for 15 loci: R2 ⫽
pears to be greater than that observed on the autosomes. 0.315,P⫽0.029). (B) Scatterplot of human-chimpanzee
diver-For example, the average non-African reduction in gencevs.recombination rate (10-locus linear regression:R2⫽
0.073,P⫽0.449; 15-locus linear regression:R2⫽0.082,P⫽ for the 15 X chromosome loci in Table 3 is 45%, while 0.303). Trend lines are based on the sample of 15 loci. the average non-African reduction in on the auto-somes is 30% (Halushkaet al.1999;Frisseet al.2001;
Stephenset al.2001). We also note that there is substan-data sets (R2⫽0.520,P⫽0.019 andR2⫽0.454, 0.006,
tial variability among X-linked loci in the degree of respectively; Figure 3B). Similar trends were observed with reduction in non-African variation, with some loci hav-TD; however, the non-African correlation was not statis- ing⬍10% of African diversity (e.g.,PDHA1,ALAS2, and tically significant (P⫽ 0.138). Interestingly, there is also L1CAM). Similar disparities in African and non-African a positive relationship between non-African FLD and nu- autosomal levels of diversity have not been reported cleotide variability () for the set of 10 loci sampled in (Przeworski et al. 2000; Alonso and Armour 2001; the same individuals (R2 ⫽ 0.678,P ⫽0.003), while no
Frisse et al. 2001). Mounting evidence suggests that, such relationship was observed for the African FLD values for many loci, African populations contain more rare (R2⫽0.001,P⫽0.936; data not shown). This relationship
alleles than non-African populations (Walland
Prze-is only marginally statPrze-istically significant for the full set of worski2000). We found that our African sample has 15 loci in non-Africans (R2 ⫽0.235,P⫽0.067).
TD values similar (i.e., slightly negative on average) to those reported in the literature for African populations (Przeworski et al. 2000). However, our non-African DISCUSSION
sample exhibits an unusual pattern, whereby the mean TD value is slightly more negative than the mean TD We obtained DNA sequence data from four loci in
regions of high recombination on the X chromosome value in our African sample (⫺0.512 and⫺0.401, re-spectively). The more negative average TD value for and compared patterns of variation at these loci with
those from six additional loci sequenced in the same non-Africans held even after subsampling 10 non-Afri-cans to control for differences in sample sizes between panel of 41 global samples. Despite the fact that all loci
were X-linked and sampled in the same set of individu- Africans and non-Africans. This is driven, in part, by sharply negative TD values atMSNandDMD7and fewer als, we found substantial heterogeneity in levels and
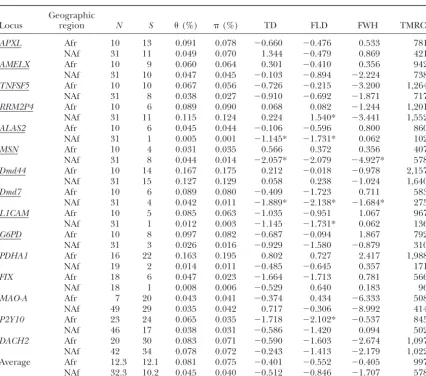
TABLE 3
Patterns of variation in African and non-African individuals
Geographic
Locus region N S (%) (%) TD FLD FWH TMRCAa
APXL Afr 10 13 0.091 0.078 ⫺0.660 ⫺0.476 0.533 781
NAf 31 11 0.049 0.070 1.344 ⫺0.479 0.869 421
AMELX Afr 10 9 0.060 0.064 0.301 ⫺0.410 0.356 942
NAf 31 10 0.047 0.045 ⫺0.103 ⫺0.894 ⫺2.224 738
TNFSF5 Afr 10 10 0.067 0.056 ⫺0.726 ⫺0.215 ⫺3.200 1,264
NAf 31 8 0.038 0.027 ⫺0.910 ⫺0.692 ⫺1.871 717
RRM2P4 Afr 10 6 0.089 0.090 0.068 0.082 ⫺1.244 1,201
NAf 31 11 0.115 0.124 0.224 1.540* ⫺3.441 1,552
ALAS2 Afr 10 6 0.045 0.044 ⫺0.106 ⫺0.596 0.800 860
NAf 31 1 0.005 0.001 ⫺1.145* ⫺1.731* 0.062 102
MSN Afr 10 4 0.031 0.035 0.566 0.372 0.356 407
NAf 31 8 0.044 0.014 ⫺2.057* ⫺2.079 ⫺4.927* 578
Dmd44 Afr 10 14 0.167 0.175 0.212 ⫺0.018 ⫺0.978 2,157
NAf 31 15 0.127 0.129 0.058 0.238 ⫺1.024 1,640
Dmd7 Afr 10 6 0.089 0.080 ⫺0.409 ⫺1.723 0.711 583
NAf 31 4 0.042 0.011 ⫺1.889* ⫺2.138* ⫺1.684* 275
L1CAM Afr 10 5 0.085 0.063 ⫺1.035 ⫺0.951 1.067 967
NAf 31 1 0.012 0.003 ⫺1.145 ⫺1.731* 0.062 136
G6PD Afr 10 8 0.097 0.082 ⫺0.687 ⫺0.094 1.867 792
NAf 31 3 0.026 0.016 ⫺0.929 ⫺1.580 ⫺0.879 310
PDHA1 Afr 16 22 0.163 0.195 0.802 0.727 2.417 1,988
NAf 19 2 0.014 0.011 ⫺0.485 ⫺0.645 0.357 171
FIX Afr 18 6 0.047 0.023 ⫺1.664 ⫺1.713 0.781 566
NAf 18 1 0.008 0.006 ⫺0.529 0.640 0.183 96
MAO-A Afr 7 20 0.043 0.041 ⫺0.374 0.434 ⫺6.333 508
NAf 49 29 0.035 0.042 0.717 ⫺0.306 ⫺8.992 414
P2Y10 Afr 23 24 0.065 0.035 ⫺1.718 ⫺2.102* ⫺0.537 845
NAf 46 17 0.038 0.031 ⫺0.586 ⫺1.420 0.094 502
DACH2 Afr 20 30 0.083 0.071 ⫺0.590 ⫺1.603 ⫺2.674 1,097
NAf 42 34 0.078 0.072 ⫺0.243 ⫺1.413 ⫺2.179 1,022 Average Afr 12.3 12.1 0.081 0.075 ⫺0.401 ⫺0.552 ⫺0.405 997 NAf 32.3 10.2 0.045 0.040 ⫺0.512 ⫺0.846 ⫺1.707 578
Only SNPs were included in all analyses except in theHtest where indels were also used. *Two-tailedPⱕ 0.025 in Monte Carlo simulation. Afr, African; NAf, non-African. Underlined loci were sequenced in the same panel of 41 men.
aTMRCA values are based onWatterson’s (1975) estimator of 3Neand are in units of 1000 years (KYA).
In summary, there is substantial heterogeneity in pat- suggested that selection influenced variation at several of the loci studied.
terns of variation among loci on the X chromosome,
even when sampled in the same set of individuals. Previ- Here we consider our observations in light of two alternative demographic models incorporating selec-ous observations of heterogeneity among loci have been
interpreted as evidence for selection. For example, tion put forward byWallandPrzeworski(2000). The first is a model with long-term population growth ( Har-WallandPrzeworski(2000) tested whether patterns
of variation observed at a number of nuclear loci (in- pendinget al.1998) that is expected to lead to an excess of rare variants (i.e., negative TD) at all loci that are cluding some of those examined here) were compatible
with a variety of demographic models. They found that not subject to selection. Under this model, the negative TD seen at some loci reflects population growth while the low TD values at some loci (including DMD7and
P2Y10) and the high TD values at other loci (including the positive TD values, or those close to zero, observed at other loci reflect the action of diversity-enhancing
PDHA1andDMD44) together were not consistent with
a model of constant size or with a model of constant selection (Harpending and Rogers 2000; Walland
Przeworski2000;Rogers2001;Excoffier2002). The size followed by exponential growth. Even after
incorpo-rating more complex demographic components (such second model has constant population size (i.e., the onset of human population growth is too recent to leave a as a bottleneck or geographic structure), none of their
TABLE 4
Observed and expected number of polymorphic sites within humans in HKA test
Global Africans Non-Africans
Locus N Observed Expected Deviationa N Observed Expected Deviationa N Observed Expected Deviationa
APXL 41 19 19.85 0.013 10 12 13.14 0.028 31 9 11.24 0.209
AMELX 41 17 13.79 0.336 10 9 8.69 0.004 31 10 7.78 0.357
TNF 41 16 11.67 0.791 10 10 7.48 0.347 31 8 6.27 0.292
RRM2P 41 13 8.05 1.775 10 6 4.68 0.197 31 11 4.85 5.233
ALAS 41 7 8.51 0.153 10 6 6.03 0.000 31 1 4.55 1.895
MSN 41 9 11.98 0.360 10 4 7.88 0.759 31 8 7.51 0.018
DMD44 41 18 11.06 2.205 10 13 7.20 1.955 31 14 6.47 5.294
DMD7 41 9 12.33 0.430 10 6 8.47 0.274 31 4 7.14 0.802
L1CAM 41 6 6.55 0.029 10 5 4.60 0.019 31 1 3.44 1.286
G6PD 41 10 12.92 0.308 10 8 9.07 0.046 31 3 7.22 1.426
PDHA1 35 24 15.25 2.044 16 22 12.65 2.456 19 2 6.08 1.528
FIX 35 6 9.78 0.756 18 6 8.60 0.366 18 1 5.01 1.918
MAO-A 56 39 54.91 1.671 7 20 31.62 0.482 49 29 35.83 0.331
p2y10 69 33 32.22 0.006 24 24 25.01 0.11 46 17 17.88 0.017
DACH2 61 44 35.12 0.621 20 30 25.88 0.153 42 34 20.75 3.004
Degrees of freedom: 14 14 14
Chi-square value: 18.22 10.54 30.32
Probability from chi-square 0.197 0.722 0.007
distribution:
aDeviation is (observed⫺expected)2/variance. Variance is not shown. Underlined loci were sequenced in the same panel of 41 men.
while significantly negative TD values at other loci re- pendingandRogers2000;Excoffier2002).Rogers
(2001) took the opposite view ofNachman and
Cro-flect the recent effects of directional selection.
Results from previous analyses of X-linked loci have well(2000) by suggesting that patterns of variation at
DMD7reflect demography (i.e., expansion of popula-been interpreted to support both models. Nachman
and Crowell (2000) sampled variation at two DMD tion size) while those atDMD44 reflect a long history of balancing selection. However, it is difficult to see how introns and showed thatDMD7has much lower levels
of nucleotide diversity, many more rare polymorphisms, a long history of balancing selection could create the patterns of variation seen at DMD44 because there is higher levels of linkage disequilibrium, and different
Africanvs.non-African patterns, compared withDMD44. little linkage disequilibrium among sites at DMD44.
WoodingandRogers(2000) argued that even though They suggested that patterns of variation atDMD44are
consistent with a neutral equilibrium model of molecu- Tajima’s D test did not reject the null hypothesis of constant population size at the P2Y10 locus (
Kaess-lar evolution and that those atDMD7were shaped by
recent directional selection (especially out of Africa). mannet al.1999), the significantly negative Fu’sFsvalue at this locus does support a model of a Pleistocene
HarrisandHey(2001) compared patterns of variation
at PDHA1 and FIX and posited that the much lower population expansion. Yu et al.(2002b) interpreted a
significant Fu and Li’s D test to indicate a population global nucleotide diversity and skew in the frequency
distribution atFIXwas the result of a history of positive expansion signature atDACH2, despite a failure of Taji-ma’s Dand Fu’s Fstests to reject neutrality. They sug-directional selection, or background selection, acting
at or near FIX. In an earlier report, Harrisand Hey gested that ancient population subdivision must be taken into account to interpret these tests properly. We (1999) demonstrated thatPDHA1 had an unusual
pat-tern of sequence variation and suggested that this locus note that when the African and non-AfricanP2Y10and
DACH2 data sets are considered separately, an excess experienced some form of diversity-reducing selection
out-side of Africa. Similarly,Nachman et al.(2004) present of rare and/or singleton alleles is found only in the African samples (Table 3). Therefore, these loci do not evidence thatMSNandALAS2have patterns of variation
that reflect a history of diversity-reducing selection, with support the simplest model of population expansion. Non-African levels of polymorphism reject a neutral, stronger effects outside of Africa.
In contrast, other authors reached very different con- constant-size model by the conservative HKA test (Table 4), indicating that the variance in polymorphism among clusions on the basis of analyses of some of these very
(data not shown). Maximizing variance among loci pro-duces a simulated null distribution of the HKA statistic that is likely to be conservative when assessing the impact of a bottleneck on the test. We also incorporated esti-mates of the population recombination rate at each locus (data not shown) in the 15 locus simulations, which were replicated 1000 times. We find that our observed non-African HKA test statistic is still significantly too high (P⫽0.038) when compared with the null distribution generated by the conservative bottleneck model (Figure 4). This result is compelling evidence that a simple population bottleneck out of Africa is insufficient to account for the increased variance in polymorphism across loci, although more complex demographic mod-els might account for these observations.
We also observed a positive relationship between re-combination rate and nucleotide diversity (Figure 2). This relationship may be caused by either positive or negative selection at linked sites (Maynard Smithand
Haigh1974;Charlesworthet al.1993), by variation in underlying mutation rate, or by some combination of these factors. A simple test of the idea that variation in underlying mutation rate is responsible for the correla-Figure3.—Relationship between frequency spectra and
re-tion between nucleotide diversity and recombinare-tion rate combination rate in Africans and non-Africans. (A) Scatterplot
is to compare recombination rate with interspecific di-of FLD values in Africansvs. recombination rate for loci in
Table 3. Solid diamonds represent 10 loci sequenced in the vergence. Several different studies have documented a same panel ofN⫽41 samples (linear regression:R2⫽0.014,
significant positive correlation between recombination P⫽0.747). Open diamonds represent 5 additional X-linked rate in humans and interspecific divergence (
Lercher
loci sequenced in similar global panel (linear correlation for
andHurst2002;Waterstonet al.2002;Hardisonet
15 loci:R2⫽0.014,P⫽0.675). (B) Scatterplot of FLD values
al.2003;Hellmannet al.2003) and, thus, it seems likely in non-Africansvs.recombination rate (10-locus linear
regres-sion:R2⫽0.520,P⫽0.019; 15-locus linear regression:R2⫽ that variation in mutation rate accounts for some of 0.454,P⫽0.006). Trend lines are based on the sample of 15 loci. the variation in nucleotide diversity. In this study we observed a significant positive correlation between nu-cleotide diversity and recombination rate but not be-large variance in polymorphism across loci primarily tween interspecific divergence and recombination rate the product of either natural selection acting upon a (Figure 2), although both showed positive trends. The subset of loci or a history of nonequilibrium demogra- stronger association between nucleotide diversity and phy out of Africa (e.g., a population bottleneck)? Al- recombination rate here, compared with other studies, thoughHudsonet al.(1987) initially dismissed the pos- is noteworthy in two respects. First, many studies sample sibility that a bottleneck systematically influences the single nucleotide polymorphisms (SNPs) in a heteroge-HKA test, we have conducted coalescent simulations neous pool of individuals with small sample sizes instead of intermediate strength bottlenecks that result in an of a common sample for all loci. For example, the aver-increase in the variance of polymorphism across un- age sample size for most genomic regions in the SNP linked loci. These simulations were not intended to consortium data that are analyzed in Lercher and estimate bottleneck parameters from the data, but in- Hurst(2002) andWaterstonet al.(2002) is two (
Figure 4.—Distribution of 2 val-ues obtained from 1000 simulated 15-locus HKA tests performed on a pop-ulation of constant size (solid bars) and a population experiencing a bot-tleneck of intermediate strength (open bars). The population recom-bination () and mutation parame-ters () per locus were estimated simultaneously from the African sam-ples using the method ofFearnhead andDonnelly(2001). Using the co-alescent program of Hudson (http:// home.uchicago.edu/rhudson1/ source/mksamples.html), the non-Afri-can bottleneck was simulated with the following parameters: (a) between species divergence: 30Ngenerations (corresponding to 6 MYA, assuming N ⫽104 and generation time⫽ 20 years); (b) and per locus are estimated from the observed data; (c) the bottleneck ends 0.25Ngenerations ago; and (d) the bottleneck imposes a 40-fold reduction of the ancestral African population size and lasts for 0.03Ngenerations. Changes in population size are assumed to be instantaneous. The observed2value for the non-African data is indicated by an arrow.
(Charlesworthet al.1993), hitchhiking effects are ex- within functional genes and a pseudogene, which may be less perturbed by selection than introns of genes. We pected to be stronger (discussed inBegunandWhitley
2000) as a consequence of either higher fixation rates chose theRRM2P4pseudogene in particular because it maps to a region of high recombination and low gene (Charlesworth et al. 1987) or shorter sojourn times
(Avery1984). density on Xq27.3 and thus should provide good
esti-mates of neutral parameters. We found that levels and We also found a positive relationship between
recom-bination rate and frequency spectra in our non-African patterns of variation at this pseudogene are similar to those at other loci exhibiting high levels of variation sample, but not in our African sample (Figure 3). Such a
relationship is not expected under a neutral equilibrium (e.g.,DMD44,DACH2,AMELX,APXL). This region has the third highest level of diversity, exhibits no skew in model (Przeworskiet al. 2001). One explanation for
this observation is that diversity-reducing selective forces the frequency spectrum, and harbors similar levels of variation in African and non-African samples. This sup-(i.e., hitchhiking or background selection) have led to
an excess over neutral expectations of singletons at loci ports the hypothesis that similar patterns of variation at other high variation loci reflect neutral demographic in regions of lower recombination (Charlesworthet al.
1993;Bravermanet al.1995). However,Andolfattoand processes.
If we accept that these five X-linked regions, as well
Przeworski(2001) demonstrated that a similar positive
correlation between the summary of the frequency spec- asP2Y10andTNFSF5, are relatively free from the influ-ences of natural selection, then what can we discern trum of polymorphic mutations (both TD and FLD) and
the recombination rate inD. melanogaster, while expected about human demography from patterns of variation at these loci? There is only a minor reduction in non-under simple hitchhiking models, was unlikely non-under
a model of background selection. Neither is there an African diversity (i.e.,ⵑ20%), a slightly negative TD in Africa, and a TD close to zero out of Africa. These expectation that diversity-enhancing selection would
lead to a positive correlation between FLD and recombi- data do not provide evidence for long-term population growth outside Africa. Rather, they are consistent with nation rate. Moreover, the expected signature of
long-term balancing selection—a peak of polymorphism sur- a larger effective population size for Africans and the possibility that non-Africans experienced a phase of pop-rounding a selected site—has not been observed at loci
with high levels of variation and positive TD or FLD ulation size reduction during which rare variants were lost more quickly than common variants (Zietkiewicz
values (Wall and Przeworski 2000). As mentioned
above, the correlation between recombination rate and et al.1997;Przeworskiet al.2000). While it is possible that both diversity-reducing selection and population nucleotide diversity was also stronger in non-Africans
compared with Africans. The combined data suggest expansion have left signatures on X-linked loci, it is diffi-cult to explain the heterogeneous patterns observed that positive directional selection (i.e., hitchhiking) may
be a more important factor influencing X chromosome here by a simple model of population expansion without selection. We note that after removing the five loci show-variation outside Africa.
Frisse, L., R. R. Hudson, A. Bartoszewicz, J. D. Wall, J. Donfack
DMD7,L1CAM, andFIX) there is still considerable
het-et al., 2001 Gene conversion and different population histories
erogeneity among loci, especially in the non-African may explain the contrast between polymorphism and linkage samples. More realistic models of human demography disequilibrium levels. Am. J. Hum. Genet.69:831–843.
Fu, Y. X., andW.-H. Li, 1993 Statistical tests of neutrality of
muta-might include more complex patterns of subdivision
tions. Genetics133:693–709.
and population size changes (Pluzhnikovet al.2002), Gilad, Y., S. Rosenberg, M. Przeworski, D. LancetandK. Skorecki, changing migration rates over time (Wakeley 1999) 2002 Evidence for positive selection and population structure at the human MAO-A gene. Proc. Natl. Acad. Sci. USA99:862–867.
and/or low levels of admixture with archaic Homo.
Fi-Halushka, M. K., J. B. Fan, K. Bentley, L. Hsie, N. Shenet al., 1999
nally, the unexpected finding of several X-linked loci Patterns of single-nucleotide polymorphisms in candidate genes with a putative signature of selection (Przeworski2002) for blood-pressure homeostasis. Nat. Genet.22:239–247.
Hammer, M. F., 1995 A recent common ancestry for human Y
chro-is conschro-istent with the possibility that the colonization of
mosomes. Nature378:376–378.
novel environments by modern humans as they mi- Hammer, M. F., T. M. Karafet, A. J. Redd, H. Jarjanazi, S. Santachi-grated out of Africa in the lastⵑ50,000 years may have ara-Benerecettiet al., 2001 Hierarchical patterns of global human Y-chromosome diversity. Mol. Biol. Evol.18:1189–1203.
coincided with a burst of adaptive evolution (Payseur
Hammer, M. F., F. Blackmer, D. Garrigan, M. W. Nachmanand
et al.2002;Kayseret al.2003;Mishmaret al.2003).
J. A. Wilder, 2003 Human population structure and its effects on sampling Y chromosome sequence variation. Genetics164:
Publication of this article was made possible by grants BCS-9906362
1495–1509. (to M.W.N. and M.F.H.) from the National Science Foundation (NSF)
Harding, R. M., S. M. Fullerton, R. C. Griffiths, J. Bond, M. J. Cox
and GM-53566 from the National Institute of General Medical
Sci-et al., 1997 Archaic African and Asian lineages in the genetic ences (to M.F.H.). Its contents are solely the responsibility of the
ancestry of modern humans. Am. J. Hum. Genet.60:772–789. authors and do not necessarily represent the official views of the NSF Hardison, R. C., K. M. Roskin, S. Yang, M. Diekhans, W. J. Kent or the National Institutes of Health. et al., 2003 Covariation in frequencies of substitution, deletion, transposition, and recombination during eutherian evolution. Genome Res.13:13–26.
Harpending, H., andA. Rogers, 2000 Genetic perspectives on
hu-LITERATURE CITED man origins and differentiation. Annu. Rev. Genomics Hum. Genet.1:361–385.
Alonso, S., andJ. A. Armour, 2001 A highly variable segment of Harpending, H. C., M. A. Batzer, M. Gurven, L. B. Jorde, A. R. human subterminal 16p reveals a history of population growth Rogerset al., 1998 Genetic traces of ancient demography. Proc. for modern humans outside Africa. Proc. Natl. Acad. Sci. USA Natl. Acad. Sci. USA95:1961–1967.
98:864–869. Harris, E. E., andJ. Hey, 1999 X chromosome evidence for ancient
Altshuler, D., V. J. Pollara, C. R. Cowles, W. J. Van Etten, J. human histories. Proc. Natl. Acad. Sci. USA96:3320–3324. Baldwinet al., 2000 An SNP map of the human genome
gener-Harris, E. E., andJ. Hey, 2001 Human populations show reduced ated by reduced representation shotgun sequencing. Nature407: DNA sequence variation at the factor IX locus. Curr. Biol.11:
513–516.
774–778.
Andolfatto, P., andM. Przeworski, 2001 Regions of lower cross- Hellmann, I., I. Ebersberger, S. E. Ptak, S. PaaboandM. Przewor-ing over harbor more rare variants in African populations of
ski, 2003 A neutral explanation for the correlation of diversity
Drosophila melanogaster. Genetics158:657–665. with recombination rates in humans. Am. J. Hum. Genet.72:
Aquadro, C. F., D. J. BegunandE. C. Kindahl, 1994 Selection,
1527–1535. recombination, and DNA polymorphism inDrosophila, pp. 46–55
Hey, J., 1997 Mitochondrial and nuclear genes present conflicting inNon-neutral Evolution: Theories and Molecular Data, edited by B.
portraits of human origins. Mol. Biol. Evol.14:166–172.
Golding. Chapman & Hall, New York.
Hudson, R. R., M. KreitmanandM. Aguade´, 1987 A test of neutral
Avery, P. J., 1984 The population genetics of haplo-diploids and
molecular evolution based on nucleotide data. Genetics 116:
X-linked genes. Genet. Res.44:321–341.
153–159.
Begun, D. J., andC. F. Aquadro, 1992 Levels of naturally occurring
Hudson, R. R., M. SlatkinandW. P. Maddison, 1992 Estimation DNA polymorphism correlate with recombination rates in D.
of levels of gene flow from DNA sequence data. Genetics132:
melanogaster. Nature356:519–520.
583–589.
Begun, D. J.,andP. Whitley, 2000 Reduced X-linked nucleotide
Jaruzelska, J., E. Zietkiewicz, M. Batzer, D. E. Cole, J. P. Moisan
polymorphism inDrosophila simulans. Proc. Natl. Acad. Sci. USA
et al., 1999 Spatial and temporal distribution of the neutral
97:5960–5965.
polymorphisms in the last ZFX intron: analysis of the haplotype
Braverman, J. M., R. R. Hudson, N. L. Kaplan, C. H. Langleyand
structure and genealogy. Genetics152:1091–1101.
W. Stephan, 1995 The hitchhiking effect on the site frequency
Kaessmann, H., F. Heissig, A. von HaeselerandS. Paabo, 1999 spectrum of DNA polymorphisms. Genetics140:783–796.
DNA sequence variation in a non-coding region of low
recombi-Carlson, C. S., M. A. Eberle, M. J. Rieder, J. D. Smith, L. Kruglyak
nation on the human X chromosome. Nat. Genet.22:78–81.
et al., 2003 Additional SNPs and linkage-disequilibrium analyses
Kayser, M., S. BrauerandM. Stoneking, 2003 A genome scan to are necessary for whole-genome association studies in humans.
detect candidate regions influenced by local natural selection in Nat. Genet.33:518–521.
human populations. Mol. Biol. Evol.20:893–900.
Charlesworth, B., J. Coyne andN. Barton, 1987 The relative
Kitano, T., C. Schwarz, B. NickelandS. Paabo, 2003 Gene diver-rates of evolution of sex chromosomes and autosomes. Am. Nat.
sity patterns at 10 X-chromosomal loci in humans and
chimpan-130:113–146.
zees. Mol. Biol. Evol.20:1281–1289.
Charlesworth, B., M. T. MorganandD. Charlesworth, 1993
Kong, A., D. F. Gudbjartsson, J. Sainz, G. M. Jonsdottir, S. A.
The effect of deleterious mutations on neutral molecular
varia-Gudjonssonet al., 2002 A high-resolution recombination map tion. Genetics134:1289–1303.
of the human genome. Nat. Genet.31:241–247.
Excoffier, L., 2002 Human demographic history: refining the
re-Lercher, M. J., andL. D. Hurst, 2002 Human SNP variability and cent African origin model. Curr. Opin. Genet. Dev.12:675–682.
mutation rate are higher in regions of high recombination.
Fay, J. C., andC.-I Wu, 1999 A human population bottleneck can
Trends Genet.18:337–340. account for the discordance between patterns of mitochondrial
Li, W. H., andL. A. Sadler, 1991 Low nucleotide diversity in man. versus nuclear DNA variation. Mol. Biol. Evol.16:1003–1005.
Genetics129:513–523.
Fay, J. C., andC.-I Wu, 2000 Hitchhiking under positive Darwinian
Maynard Smith, J., andJ. Haigh, 1974 The hitch-hiking effect of selection. Genetics155:1405–1413.
a favourable gene. Genet. Res.23:23–35.
Fearnhead, P., andP. Donnelly, 2001 Estimating recombination
et al., 2003 Natural selection shaped regional mtDNA variation Saunders, M. A., M. F. HammerandM. W. Nachman, 2002 Nucleo-tide variability at g6pd and the signature of malarial selection in in humans. Proc. Natl. Acad. Sci. USA100:171–176.
Nachman, M. W., andS. L. Crowell, 2000 Contrasting evolutionary humans. Genetics162:1849–1861.
Shen, P., F. Wang, P. A. Underhill, C. Franco, W. H. Yanget al., histories of two introns of the Duchenne muscular dystrophy
gene, Dmd, in humans. Genetics155:1855–1864. 2000 Population genetic implications from sequence variation in four Y chromosome genes. Proc. Natl. Acad. Sci. USA 97:
Nachman, M. W., V. L. Bauer, S. L. CrowellandC. F. Aquadro,
1998 DNA variability and recombination rates at X-linked loci 7354–7359.
Stephens, J. C., J. A. Schneider, D. A. Tanguay, J. Choi, T. Acharya
in humans. Genetics150:1133–1141.
Nachman, M. W., S. L. D’Agostino, C. R. Tillquist, Z. Mobasher et al., 2001 Haplotype variation and linkage disequilibrium in 313 human genes. Science293:489–493.
andM. F. Hammer, 2004 Nucleotide variation atMsnandAlas2,
two genes flanking the centromere of the X chromosome in Tajima, F., 1989 Statistical method for testing the neutral mutation hypothesis by DNA polymorphism. Genetics123:585–595. humans. Genetics167:423–437.
Tishkoff, S. A., E. Dietzsch, W. Speed, A. J. Pakstis, J. R. Kiddet
Nei, M., 1987 Molecular Evolutionary Genetics. Columbia University
al., 1996 Global patterns of linkage disequilibrium at the CD4 Press, New York.
locus and modern human origins. Science271:1380–1387.
Nei, M., andW. H. Li, 1979 Mathematical model for studying genetic
Vigilant, L., M. Stoneking, H. Harpending, K. HawkesandA. C.
variation in terms of restriction endonucleases. Proc. Natl. Acad.
Wilson, 1991 African populations and the evolution of human Sci. USA76:5269–5273.
mitochondrial DNA. Science253:1503–1507.
Payseur, B. A., A. D. CutterandM. W. Nachman, 2002 Searching
Wakeley, J., 1999 Nonequilibrium migration in human history. Ge-for evidence of positive selection in the human genome using
netics153:1863–1871. patterns of microsatellite variability. Mol. Biol. Evol.19:1143–
Wall, J. D., andM. Przeworski, 2000 When did the human popula-1153.
tion size start increasing? Genetics155:1865–1874.
Pluzhnikov, A., A. Di RienzoandR. R. Hudson, 2002 Inferences
Waterston, R. H., K. Lindblad-Toh, E. Birney, J. Rogers, J. F.
about human demography based on multilocus analyses of
non-Abrilet al., 2002 Initial sequencing and comparative analysis coding sequences. Genetics161:1209–1218.
of the mouse genome. Nature420:520–562.
Przeworski, M., 2002 The signature of positive selection at
ran-Watterson, G. A., 1975 On the number of segregating sites in domly chosen loci. Genetics160:1179–1189.
genetical models without recombination. Theor. Popul. Biol.7:
Przeworski, M., R. R. HudsonandA. Di Rienzo, 2000 Adjusting
256–276. the focus on human variation. Trends Genet.16:296–302.
Whitfield, L. S., J. E. SulstonandP. N. Goodfellow, 1995
Se-Przeworski, M., J. D. WallandP. Andolfatto, 2001
Recombina-quence variation of the human Y chromosome. Nature378:379– tion and the frequency spectrum in Drosophila melanogaster
380. and Drosophila simulans. Mol. Biol. Evol.18:291–298.
Wooding, S., andA. Rogers, 2000 A Pleistocene population X-plosion?
Ptak, S. E., and M. Przeworski, 2002 Evidence for population
Hum. Biol.72:693–695.
growth in humans is confounded by fine-scale population struc- YChromosome Consortium, 2002 A nomenclature system for the ture. Trends Genet.18:559–563.
tree of Y chromosomal binary haplogroups. Genome Res. 12:
Reich, D. E., M. Cargill, S. Bolk, J. Ireland, P. C. Sabetiet al., 339–348.
2001 Linkage disequilibrium in the human genome. Nature Yu, N., F. C. Chen, S. Ota, L. B. Jorde, P. Pamiloet al., 2002a Larger
411:199–204. genetic differences within Africans than between Africans and
Rogers, A. R., 2001 Order emerging from chaos in human evolu- Eurasians. Genetics161:269–274.
tionary genetics. Proc. Natl. Acad. Sci. USA98:779–780. Yu, N., Y. X. Fuand W. H. Li, 2002b DNA polymorphism in a
Romualdi, C., D. Balding, I. S. Nasidze, G. Risch, M. Robichaux worldwide sample of human X chromosomes. Mol. Biol. Evol.
et al., 2002 Patterns of human diversity, within and among conti- 19:2131–2141.
nents, inferred from biallelic DNA polymorphisms. Genome Res. Zietkiewicz, E., V. Yotova, M. Jarnik, M. Korab-Laskowska, K. K.
12:602–612. Kiddet al., 1997 Nuclear DNA diversity in worldwide distributed
Rozas, J., andR. Rozas, 1999 DnaSP version 3: an integrated pro- human populations. Gene205:161–171. gram for molecular population genetics and molecular evolution