Copyright2003 by the Genetics Society of America
A High-Density Genetic Recombination Map of Sequence-Tagged Sites for
Sorghum, as a Framework for Comparative Structural and Evolutionary
Genomics of Tropical Grains and Grasses
John E. Bowers,* Colette Abbey,
†Sharon Anderson,
†Charlene Chang,
†Xavier Draye,
†Alison H. Hoppe,
†Russell Jessup,
†Cornelia Lemke,* Jennifer Lennington,
†Zhikang Li,
†Yann-rong Lin,
†Sin-chieh Liu,
†Lijun Luo,
†Barry S. Marler,*
Reiguang Ming,
†Sharon E. Mitchell,
‡Dou Qiang,
†Kim Reischmann,
†Stefan R. Schulze,* D. Neil Skinner,* Yue-wen Wang,
†Stephen Kresovich,
‡Keith F. Schertz
†and Andrew H. Paterson*
,†,1*Plant Genome Mapping Laboratory, University of Georgia, Athens, Georgia 30602,†Plant Genome Mapping Laboratory,
Department of Soil and Crop Science, Texas A&M University, College Station, Texas 77843 and
‡Institute for Genomic Diversity, Cornell University, Ithaca, New York 14850
Manuscript received February 5, 2003 Accepted for publication May 5, 2003
ABSTRACT
We report a genetic recombination map for Sorghum of 2512 loci spaced at average 0.4 cM (ⵑ300 kb) intervals based on 2050 RFLP probes, including 865 heterologous probes that foster comparative genomics of Saccharum (sugarcane), Zea (maize), Oryza (rice), Pennisetum (millet, buffelgrass), the Triticeae (wheat, barley, oat, rye), and Arabidopsis. Mapped loci identify 61.5% of the recombination events in this progeny set and reveal strong positive crossover interference acting across intervals ofⱕ50 cM. Significant variations in DNA marker density are related to possible centromeric regions and to probable chromosome structural rearrangements between Sorghum bicolor and S. propinquum, but not to variation in levels of intraspecific allelic richness. While cDNA and genomic clones are similarly distributed across the genome, SSR-containing clones show different abundance patterns. Rapidly evolving hypomethylated DNA may contribute to intraspecific genomic differentiation. Nonrandom distribution patterns of multiple loci detected by 357 probes suggest ancient chromosomal duplication followed by extensive rearrangement and gene loss. Exemplifying the value of these data for comparative genomics, we support and extend prior findings regarding maize-sorghum synteny—in particular, 45% of comparative loci fall outside the inferred colinear/syntenic regions, suggesting that many small rearrangements have occurred since maize-sorghum divergence. These genetically anchored sequence-tagged sites will foster many structural, func-tional and evolutionary genomic studies in major food, feed, and biomass crops.
A
S a model for the large genomes of many tropical cally important crops, may have shared a common an-cestor as recently as 5 million years ago (Sobral et al. grasses, sorghum [Sorghum bicolor L. Moench.; 748–1994), retain similar gene order (Ming et al. 1998), 772 million base pairs (Mbp); Arumuganathan and
and even produce viable progeny in some intergeneric
Earle 1991] is a logical complement to Oryza (rice;
crosses (Dewet et al.1976; P. L. Morrell and A. H.
ⵑ420 Mbp;ArumuganathanandEarle1991), a
dis-Paterson, personal communication). By contrast, rice tant relative (tribe Oryzeae) that will be the first grass
and the maize/sorghum lineage may have divergedⵑ50 genome to be completely sequenced (Goffet al.2002;
million years ago (Linder1987) and show much more
Yu et al. 2002). Sorghum is an especially important
chromosomal rearrangement (Patersonet al.1995a). bridge to several economically important large-genome
Analysis of the levels and patterns of genomic diversity crops in its own tribe (Andropogoneae) such as maize
within and between sorghum, sugarcane, rice, and (ⵑ2292–2716 Mbp) with which it may have shared
com-maize (and others) promises to advance understanding mon ancestry between 11 (Gautand Doebley 1997)
of the biology and evolution of Poaceae grain and bio-and 24 (Thomasson1987) million years ago. Sorghum
mass crops and reveal new opportunities for their im-and sugarcane, a large-genome (ⵑ2547–3605 Mbp)
provement. polyploid that ranks among the world’s most
economi-Worldwide, sorghum is the fifth most important grain crop grown based on tonnage, after maize, wheat, rice, and barley (http://www.fao.org). Sorghum is unusually
1Corresponding author:Plant Genome Mapping Laboratory, 111
River-tolerant of low input levels, an essential trait for areas
bend Rd., Rm. 228, University of Georgia, Athens, GA 30602.
E-mail: [email protected] such as northeast Africa and the U.S. Southern Plains
368 J. E. Bowerset al.
that receive too little rainfall for most other grains. In tant quantitative trait loci (QTL) but lack the high marker density needed for use in complex endeavors the more arid countries of northeast Africa, such as
Sudan, sorghum contributes 39% of the calories in the such as positional cloning of genes, genetic anchoring of bacterial artificial chromosome (BAC)-based physical human diet (http://www.fao.org; 1999 statistics).
In-creased demand for limited fresh water supplies, cou- maps, or assembly of genomic shotgun sequence. The only other high-density sorghum map (Menzet al.2002) pled with global climatic trends and expanding
popula-tions, suggests that dryland crops such as sorghum will is composed largely of amplified fragment length poly-morphisms; the difficulties associated with inferring or-be of growing importance.
Despite the likely growing importance of sorghum, thology of these arbitrary-sequence markers across taxa constrain its value for comparative and evolutionary ge-its improvement has lagged behind that of maize, wheat,
and rice, each of which have more than doubled in nomics. Our map is currently being used to anchor BAC-based physical maps of both S. bicolorand S. propinquum average yield on a worldwide basis in the last 38 years
while sorghum yields have gained only 51% (average (Linet al. 1999; Draye et al. 2001), to facilitate rapid gene isolation by map-based cloning and provide land-1961–1963 compared to 1999–2001; http://www.fao.
org). In sub-Saharan Africa, already home to many of marks for eventual genomic sequence assembly. The genetically anchored probes used in this map are also the world’s hungry and with a population projected to
double over the next 40 years (U.S. Census Bureau being hybridized to BAC libraries from rice, sugarcane, and maize, fostering comparative genomics across the estimates 2002; http://www.census.gov), sorghum yields
have gained only 6% over the last 38 years compared Poaceae. to 50% gains in wheat and maize (http://www.fao.org).
In the U.S., sorghum was introduced over 200 years
MATERIALS AND METHODS ago, possibly by Benjamin Franklin (Smithand
Freder-iksen 2000) and is now grown on 9–13 million acres. Laboratory procedures:The genetic population and molec-U.S. sorghum is principally used as an animal feed and ular methods are as previously described (Chittendenet al. therefore escapes direct notice by the general public, 1994), except that the mapping population was expanded to 65 individuals from 56, drawing additional F2progeny at
but is the 13th most valuable crop in the U.S. with a
random from residual seeds of the original cross. Briefly, DNA farm-gate value ranging from $0.8 to 2.0 billion/year
was extracted from young leaves by a published protocol (USDA 1992–2001 statistics).
(Chittendenet al.1994),ⵑ5g DNA per lane digested with
S. bicoloris native to Africa. One other euploid species 15 units ofEcoRI,HindIII, orXbaI (Promega, Madison, WI), exists within the genus,S. propinquum, which is native electrophoresed and blotted onto Hybond N⫹ (Amersham, Arlington Heights, IL), rinsed in 2⫻SSC, and stored at 4⬚ to Asia and contains many “weediness” traits such as
rhi-until use. About 20–50 ng of PCR-amplified fragment was zomes, small seeds, and shattering. The genus also
in-labeled with [32P]dCTP, hybridized to blots, washed, and
ex-cludes S. halepense, a tetraploid (2n ⫽ 40) thought to
posed to X-ray film as described (Chittendenet al.1994). be derived from naturally occurring crosses between DNA markers and sequences:Prefixes of DNA markers used S. bicolorandS. propinquum(both 2n⫽20).S. halepenseis and their sources are as follows. Arabidopsis cDNA: AEST (R. Scholl, Arabidopsis Biological Resources Center, Ohio State among the world’s most noxious weeds, with widespread
University), AHD and HMG (T. Thomas, Texas A&M); Barley distribution. In the U.S., many local epithets forS.
hale-cDNA: BCD (M. Sorrells and S. Tanksley, Cornell);
Johnson-pensehave largely been supplanted by the term “Johnson
grass rhizome cDNA: pHER, pSHR (Y.Siand A. H.Paterson, grass,” first documented in an 1874 letter, referring to unpublished results); Maize PstI genomic clones: BNL, UMC Colonel William Johnson, an Alabaman who sowed it (E. Coe and M. McMullen, University of Missouri); Maize on his farm (McWhorter1971). The first U.S. federal cDNA: CSU (Coe, McMullen); Millet Pst1 genomic clones: M (M. Gale, John Innes Center); Oat cDNA: CDO (Sorrells, appropriation for weed research targeted Johnsongrass
Tanksley); Sorghum cDNA: HHU (Wyrich et al. 1998), (House Bill 121, 56th Congress, 1900).
HHUK (Annen et al. 1998); Sorghum phytochrome genes: Cross-fertility between S. bicolor and S. propinquum PHY (L. H. Pratt and M.-M. C.-Pratt, University of Georgia); has permitted us not only to benefit from high levels of Sorghum PstI genomic DNA: pSB, SHO (A. H. Paterson); DNA polymorphism between them to build the detailed Sugarcane cDNA: CDSB, CDSR (P. Moore, Hawaiian Agricul-tural Research Center); Sugarcane genomic clones: SG (Sor-molecular map described herein, but also to conduct
rells); Rice genomic clones: RG and cDNA: RZ (S. McCouch genetic analysis of many traits associated with grass
do-and S. Tanksley, Cornell), C, G, do-and R (T. Sasaki, RGP, Japan). mestication (e.g.,Patersonet al.1995a,b). The genetic
Sequences were obtained from the National Center for Bio-map presented herein builds on and integrates much technology Information (NCBI) or developed in house by end earlier work (Chittenden et al. 1994;Lin et al. 1995; sequencing of probes using standard methods. In house se-quencing used a software pipeline in which sequence data in
Annenet al.1998;Wyrichet al.1998;Drayeet al.2001).
ABI trace file format were input into the programs PHRED Several other sorghum maps (Whitkus et al. 1992;
(version 0.000925.c) and CROSS_MATCH (version 0.990329
Ragab et al. 1994;Xu et al. 1994;Dufour et al. 1997;
with minmatch⫽12 and minscore⫽20) to trim poor quality
impor-369 Sorghum STS Map for Comparative Genomics
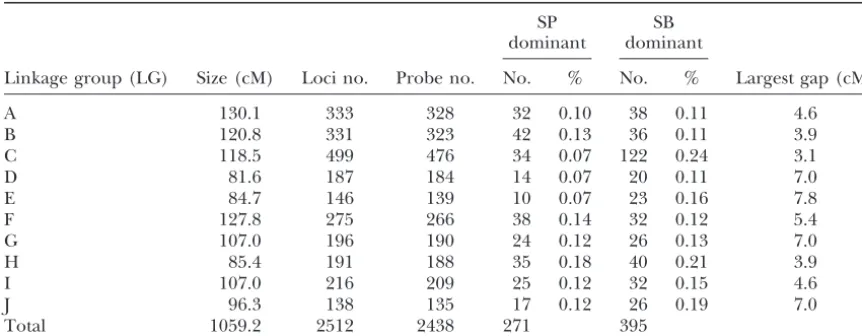
TABLE 1
Summary statistics for the SB⫻SP linkage groups
SP SB
dominant dominant
Linkage group (LG) Size (cM) Loci no. Probe no. No. % No. % Largest gap (cM)
A 130.1 333 328 32 0.10 38 0.11 4.6
B 120.8 331 323 42 0.13 36 0.11 3.9
C 118.5 499 476 34 0.07 122 0.24 3.1
D 81.6 187 184 14 0.07 20 0.11 7.0
E 84.7 146 139 10 0.07 23 0.16 7.8
F 127.8 275 266 38 0.14 32 0.12 5.4
G 107.0 196 190 24 0.12 26 0.13 7.0
H 85.4 191 188 35 0.18 40 0.21 3.9
I 107.0 216 209 25 0.12 32 0.15 4.6
J 96.3 138 135 17 0.12 26 0.19 7.0
Total 1059.2 2512 2438 271 395
accession numbers is available as supplementary documenta- RESULTS
tion at http://www.genetics.org/supplemental/.
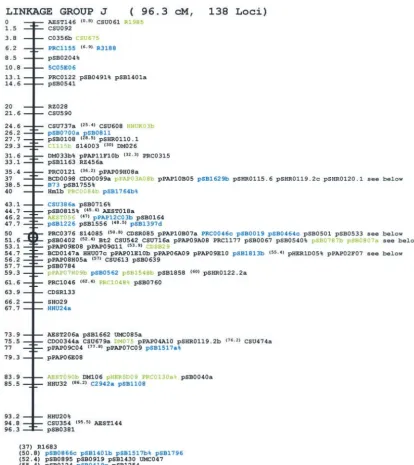
Genetic map:The SB ⫻ SP map (Table 1; Figure 1
Map construction:A framework map ofⵑ600 codominant
and available at http://www.plantgenome.uga.edu/ markers was constructed using the program MAPMAKER v2.0
on the PC, with error detection on (Lander et al.1987). A sorghummap) is composed of 2512 loci on 10 linkage new program written in Microsoft Visual Basic ( J. E.Bowers groups that collectively span 1059.2 cM (Kosambi1944).
and A. H.Paterson, unpublished data) was then used to
This is a 2236-locus (about sevenfold) increase com-insert additional markers into the framework. The algorithm
pared to our previously published map of 276 loci used by this program was to determine the genotypes of each
(Chittenden et al. 1994), yet the recombinational individual for each interval between markers already placed
on the map, with multiple genotypes possible for individuals length has actually been reduced from 1445 cM to the in which crossovers were observed between the framework current 1059.2 cM largely by virtue of a sufficiently high loci. In cases where genotypes were uncertain due to dominant density of markers to distinguish errors from true dou-markers or missing data, the genotypes of the intervals were
ble recombinants. The map is based on a total of 1376 inferred from flanking loci, assuming that the minimum
num-detected crossovers (see materials and methods), ber of recombinations had occurred. An unmapped locus was
which would correspond to 1386 potentially distinct tested against the possible genotypes for all intervals already
on the map, in search of a perfect match. If such a match was map locations; we have identified markers at 853 found the marker was assigned to the appropriate interval, (61.5%) of these possible locations. The largest gap and then the framework was recomputed. If no perfect match between two loci corresponds to only 7.8 cM or 10 cross-was found, a second pass cross-was made looking for matches to all
overs and only seven intervals in the map were⬎5 cM. but one individual, followed by subsequent passes with higher
On the basis of the 65 F2plants used, a single
recombi-numbers of nonmatching individuals. Loci from these
subse-quent passes were rechecked for scoring errors in the individ- nation event yields an estimate of 0.77 cM between con-ual that did not fit the expected pattern. If the data were secutive loci, which defines the resolution limit of the determined to be correct the locus was then added to the map. Consequently, loci are plotted to intervals of this framework map with a new recombination event not observed
size (in the figure rounded to one decimal place). in the previous map. Individuals mapping to the ends of the
All of the restriction fragment length polymorphism chromosomes could not be placed with this approach and had
(RFLP) markers tested could be placed on the map to be added to the framework manually or with Mapmaker.
After the map had been constructed, it was manually edited although a small number (⬍20) that had initially been to reduce the number of recombinations by exporting the scored were determined in retrospect to be too faint locations of crossovers observed in the map into a spreadsheet. for accurate scoring and were discarded. A similar num-Instances with multiple recombinations for an individual
prog-ber of markers with two segregating bands of nearly the eny plant were reordered if possible to reduce the total
num-same migration rates, which could not be reliably distin-ber of recombination events observed. This step involved
ex-guished from one another, were also discarded. Another tensive checking of the raw data (films) for errors, with the
plants apparently responsible for double recombinations be- group of⬍20 markers that could not be mapped showed ing rechecked. Ostensibly codominant markers that could not segregation ratios approaching 15:1 and were assumed be placed on the map were split into two dominant markers to be caused by two loci with indistinguishable band to attempt their mapping separately. Final map distances were
sizes and were therefore discarded. computed using Kosambi (1944) centimorgans (cM), and
Duplicate probes were removed from the map by in-maps were drawn by another Visual Basic program written for
coseg-370 J. E. Bowerset al.
371 Sorghum STS Map for Comparative Genomics
372 J. E. Bowerset al.
373 Sorghum STS Map for Comparative Genomics
Figure1.—Continued.
regating loci and also by sequence comparisons of most found in the population vs. 262 adjacent crossovers, a highly significant difference (Figure 2). The numbers probes. Some probes used in past studies were shown
to be identical to newly mapped sorghum probes and of observed genotypes in the two categories differ sig-nificantly (P ⬍ 0.05) from the expected (equal num-in a few cases cDNAs from other species corresponded
closely to sorghum probes or to one another. In cases bers) for cases in which the two recombination events were separated by 0–10 cM, 10–20 cM, and 40–50 cM where RFLP markers had similar or identical sequences
and mapped to similar or identical loci, one of the and narrowly missed significance for the 20–30 cM (0.07) and 30–40 cM (0.06) spacings. Over intervals of duplicates was removed from the map. In total, this
resulted in the removal of 336 markers at 386 loci (which ⬎50 cM, no significant differences were found in the frequency of doublevs.adjacent crossovers.
are not included in the 2050 probes and 2512 loci that
compose the map). The genetic locations and correspond- Segregation distortion: Five regions on the genetic map showed segregation distortion significant at the 5% ing information for these loci remain available at our web
site (http://www.plantgenome.uga.edu/sorghummap). level. The apices of distortion in the five regions were on LG B near cM 50.0, LG C near cM 46.2, LG D near
Recombinational interference: Recombinational
in-terference was assessed by comparing the frequency of cM 66.2, LG G near cM 26.2, and LG I near cM 0.0. Curiously, all five regions showed segregation distortion occurrence of “double crossover” genotypes (i.e., aa–
ab–aa; bb–ab–bb) to “adjacent crossover” genotypes favoring the S. bicolor alleles. By far the most striking case was on LG C—the apex of the distortion was near (i.e., aa–ab–bb; bb–ab–aa) as a function of the size of
the interval that contains the two crossovers required to the locus CSU507 and comprised a segregation ratio of 41:17:2 (homozygous S. bicolor :heterozygote:homozy-produce each genotype. In the absence of interference,
these two different classes of genotypes would be equally gousS. propinquum), significantly (P⬍3⫻10⫺12)
differ-ent from the expected 1:2:1 ratio. In a larger set of F2
374 J. E. Bowerset al.
Figure1.—Continued.
progeny from the same cross (Linet al.1995;Paterson dw2gene regulating plant stature (Linet al. 1995; Pat-ersonet al. 1995a), andpApo1gene regulating apomixis et al. 1995a), we found similarly distorted segregation
(236:94:8) in this region. (R.Jessup, G.Burow, M.Husseyand A. H.Paterson,
personal communication)]. The average number of loci
Patterns of DNA marker distribution: We evaluated
the distribution of DNA markers across the sorghum in the deliberately enriched intervals plus the short ter-minal bins was 23, virtually identical to the average map by comparing intervals of exactly 10.0 cM in length,
starting from the top of each chromosome as drawn across the remainder of the genome (23.28); therefore elimination of these anomalous regions has no effect (Figure 1), except that the last interval in each group was
eitherⱕ15 cM orⱖ5 cM to accommodate the varying on the analyses.
Virtually every linkage group has at least one interval lengths of the linkage groups. On the basis of the total
number of loci per linkage group, the Poisson probabil- containing more loci than would be expected to occur by chance in 1% or fewer cases (A06-7; B01 and B08; ity distribution function was applied to identify intervals
that contained significant excesses or deficiencies of C02, -04, and -08; D02 and D04-07; E05; F06-8; G04 and G06-7; H04-05; I06; and J04 and -06).
various classes of probes. We note that two regions (C04
and D04-07) were preferentially enriched for markers Significant marker deficiencies were associated with 13 intervals, including A01*, A02; B10 and B12*; C06, because they contain genes that we seek to clone [C04,
the sorghumSh1gene regulating shattering of the ma- C07, and C12*; F01*, F05, F11, and F13*; G09; and H02. These included a disproportionately large number, 5 ture inflorescence (Paterson et al.1995b); and
375 Sorghum STS Map for Comparative Genomics
Figure1.—Continued.
length of three terminal intervals (B12⫽5.8 cM; C12⫽ clone-derived loci over the intervals were closely corre-lated (r⫽ 0.79).
7.5 cM; F13⫽8.7 cM) contributed partly to their marker
376 J. E. Bowerset al.
Figure1.—Continued.
loci showed dominant inheritance, segregating as pres- dominant loci (nominally below the average of 2.7). By far the largest concentration of SP-derived dominant ence of an allele from one parent and absence from
the other parent. A total of 395 (15.7%) of the dominant loci (23, 8.6%) was in interval H05—while this interval is generally marker rich, the number of SP-derived dom-alleles were from SB and 269 (10.7%) from SP, a highly
significant difference (2⫽23.9, 1 d.f.,P⬍1.1⫻10⫺6). inants in this interval isⵑ50% higher than the number
of SB-derived dominants (15), the opposite of their Distribution of dominant loci is shown in Figures 1
and 3. 50% lower abundance elsewhere in the genome. Several
other intervals are also preferentially enriched for domi-Among the 395 SB-derived dominant loci, 74 (18.7%)
are in the single 10-cM interval C05, far beyond the nant loci from one parent or the other: F07 contains an abundance of 9 (Pⱕ 0.0009) SP-derived dominant random expectation (⬎8 loci would have been expected
377 Sorghum STS Map for Comparative Genomics
Figure1.—Continued.
0.0013)vs.only 1 SP-derived dominant (Pⱕ0.25) and numbers) we were able to identify 130 simple sequence repeat (SSR)-containing sequences (defining an SSR as I09 contains an abundance of 7 (Pⱕ0.0009) SP-derived
dominants,vs.1 SB-derived dominant (P ⱕ0.29). 6 or more repeats of a dinucleotide or repeats stretching 15 or more base pairs of longer repeat units). Although Even after removing the dominant probes mapping
to interval C04 of LG C, a significant excess ofS. bicolor- the distributions of genomic and cDNA clone-derived loci were closely correlated (r ⫽ 0.79), the genomic derived dominant markers (321,vs. 267S. propinquum
dominants, significant at the 5% level) still remains. distribution of the SSRs was only loosely related to that of the entire population of mapped DNA probes (r⫽ Curiously, this excess is explained almost completely by
one marker class, the pSB probes, which were derived 0.33), suggesting that SSRs may locate in different ge-nomic domains more frequently than low-copy probes. fromS. bicolorhypomethylated (PstI-digested) genomic
DNA. The pSB clones detected 152S. bicolordominants The relationship between SSR distribution and probe distribution was somewhat closer (r⫽0.43) after remov-and 102S. propinquumdominants (exclusive of probes
mapping to LG C05). After removing the pSB clones, ing the strong biases in distribution of dominant loci, partly attributable to possible genomic rearrangements there remains a nonsignificant difference of 169S.
bi-color dominants vs. 165 S. propinquum dominants for (see below). The map location of SSR-containing clones is shown in Figure 1. Further characterization of a subset non-pSB probes outside of interval C05.
Simple sequence repeat-containing loci:On the basis of the SSRs has been described (Schlosset al.2002).
Distribution of duplicate loci:Among the 2050 probes
of the sequences of 1933 probes (see http://www.plant
378 J. E. Bowerset al.
Figure1.—Continued.
multiple loci that could be mapped, with 279 detecting 2 act loci involved. On the basis of a chi-square contin-gency test, the distribution of duplicate loci over pairs loci, 58 detecting 3 loci, 13 detecting 4 loci, 6 detecting
5 loci, and 1 detecting 6 loci. The distribution of dupli- of linkage groups was not random (2 ⫽ 224.06, with
81 d.f.). Several pairs of linkage groups showed striking cated loci across the genome is illustrated in Figure 4,
composed of 606 data points (keeping in mind that excesses of duplicated loci (A and G, C and G, C and H, E and H, E and I). Associations of individual linkage 2-locus probes generate 1 point of intersection, 3-locus
probes generate 3 points, 4-locus probes generate 6 groups with multiple partners (for example G with A and C), together with our prior observations (
Chitten-points, 5-locus probes generate 10 Chitten-points, and 6-locus
probes generate 15 points). A clickable web-based ver- denet al.1994) and other work (Whitkuset al.1992;
GautandDoebley 1997;Gaut2001), suggest that if sion of this figure is available at http://www.genetics.
379 Sorghum STS Map for Comparative Genomics
Figure1.—Continued.
the polyploidization event must be very ancient, surely spondence with 0, 1, 2, or 3 other intervals in the ge-nome. A total of 74 duplicate loci are intrachromoso-predating the Sorghum-Zea divergence. Therefore we
reevaluated the data on the basis of smaller intervals, mal, not significantly different from the random expectation.
breaking each sorghum chromosome into four
“inter-vals” of equal length in centimorgans. This yielded an Correspondence to gene arrangements in other taxa:
Table 2 summarizes the sources of clones and loci that overall contingency chi-square of 2287.53 (with 1521
d.f., P ⬍ 7 ⫻ 10⫺33), further supporting the notion have been mapped to date, illustrating the
opportuni-ties to use this map as a basis for comparisons of many that duplicated loci are not randomly distributed across
chromosome pairs. Among the 820 possible comparisons Poaceae taxa.
As an especially important example of the utilization (including intrainterval comparison), a total of 22 pairs
(2.7%) of intervals shown in Table 2 showed positive of these data, Figure 5 illustrates comparative alignments of the sorghum and maize genomes based on 952 loci deviations from the random expectation that were
sig-nificant at 0.005 (as measured by 1 d.f. chi-square), from the maize “bins” map (Gardineret al.1993;Davis
et al.1999). A clickable version of Figure 5 is available about 5.4 times higher than the random expectation.
380 J. E. Bowerset al.
Figure2.—Summary of recombinational in-terference. The frequencies of adjacent crossovers (two crossovers occurring on different chromo-somes within the same individual) and double crossovers (occurring on the same chromosome in the same individual) are plottedvs.the dis-tance between the crossovers.
the specific probes and loci involved. This comparison 136 different functional molecular groups. The most common molecular functional groups were “ATP bind-represents a considerable increase over previously
pub-lished data (Whitkuset al. 1992; Pereira et al.1994; ing” (120 hits) and “Protein Kinase” (56 hits). Results of sequence similarity analyses are available at http://
Ragabet al. 1994;Patersonet al.1995a;Dufouret al.
1996). The distributions of loci over the 100 possible www.genetics.org/supplemental/. combinations of maize chromosomes and sorghum
link-age groups were clearly not random (contingency2⫽
DISCUSSION 790.04, with 81 d.f., P ⬍ 9 ⫻ 10⫺117). A total of 19
(19%) cells with the largest excesses (from 7.5 to 36.6) This genetically anchored set of sequence-tagged sites provides transferable DNA markers suitable for a wide of observed data over random expectations account for
520 (55%) of the corresponding points and 74% (582.84) range of investigations in structural, functional, and evo-lutionary genomics in several major grain and biomass of the chi-square deviation from randomness,
sug-gesting the correspondences illustrated in Figure 5 and crops. Although the map was created using the RFLP method and has been applied to several goals by this listed in Table 3.
Marker sequence annotation: Multiple local align- technology (e.g.,Linet al.1995;Patersonet al.1995a,b;
Katsaret al.2002;Minget al.2002), genetically mapped ment searches using the programs blastn and tblastx
were used for sequence annotation against publicly sequence tagged sites such as these can be used to dis-cover single-nucleotide or small insertion/deletion poly-available databases of the NCBI as of November 21,
2002. The default matrix BLOSUM 62 and a cutoff of morphisms that can then be genotyped by many alterna-tive technologies. This possibility increases the value of 1⫻ 10⫺6 were used in all BLAST searches. The NCBI
database was subdivided into several taxon-specific groups these loci and reduces the costs associated with their wider utilization. A total of 130 loci that contain simple-to allow for the efficient determination of not only the
best overall hit, but also the best hit among closely sequence repeats have the further advantage of being relatively allele rich (Schlosset al.2002), a benefit in related species, excluding unannotated expressed
se-quence tag and genomic survey sese-quence database en- studies that require differentiation between closely re-lated genotypes.
tries. Additional analyses included the use of hidden
Markov models to classify sequence data by protein se- This framework of genetically anchored sequence-tagged sites will also provide a foundation for physical quence signature. The program InterProScan (
Zdob-novandApweiler2001) was used to search to compare mapping and ultimately assembling a robust finished se-quence of the sorghum genome. The present map per-the translated sorghum sequences against several protein
databases (Pfam, SMART, and ProDom) and Genome mits us to assign loci to bins of ⵑ0.77 cM; on average, this representsⵑ300 kb of genomic DNA based on a Ontology (Ashburneret al.2000) numbers for each of
these classifications were obtained. The results of these consensus genome size estimate of 750 Mbp (although we have recently estimated the genome to be somewhat analyses revealed that the 578 sorghum query sequences
differ-381 Sorghum STS Map for Comparative Genomics
Figure 3.—Distribution of codominant and dominant markers along the sorghum map. For 10-cM intervals along each linkage group, the num-bers of codominant (solid), S. bicolor dominant (open), and S. propinquum dominant (shaded) loci are plotted.
ent loci within 0.77-cM bins, we are presently hybridizing less evenly distributed through the genome. By simply hybridizing the 2050 mapped probes to the 10⫻ -cover-the genetically mapped probes to BAC libraries for both
S. propinquumandS. bicolor. Since the two BAC libraries age BAC libraries, we expect to identifyⵑ20,000 BACs in each library, comprisingⵑ50% of the genome. Fur-each provideⵑ10⫻ coverage of the genome and are
composed of individual BACs that averageⵑ120 kb in ther, both libraries have been fingerprinted (http://www. genome.arizona.edu/fpc/sorghum/), permitting the re-length, this will permit us to resolve the order of closely
382 J. E. Bowerset al.
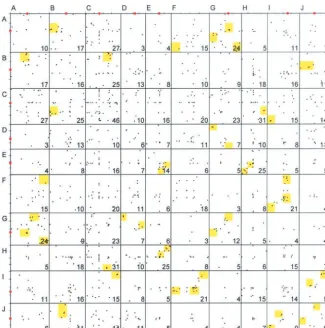
Figure4.—Patterns of duplication within the sorghum genome. In this Oxford grid, each dot represents a genetically mapped locus detected by probe that segregated at two or more polymorphic loci in sorghum, with thex- andy-axis representing chromo-somal locations. Red circles along the axes represent the approximate locations of the centromeres. The total number of probes mapping to each pair of sorghum linkage groups is shown in each cell. Areas high-lighted in yellow represent regions of sig-nificant marker abundance between a pair of linkage groups (determined as described in text). Note that some dots represent mul-tiple probes with the same genetic loca-tions; for a detailed list of exact information for each cell, see http://www.genetics.org/ supplemental/.
proaches made possible by the alignment of our geneti- mapping of the locations of the sorghum centromeres is in progress by probing synaptonemal complex spreads cally mapped sequences to the nearly completed rice
sequence, a robust genetically anchored physical map with genetically mapped probes or their correspond-ing BACs by fluorescence in situ hybridization (D. G. is expected to coalesce.
Nonrandom patterns of DNA marker distribution Petersonand A. H.Paterson, unpublished data). Clearly, more information will be needed to explain provide clues to the locations of interesting and
impor-tant features of sorghum genome organization. On most the multiple, dispersed marker-dense regions found on several linkage groups. For example, linkage group B chromosomes, at least one significant concentration of
loci appears to correspond to the centromeric region. has one terminal concentration of markers and another interstitial concentration. We have recently shown that We have recently applied overgo (Caiet al.1998) probes
for sorghum centromeric repetitive sequences homolo- some sorghum chromosomes have cytologically distin-guishable knobs (D. G.Petersonand A. H.Paterson, gous to pHind22 and Cen38 (Milleret al.1998;Zwick
et al. 2000) to the SP and SB BAC libraries. Co- unpublished observations), and future studies will inves-hybridization of these probes with genetically mapped
RFLPs has associated concentrations of centromeric
re-TABLE 2 peats with marker-dense regions of 8 of the 10 linkage
groups (LG A: DM064, cM57.7; B: DM007, cM57.7; C: Summary of probe sources
pSB1406, cM47.7; D: pSB580, cM47.7 and pRC162, cM60;
Genomic cDNA Total
E: CSU0462 and pRC182, cM47; G: R2447, cM64.6; I: 5C04A07, cM69.3; and J: pSB0019, cM50.8). Due to the
Arabidopsis 0 52 52
repetitive nature of these probes and the possibility that Zea 62 189 251
not all copies are centromeric, these data can be taken Triticeaea 0 65 65
only as tentative indications of the possible locations of Pennisetum 23 171 194
Oryza 10 175 185
the sorghum centromeres. For example, on two linkage
Sorghum 725 464 1189
groups we found associations with mapped probes in
Saccharum 11 103 114
regions of normal marker density (LG A: pSB1075,
TOTAL 831 1219 2050
cM98.5; LG H: HHU49, cM68.5). Further, we found no
aTriticum, Hordeum, or Avena.
383 Sorghum STS Map for Comparative Genomics
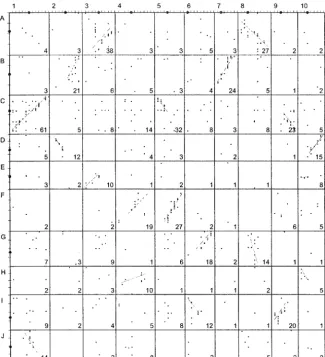
Figure 5.—Patterns of colinearity be-tween sorghum and maize. In this Oxford grid, each dot represents a locus detected by a probe that was genetically mapped in both sorghum (left) and maize (top), with thex- andy-axis representing chromosomal locations in each taxon. The total number of probes mapping to each pair of maize and sorghum chromosomes is shown in each cell. Lines highlight the regions for which we have inferred synteny between maize and sorghum, as summarized in Ta-ble 3. Note that some dots represent mul-tiple probes with the same genetic loca-tions; for a detailed list of exact information for each cell, see http://www.genetics.org/ supplemental/.
tigate whether these could account for some marker near the interval (H05) that contained by far the largest concentration of SP-derived dominant loci (23, 8.6%). excesses or deficiencies. Linkage groups C, D, G, and J
also show multimodal distributions of marker density This suggests that the ribosomal DNA and a large flank-ing area may have moved in one of the two sorghums that warrant further study.
Differences in the abundance of dominant genetic since their divergence from a common ancestor, a hy-pothesis that we are further investigating (D. G.
Peter-marker loci appear to suggest that a chromosome struc-tural rearrangement has occurred since the divergence ofS. bicolorandS. propinquumfrom a common ancestor.
TABLE 3 The single 10-cM interval C05 contains 74 (18.7%) of
Correspondence of maize chromosomes to sorghum the 395 SB-derived dominant loci found, far beyond the
linkage groups random expectation (see above), and 71 of these
coseg-regate at the single location cM 46.2 (along with 6
co-Maize chromosome Sorghum linkage group(s)a
dominants, and one locus dominant for the SP allele).
Curiously, this interval is also the apex of the most pro- 1 C, J, C
nounced segregation distortion found (41:17:2, fa- 2 B, D
3 E, A
voring bicolor homozygotes as described above). The
4 J, F, H
DNA sequences of some of the probes that detect
5 C, F
S. bicolor-dominant markers at LG C, cM 46.2 correspond
6 I, G
to various portions of the ribosomal DNA [specifically
7 B
AEST602 matches 18s rRNA (GenBank accession no. 8 A, G, A
X16077) at e ⬍ 10⫺200 and C152 and pRC017 match
9 I, G
the 25S ribosomal RNA gene (GenBank accession nos. 10 E, D
M11585 and AY108843) ate⫽10⫺170ande⫽4⫻10⫺71,
aProceeding from left to right along the maize
chromo-respectively]. some as drawn in Figure 5. For identities of specific loci, see
These three probes also mapped as dominant markers supplementary documentation at http://www.genetics.org/ supplemental/.
384 J. E. Bowerset al.
son, J. E. Bowers and A. H.Paterson, unpublished relationship with any of the factors studied herein. Cor-relations of allelic diversity with total mapped locus data) and that is consistent with recent findings in rice
(Shishidoet al.2000) and legumes (Singhet al.2001). abundance per interval (0.0006), codominant locus abundance (⫺0.038), and SSR abundance (⫺0.16) were On the basis of genotypes inferred from segregation at
nearby codominant loci, all 435 plants that have been remarkable in the lack of information they yielded. An important future investigation will be to study how studied to date from this cross (including those from a
larger population used for mapping QTL; e.g., Lin et marker density and/or allelic diversity correlate with the distributions of phenotypically significant variants al. 1995; Paterson et al. 1995a) possess at least one
copy of the ribosomal DNA on either LG C or LG H. such as QTL.
By virtue of a very high level of DNA polymorphism These results are consistent with a requirement for a
copy of ribosomal DNA for survival of gametes. We have (Chittendenet al.1994), the SB⫻SP cross has proven especially facile for “comparative mapping” of DNA also noticed some degree of enrichment of the two
affected genomic intervals for QTL that differentiate clones that have been previously mapped in other taxa. To foster opportunities to use the relatively small ge-between SB and SP [specifically for the number of
seed-ling tillers and regrowth on H05 (Patersonet al.1995b) nome of sorghum to help advance genomics in the larger genomes of many other tropical Poaceae, we have and for the number of seedling tillers, three measures
of rhizomatousness, and seed weight on C04 (Paterson mapped 865 heterologous DNA clones from eight other taxa (Table 2). In one example, we show herein the et al. 1995a,b)].
The finding that manyS. bicolorhypomethylated (PstI- alignment of the sorghum genome to the four times physically larger genome of maize. Most maize chromo-digested) genomic probes lacked a homolog inS.
propin-quum suggests that there has been considerable and somes correspond to nonoverlapping regions of only one sorghum chromosome but most sorghum chromo-rapid divergence or deletion of low-copy DNA in these
taxa. In contrast to cDNAs and excepting the probes somes correspond to nonoverlapping regions of two maize chromosomes, reiterating the recent duplication mapping near the ribosomal DNA discussed above, a
total of 728 pSB probes detect 152 dominant loci that in maize. Sorghum is an especially valuable guide for genomic analysis of Saccharum [sugarcane, one of the lack anS. propinquum allelevs. only 102 loci that lack
anS. bicolorallele, a highly significant difference. This world’s most important crops, with the 2001/2002 world cane sugar crop forecast at a near record 126.8 million suggests that a portion of the sorghum genome may be
composed of rapidly evolving low-copy DNA, such as metric tons (FAS 2001)], which may have shared a com-mon ancestor as recently as 5 million years ago (Sobral
has been reported for tomato (Zamir and Tanksley
1988). However, this portion of the sorghum genome et al.1994). The present data supplement and comple-ment our prior efforts in this regard (Minget al.1998, is likely to be relatively smaller in sorghum than in
tomato, as Cot analysis shows that sorghum has a much 2002). Other work in progress uses probes described herein (Table 3) together with species-specific recombi-smaller low-copy DNA fraction (Petersonet al.2002).
Finally, we note that the lack of an RFLP allele at a nation data to address the comparative organization of sorghum and other tropical grasses including Penni-dominant locus does not necessarily reflect deletion of
the locus, but could be attributable to comigration with setum (R.Jessup, M.Husseyand A. H.Paterson, per-sonal communication), Cynodon (C.Bethel, E.Sciara
monomorphic loci, gain/loss of restriction sites creating
short or long fragments that are not captured on South- and A. H.Paterson, personal communication), Echi-nochloa (T.Fukao, A. H.Patersonand M.Rumpho, ern blots, or other artifactual reasons, which presumably
account for many of the 102S. bicolorloci that are null unpublished data), and Panicum (A.Missaoui, A. H.
Patersonand J.Bouton, personal communication). for theseS. bicolor-derived probes.
The genomic distribution of mapped (i.e., polymor- Despite the clear value of the comparative approach for fostering progress in study of gene arrangement in phic in SB⫻SP) loci shows little relationship to
differ-ences in levels of intraspecific allelic diversity in differ- complex genomes (e.g., Saccharum) or underexplored taxa (e.g., Pennisetum, Cynodon, Echinochloa, and Pan-ent chromosomal regions (Dvoraket al.1998;Hamblin
andAquadro1999). In a separate study (P.Morrell, icum), it is equally important to note that a remarkable 45% of comparative data fell in regions other than those J. E.Bowersand A. H.Paterson, personal
communica-tion), we have shown that allelic diversity is not randomly we infer to correspond between sorghum and maize. Many of these incongruities are likely to reflect nonchro-distributed across the sorghum chromosomes but is
highly structured. For 183 loci representing most of the mosomal rearrangement mechanisms that are becom-ing clear from microsynteny studies (Tikhonov et al. 10-cM bins in this study, we have estimated allelic
rich-ness (not shown) from a worldwide sample of 55 land- 2000) and studies of ancient duplication (Bennetzen
2000; Paterson et al. 2000) or, possibly, rapid diver-race and wild accessions representing the breadth of
diversity in the Sorghum genus (P. J.Morrelland A. H. gence or deletion of hypomethylated DNA as we report above. A few tantalizing hints of the possibility of more
Paterson, personal communication)—curiously, these
385 Sorghum STS Map for Comparative Genomics
An anchored framework BAC map of mouse chromosome 11
locus arrangements in several regions (e.g., maize chr.
assembled using multiplex oligonucleotide hybridization.
Geno-1/sorghum LG A), but await more data to test with mics54:387–397.
confidence. One sorghum linkage group (H) that is Boivin, K., M. Deu, J. F. Rami, G. TroucheandP. L. Hamon, 1999 Towards a saturated sorghum map using RFLP and AFLP
mark-well populated with DNA markers (Table 1) shows
re-ers. Theor. Appl. Genet.98:320–328.
markably little correspondence to any maize chromo- Chittenden, L. M., K. F. Schertz, Y. R. Lin, R. A. WingandA. H. some ( just a small portion of maize chromosome 4). Paterson, 1994 A detailed RFLP map of Sorghum bicolor ⫻ S. propinquum, suitable for high-density mapping, suggests
ances-This hints at the possibility that large segments of
chro-tral duplication of sorghum chromosomes or chromosomal
seg-matin may have been lost during the maize-sorghum ments. Theor. Appl. Genet.87:925–933.
divergence; however, a conclusive test awaits more data. Davis, G. L., M. D. McMullen, C. Baysdorfer, T. Musket, D. Grant
et al., 1999 A maize map standard with sequenced core markers,
While our results clearly reinforce the evidence in
grass genome reference points and 932 expressed sequence
support of the duplication of most regions of the maize tagged sites (ESTs) in a 1736-locus map. Genetics152:1137–1172. genome, many questions remain about the levels, pat- Dewet, J. M. J., S. C. Gupta, J. R. HarlanandC. O. Grassl, 1976 Cytogenetics of introgression from Saccharum into Sorghum.
terns, and antiquity of chromatin duplication within
Crop Science16:568–572.
sorghum itself. The patterns of distribution of duplicate
Draye, X., Y.-R.Lin, X. Y. Qian, J. E.Bowers, G. B.Burowet al.,
loci in sorghum are clearly not random, with many small 2001 Toward integration of comparative genetic, physical, di-versity, and cytomolecular maps for grasses and grains, using the
islands of colinearity evident, and adjacent intervals
of-Sorghumgenome as a foundation. Plant Physiol.125:1325–1341.
ten showing correspondence to syntenic intervals (A2,
Dufour, P., L. Grivet, A. Dhont, M. Deu, G. Troucheet al., 1996
-3, and -4 to G3, -1, and -4; E3-4 to H2-1; F3-4 to I3, I1; Comparative genetic mapping between duplicated segments on
maize chromosomes 3 and 8 and homoeologous regions in
sor-J2, -4 to I2-1). However, forⵑ30% of the genome we
ghum and sugarcane. Theor. Appl. Genet.92:1024–1030.
can discern no corresponding duplicated region, and
Dufour, P., M. Deu, L. Grivet, A. Dhont, F. Pauletet al., 1997
another 30% shows correspondence to two or more un- Construction of a composite sorghum genome map and
compari-son with sugarcane, a related complex polyploid. Theor. Appl.
linked regions. Duplication of sorghum chromatin
ap-Genet.94:409–418.
pears to more closely resemble the pattern observed for
Dvorak, J., M. C. LuoandZ. L. Yang, 1998 Restriction fragment
rice, in which the completed sequence (Goffet al.2002; length polymorphism and divergence in the genomic regions of
Yuet al.2002) has largely borne out early hints (Kishi- high and low recombination in self-fertilizing and cross-fertilizing
Aegilopsspecies. Genetics148:423–434.
moto et al. 1994; Nagamura et al. 1995) of ancient
FAS, 2001 World sugar situation. U.S. Department of Agriculture,
For-segmental duplication in some regions. The correspon- eign Agricultural Service (http://www.fas.usda.gov/htp/sugar/ dence of some sorghum genomic intervals to two or 2001/nov/sugsit.htm).
Gardiner, J. M., E. H. Coe, S. Melia-Hancock, D. A. Hosington
more unlinked intervals may reflect either very localized
andS. Chao, 1993 Development of a core RFLP map in maize
colinearity or, possibly, recent duplications superim- using an immortalized-F
2population. Genetics134:917–930.
posed on ancient ones, which may be present in maize Gaut, B. S., 2001 Patterns of chromosomal duplication in maize and their implications for comparative maps of the grasses.
Ge-as we speculate above. Much more data will be needed
nome Res.11:55–66.
to unravel the details of the relationship(s) between Gaut, B. S., andJ. F. Doebley, 1997 DNA sequence evidence for individual duplicated segments in sorghum, as well as the segmental allotetraploid origin of Maize. Proc. Natl. Acad.
Sci. USA94:6809–6814.
their relationships (if any) to those in close relatives
Goff, S. A., D. Ricke, T. H. Lan, G. Presting, R. L. Wanget al.,
such as sugarcane and maize or distant relatives such 2002 A draft sequence of the rice genome (Oryza sativaL. ssp
as rice or even Arabidopsis. japonica). Science296:92–100.
Hamblin, M. T., andC. F. Aquadro, 1999 DNA sequence variation We honor the memory of coauthor Keith F. Schertz, who made
and the recombinational landscape inDrosophila pseudoobscura: many of these discoveries possible while teaching several of us about a study of the second chromosome. Genetics153:859–869. sorghum and about much more. Science is richer for his efforts, and Haussmann, B. I. G., D. E. Hess, N. Seetharama, H. G. Welzand we are poorer for his passing. We thank the USDA-National Research H. H. Geiger, 2002 Construction of a combined sorghum link-Initiative, National Science Foundation Plant Genome Research Pro- age map from two recombinant inbred populations using AFLP, SSR, RFLP, and RAPD markers, and comparison with other sor-gram, International Consortium for Sugarcane Biotechnology, and U.S.
ghum maps. Theor. Appl. Genet.105:629–637. Golf Association for financial support of various aspects of this work.
Katsar, C. S., A. H. Paterson, G. L. TeetesandG. C. Peterson, 2002 Molecular analysis of Sorghum resistance to the greenbug (Homoptera: Aphididae). J. Econ. Entomol.95:448–457.
Kishimoto, N., H. Higo, K. Abe, S. Arai, A. Saitoet al., 1994 Identi-LITERATURE CITED fication of the duplicated segments in rice chromosomes 1 and
5 by linkage analysis of cDNA markers of known functions. Theor.
Annen, F., J. L. Chang, A. H. PatersonandJ. L. Stockhaus, 1998
Appl. Genet.88:722–726. Characterization of 14 different putative protein kinase cDNA
Kosambi, D., 1944 The estimation of map distance from recombina-clones of the C-4 plant Sorghum bicolor.Mol. Gen. Genet.259:
tion values. Ann. Eugen.12:172–175. 115–122.
Lander, E., J. Abrahamson, A. Barlow, M. Daly, S. Lincolnet al.,
Arumuganathan, K., andE. Earle, 1991 Nuclear DNA content of
1987 Mapmaker: a computer package for constructing genetic-some important plant species. Plant Mol. Biol. Rep.9:208–218.
linkage maps. Genomics1:174–181.
Ashburner, M., C. A. Ball, J. A. Blake, D. Botstein, H. Butleret
Lin, Y., K. SchertzandA. Paterson, 1995 Comparative analysis
al., 2000 Gene ontology: tool for the unification of biology. Nat.
of QTLs affecting plant height and maturity across the Poaceae, Genet.25:25–29.
in reference to an interspecific sorghum population. Genetics
Bennetzen, J. L., 2000 Comparative sequence analysis of plant
nu-141:391–411. clear genomes: microcolinearity and its many exceptions. Plant
Lin, Y., L. Zhu, S. Ren, J. Yang, K. Schertzet al., 1999 ASorghum
Cell12:1021–1029.
386 J. E. Bowerset al.
with loss-of-function mutations during crop domestication. Mol. Bowerset al., 2002 Characterization of RFLP probe sequences for gene discovery and SSR development inSorghum bicolor(L.) Breed.5:511–520.
Moench. Theor. Appl. Genet.105:912–920.
Linder, H. P., 1987 The evolutionary history of the
Poales/Res-Shishido, R., Y. Sano andK. Fukui, 2000 Ribosomal DNAs: an tionales—a hypothesis. Kew Bull.42:297–318.
exception to the conservation of gene order in rice genomes.
McWhorter, C. G., 1971 Introduction and spread of Johnsongrass
Mol. Gen. Genet.263:586–591. in United States. Weed Sci.19:496.
Singh, R. J., H. H. Kim andT. Hymowitz, 2001 Distribution of
Menz, M. A., R. R. Klein, J. E. Mullet, J. A. Obert, N. C. Unruh
rDNA loci in the genus Glycine Willd. Theor. Appl. Genet.103: et al., 2002 A high-density genetic map ofSorghum bicolor(L.)
212–218. Moench based on 2926 AFLP (R), RFLP and SSR markers. Plant
Smith, C. W., andR. A. Frederiksen, 2000 Sorghum: Origin, History,
Mol. Biol.48:483–499.
Technology and Production.John Wiley & Sons, New York.
Miller, J. T., F. G. Dong, S. A. Jackson, J. SongandJ. M. Jiang,
Sobral, B. W. S., D. P. V. Braga, E. S. LahoodandP. Keim, 1994 1998 Retrotransposon-related DNA sequences in the
centro-Phylogenetic analysis of chloroplast restriction enzyme site muta-meres of grass chromosomes. Genetics150:1615–1623.
tions in the Saccharinae Griseb subtribe of the Andropogoneae
Ming, R., S. Liu, Y. Lin, J. Dasilva, W. Wilsonet al., 1998 Alignment
Dumort tribe. Theor. Appl. Genet.87:843–853. of the Sorghum andSaccharumchromosomes: comparative
ge-Subudhi, P. K., andH. T. Nguyen, 2000 Linkage group alignment nome organization and evolution of a polysomic polyploid genus
of sorghum RFLP maps using a RIL mapping population. Ge-and its diploid cousin. Genetics150:1663–1682. nome43:240–249.
Ming, R., S. C. Liu, J. E. Bowers, P. H. Moore, J. E. Irvineet al., Thomasson, J. R., 1987 Fossil grasses, 1820–1986 and beyond, pp. 2002 Construction of aSaccharumconsensus genetic map from 159–167 inGrass Systematics and Evolution, edited by T. R. Soders-two interspecific crosses. Crop Sci.42:570–583. trom, K. W.Hilu, C. S.Campbelland M. E.Barkworth.
Smith-Nagamura, Y., T. Inoue, B. Antonio, T. Shimano, H. Kajiyaet al., sonian Institution Press, Washington, DC.
1995 Conservation of duplicated segments between rice chro- Tikhonov, A. P., J. L. BennetzenandZ. V. Avramova, 2000 Struc-mosomes 11 and 12. Breed. Sci.45:373–376. tural domains and matrix attachment regions along colinear
chro-Paterson, A., Y. Lin, Z. Li, K. Schertz, J. Doebley et al., 1995a mosomal segments of maize and sorghum. Plant Cell12:249–264. Convergent domestication of cereal crops by independent muta- Whitkus, R., J. DoebleyandM. Lee, 1992 Comparative genome tions at corresponding genetic loci. Science269:1714–1718. mapping of sorghum and maize. Genetics132:1119–1130.
Paterson, A., K. Schertz, Y. Lin, S. LiuandY. Chang, 1995b The Wyrich, R., U. Dressen, S. Brockmann, M. Streubel, C. Changet
weediness of wild plants: molecular analysis of genes influencing al., 1998 The molecular basis of C-4 photosynthesis in sorghum: dispersal and persistence of johnsongrass,Sorghum halepense(L.) isolation, characterization and RFLP mapping of mesophyll- and Pers. Proc. Natl. Acad. Sci. USA92:6127–6131. bundle-sheath-specific cDNAs obtained by differential screening.
Plant Mol. Biol.37:319–335.
Paterson, A., J. Bowers, M. Burow, X. Draye, C. Elsiket al., 2000
Xu, G. W., C. W. Magill, K. F. SchertzandG. E. Hart, 1994 A Comparative genomics of plant chromosomes. Plant Cell12:
RFLP linkage map ofSorghum bicolor(L) Moench. Theor. Appl. 1523–1539.
Genet.89:139–145.
Peng, Y., K. F. Schertz, S. CartinhourandG. E. Hart, 1999
Com-Yu, J., S. N. Hu, J. Wang, G. K. S. Wong, S. G. Liet al., 2002 A draft parative genome mapping of Sorghum bicolor (L.) Moench using
sequence of the rice genome (Oryza sativaL. ssp indica). Science an RFLP map constructed in a population of recombinant inbred
296:79–92. lines. Plant Breed.118:225–235.
Zamir, D., andS. Tanksley, 1988 Tomato genome is comprised
Pereira, M. G., M. Lee, P. Bramel-Cox, W. Woodman, J. Doebley
largely of fast-evolving, low copy-number sequences. Mol. Gen.
et al., 1994 Construction of an RFLP map in sorghum and
com-Genet.213:254–261. parative mapping in maize. Genome37:236–243.
Zdobnov, E. M., andR. Apweiler, 2001 InterProScan—an
integra-Peterson, D. G., S. R. Schulze, E. B. Sciara, S. A. Lee, J. E. Bowers tion platform for the signature-recognition methods in InterPro.
et al., 2002 Integration of Cot analysis, DNA cloning, and
high-Bioinformatics17:847–848.
throughput sequencing facilitates genome characterization and Zwick, M. S., M. N. Islam-Faridi, H. B. Zhang, G. L. Hodnett, M. I. gene discovery. Genome Res.12:795–807. Gomezet al., 2000 Distribution and sequence analysis of the
Ragab, R. A., S. Dronavalli, M. A. S. MaroofandY. G. L. Yu, 1994 centromere-associated repetitive element CEN38 ofSorghum bi-Construction of a sorghum RFLP linkage map using sorghum color(Poaceae). Am. J. Bot.87:1757–1764.
and maize DNA probes. Genome37:590–594.