DOI: 10.1534/genetics.105.048975
A Simple and Robust Statistical Test for Detecting the Presence
of Recombination
Trevor C. Bruen,*
,1Herve´ Philippe
†and David Bryant*
,‡*McGill Centre for Bioinformatics, McGill University, Montreal, Quebec H3A 2B4, Canada,†Program in Evolutionary Biology, Canadian Institute for Advanced Research, Centre Robert Cedergren, De´partement de Biochimie, Universite´ de Montre´al, Montreal,
Quebec H3T 1J4, Canada and‡Department of Mathematics, University of Auckland, Auckland, New Zealand Manuscript received July 30, 2005
Accepted for publication February 3, 2006
ABSTRACT
Recombination is a powerful evolutionary force that merges historically distinct genotypes. But the extent of recombination within many organisms is unknown, and even determining its presence within a set of homologous sequences is a difficult question. Here we develop a new statistic,Fw, that can be used to test for recombination. We show through simulation that our test can discriminate effectively between the presence and absence of recombination, even in diverse situations such as exponential growth (star-like topologies) and patterns of substitution rate correlation. A number of other tests, Maxx2, NSS, a
coalescent-based likelihood permutation test (from LDHat), and correlation of linkage disequilibrium (bothr2and
jD9j) with distance, all tend to underestimate the presence of recombination under strong population growth. Moreover, both Maxx2and NSS falsely infer the presence of recombination under a simple model
of mutation rate correlation. Results on empirical data show that our test can be used to detect recom-bination between closely as well as distantly related samples, regardless of the suspected rate of recombi-nation. The results suggest thatFwis one of the best approaches to distinguish recurrent mutation from recombination in a wide variety of circumstances.
R
ECOMBINATION is a fundamental biologicalprocess that can, for example, increase viral or bacterial pathogenicity by diffusing genetic material throughout populations (Awadalla 2003). The
bi-ological mechanisms of recombination differ across organisms, but in broad terms recombination results in the creation of mosaic sequences where the evolution-ary history at each site may be different. Violating this tree-like assumption of evolution can lead to serious consequences when performing phylogenetic analyses for a set of sequences. Indeed, as the evolution of the sequences cannot be described by a single tree, this can lead to overestimation or underestimation of branch lengths among other problems (Schierup and Hein
2000a,b; Posada2001; Posada and Crandall 2002).
Thus, an important question for a given set of aligned sequences is to determine whether or not recombina-tion is likely to have occurred.
The ability of a large number of general methods to detect recombination has recently been evaluated empirically and through simulation (Crandall and
Templeton 1999; Brown et al. 2001; Posada and
Crandall2001; Wiufet al.2001; Posada2002). These
studies have established that methods such as Geneconv
(Sawyer1989), Maxx2(MaynardSmith1992), RDP
(Martin andRybicki2000), Phypro (Weiller1998),
RecPars (Hein 1990, 1993), and neighbor similarity
score (NSS) ( Jakobsenand Easteal 1996) efficiently
detect recombination in a wide range of circumstances (Brownet al.2001; Posadaand Crandall2001; Wiuf et al.2001; Posada2002). These tests infer the presence
of recombination either directly through sequence comparisons or indirectly through phylogenetic means. As no underlying assumptions are made concerning the origin of the sequences, these tests can be applied to detect recombination within any set of aligned homol-ogous sequences. Indeed, these techniques can be used to detect recombination within either closely or dis-tantly related genotypes (Posada 2002). Moreover,
these methods can be termed general since no specific assumptions concerning sample history (beyond se-quence homology) are made.
In contrast to general methods for inferring recom-bination, there are also population-specific methods for detecting recombination, where the samples consist of genotypes from closely related individuals. Within a single population, recombination can be tested for us-ing nonparametric approaches such as permutation tests based on summary statistics like the correlation of linkage disequilibrium with distance (Miyashitaand
Langley1988; Schaefferand Miller1993; Awadalla et al.1999). Linkage disequilibrium is typically measured 1Corresponding author:McGill Centre for Bioinformatics, Duff Medical
Bldg., 3775 University St., Montreal, QC H3A 2B4, Canada. E-mail: [email protected]
using the statisticsr2and jD9j (Lewontin 1964; Hill
and Robertson1968).
Recently, coalescent (Kingman1982) methods have
been developed that can specifically detect (Brown et al.2001; McVeanet al.2002) or characterize the rate
of recombination (Griffiths and Marjoram 1996;
Heyand Wakeley 1997; Kuhneret al.2000; Nielsen
2000; Wall 2000; Fearnhead and Donnelly 2001;
Hudson2001; McVeanet al.2002) for a set of samples
within a single population. Recombination can be mod-eled under either a basic crossing-over model (Hudson
1983) or a more complex model of gene conversion (Wiufand Hein2000). Only a few methods (Kuhner et al.2000; Fearnheadand Donnelly 2001; McVean et al.2002) relax the infinite-sites model (Kimura1969)
under which a site can undergo at most a single muta-tion. Relaxing the infinite-sites model is important for many bacterial and viral data sets, since under the infinite-sites model, high levels of recurrent mutation can cause patterns consistent with recombination (McVeanet al.
2002).
The basic coalescent operates under several assump-tions that include constant population size, no selec-tion, random mating, and no population structure (Heinet al. 2005). Whereas these assumptions can be
relaxed using additional parameters such as a term for population growth (Slatkinand Hudson1991), these
additional parameters are presently not accounted for in current methods that characterize and detect re-combination (Kuhner et al. 2000; Fearnhead and
Donnelly2001; McVeanet al.2002). Importantly, the
influence of population structure and demographic history may adversely affect the ability of coalescent methods to correctly infer the rate of recombination (McVeanet al.2002; Haydonet al.2004).
The myriad of methods available to detect, charac-terize, and find recombinant sequences is somewhat bewildering. Traditionally, general approaches have been used for recombination analysis between distantly related genotypes, whereas population genetic-based approaches have been used for recombination analysis between closely related genotypes. However, in many cases the line between the approaches is blurred, and both approaches have been used to infer the presence of recombination in bacteria, viral, and animal mito-chondrial data sets (McVeanet al.2002; Posada2002;
Piganeauet al.2004).
Often, one of the primary questions for any data anal-ysis is to determine whether recombination is likely to be present within a set of sequences at all (Awadallaet al.
1999; Maynard Smith and Smith 2002; McVean et al.2002; Posada2002; Piganeauet al.2004; Tsaousis et al.2005). Indeed, there are still open questions with regard to the extent of recombination in animal mito-chondrial DNA (Maynard Smith and Smith 2002;
Piganeauet al.2004; Tsaousiset al.2005). Moreover, if
the sequences are obtained from closely related, yet
distinct, organisms or from many different populations, it is inappropriate to analyze the sequences in a frame-work that assumes a single population, such as linkage disequilibrium or coalescent approaches (Tsaousis et al. 2005). But determining whether recombination has occurred in such circumstances is an important question that cannot be easily answered in a parametric framework. A robust nonparametric test for recombi-nation can help distinguish between the presence and absence of recombination in such cases.
Testing for recombination can statistically validate visual evidence of recombination obtained using, for instance, phylogenetic network approaches (e.g., Huson
and Bryant2006) or independently verify the presence
of recombination if a positive estimate of the rate of recombination is inferred (e.g., McVean et al. 2002).
Moreover, it is often difficult to distinguish between rate heterogeneity and recombination in many circumstances (Grassly and Holmes 1997; McGuire and Wright
2000) and thus regions that exhibit phylogenetic in-consistencies can be individually tested for recombina-tion. Additionally, testing for recombination can be used as a prior probability for the presence of recombination when inferring the points at which infrequent recom-bination may have occurred (Mininet al.2005). In this
sense, testing for recombination can be used in con-junction with other methods.
Ideally, a single test could correctly determine whether recombination is present within any given set of aligned sequences, regardless of population history, demo-graphic history, recombination rate, or mutation rate. Preferably, such a test would also minimize the pro-duction of false positives. Here we develop a new test that is powerful under many of these different situations and produces few false positives. Through simulation and empirical data analysis we characterize the perfor-mance of our test under various rates of recombination, rates of mutation, demographic histories, and sample sizes. We also show through simulation that a simple model of substitution rate autocorrelation (consistent with mutational ‘‘hot spots’’) gives rise to a signal similar to recombination for two different general tests, Maxx2
and NSS, but not for our method.
METHODS
Tests for recombination based on the principle of compatibility have proved to be among the most power-ful (Brown et al. 2001; Posadaand Crandall 2001;
Wiufet al.2001; Posada2002). The traditional binary
notion of compatibility (LeQuesne1969) is well suited
for sites with at most two alleles, but can be directly extended into a broader notion (Penny and Hendy
1986) that we term here as refined incompatibility. We then develop a new statistic to test for recombination, theFw- (or pairwise homoplasy index, PHI) statistic that
Compatibility and incompatibility: It is not obvious how to determine the genealogical history of a single site. As such, the pattern of mutation present at multiple sites must be used to infer the genealogy of the sample as a whole. One possibility is to use the observed pat-terns at pairs of sites, in particular the notion of com-patibility (LeQuesne1969) or the ‘‘four-gametes’’ test
(Hudson and Kaplan 1985). Two sites i and j are
compatible if and only if there is a genealogical history that can be inferred parsimoniously that does not involve any recurrent or convergent mutations (known as homoplasies as in Figure 1b). If the two sites are not compatible, they are termed incompatible. Under an infinite-sites model (Kimura1969) of sequence
evolu-tion, the possibility of a homoplasy does not exist, and so incompatibility for a pair of sites implies that at least one recombination event must have occurred, as in Figure 1a. This can be used to estimate the minimum number of recombination events present in the sample as a whole (Hudson and Kaplan 1985; Song and Hein 1999;
Myersand Griffiths2003). Testing for compatibility
can be accomplished by checking if all four combi-nations off00, 01, 10, 11g are present among the se-quences (LeQuesne1969).
The traditional, binary notion of either compatibility or incompatibility treats a single homoplasy the same as many homoplasies. That is, although in some situations more than one homoplasy can be parsimoniously in-ferred for a pair of sites (Caminand Sokal1965; Penny
and Hendy 1986), this information is disregarded.
Consider two sitesiandj, withjxijandjxjjrepresenting
the number of observed states (alleles) at each site. Let
l(xi, xj) denote the minimum number of mutations
required byany treeused to represent the genealogical history of both sites. Thusl(xi,xj) represents the
max-imum parsimony score for these two characters over all
trees. Note thatl(xi,xj)$(jxij 1)1(jxjj 1) as each
state (except the ancestral state) must arise at least once in the tree. Define the refined incompatibility score of sitesiandjas
iðxi;xjÞ ¼lðxi;xjÞ ðjxij 1Þ ðjxjj 1Þ:
The refined incompatibility score relates to the tradi-tional notion of compatibility in the following way: two sites are compatible if and only ifi(xi,xj)¼0; ifi(xi,
xj).0 the two sites are incompatible. There are also two
interpretations of this refined incompatibility score: in the absence of recombination, this score represents the minimum number of homoplasies that have occurred in the history of the samples for these two sites (Pennyand
Hendy1986); in the absence of recurrent or convergent
mutations, this score represents the minimum number of recombinations that have occurred between the two sites (T. Bruenand D. Bryant, unpublished data).
This latter result depends on viewing recombinations as unrooted subtree-prune and regraft operations (see Hein et al. 2005). Importantly, this score can be
cal-culated quickly [linear time in the number of sequences (Bruenand Bryant 2006)], which allows alignments
with large numbers of sequences to be evaluated rapidly. A parsimony informative site has at least two different alleles that are represented by at least two different sequences each (there must be at least four sequences at a site for the site to be parsimony informative) (Felsenstein 2004). A compatibility matrix (Sneath et al.1975; Jakobsenand Easteal1996) is traditionally
used to represent compatibility between all pairs of parsimony informative sites. This matrix can also easily be extended into a refined incompatibility matrix by setting each entry (i,j) equal to the refined incompat-ibility score between any two sitesiandj.
Sites that have the same history will tend to be more compatible than sites that have different histories (Sneath et al. 1975; Jakobsen and Easteal 1996; Drouin et al.
1999). One way to measure the extent of ‘‘clustering’’ in the matrix is to consider the proportion of neighboring cells in the matrix that are either compatible or incompatible. The resulting statistic is termed the NSS and has been used as a powerful test for recombination ( Jakobsenand Easteal
1996; Brownet al.2001; Posadaand Crandall2001;
Wiufet al.2001; Posada2002). However, simulations
sug-gest that the NSS produces an excess of ‘‘false positives’’ in certain situations (seeresults and discussion) and so we
have developed an alternative statistic.
Test statistic (Fw): The degree of genealogical cor-relation between neighboring sites is negatively corre-lated with the rate of recombination (Hudson and
Kaplan1985). In the case of finite levels of
recombina-tion, the genealogical correlation of sites is partially reflected by a tendency of closely linked sites to have greater compatibility than distant sites (Hagenblad
and Nordborg2002; Innanand Nordborg2002).
To measure the similarity between closely linked sites, we propose calculating a new statistic, the pairwise homoplasy index (PHI). The idea is to calculate the mean refined incompatibility score from nearby sites by using the firstkoff-diagonal rows of a refined incompatibility matrix (see Figure 2). Letwdenote a fixed width (mea-sured in bases) and choosekso that it is proportional to
w. Specifically, letqdenote the proportion of parsimony informative sites within the alignment and setk¼wq. The statistic thus measures the mean refined incompat-ibility score of sites up to (approximately)wbases apart. We can now formally define theFor PHI statistic as
Fw ¼ 2
kð2nk1Þ
Xk
j¼1 Xnj
i¼1
iðxi;xi1jÞ:
The term ‘‘pairwise homoplasy index’’ refers to the fact that the refined incompatibility score can be inter-preted as the minimum number of convergent or re-current mutations (homoplasies) necessarily present on any tree describing the history of any two sitesi andj. The termk(2nk1)/2 is a normalizing factor.
Clearlywshould be somewhat less than the total number of sites but large enough that a number of comparisons are made. For all simulated and empirical analyseswwas set to 100 andkchosen according to the above formula. Other choices ofw were also considered (w ¼50 and
w ¼ 150), but simulations (across different sequence lengths) suggested thatw¼100 was slightly better than the other two choices (results not shown).
Significance:Significance of the observedFw-statistic
can be obtained by using a permutation test. Under the
null hypothesis of no recombination, the genealogical correlation of adjacent sites is invariant to permutations of the sites as all sites have the same history. But in the case of finite levels of recombination, the order of the sites is important, as distant sites will tend to have less genealogical correlation than adjacent sites. Let^z de-note the observed value of theFw-statistic on the original
alignment and letZ0denote the value of theFw-statistic
for a random permutation of the sites. HenceZ0is dis-tributed according to the null hypothesis of no recom-bination. To determine the significance of the observed value^z, a Monte CarloP-value can be directly estimated by permuting the alignment many times and counting the proportion of times theFw-statistic on a permuted alignment is less than or equal to^z. However, compu-tation ofP-values based on permutations of the align-ment is time consuming. One way to circumvent this problem is to determine the distribution of the test sta-tistic under permutations of the alignment. The expec-tation (E0(Fw)¼m9) and variance (Var0(Fw)¼s2) ofFw
can be calculated analytically (seeappendix afor details).
Moreover, initial simulations indicated that the distribu-tion of Fw under permutations of the alignment is
approximately normal (results not shown). Using these assumptions, the value of PrðZ0#^zÞcan be calculated as
PrðZ0#^zÞ ¼
ð^z
‘
nðtjm9;s2Þdt;
where n(tjm9, s2) denotes a normal probability
dis-tribution function with meanm9and variances2. This
alternative to the permutation test has the advantage that it can be obtained quickly and gives a more precise
P-value under an assumption of normality.
The normality of the distribution of the test statistic can be explained by noting that for a large refined in-compatibility matrix, calculating theFw-statistic amounts
to taking the mean of a small sample of values from the matrix. The simplest version of the central limit theo-rem then suggests that taking the mean of a small sample within a ‘‘large’’ matrix has a limiting normal distribution, if the terms are independent and identi-cally distributed (Casellaand Berger2001). However,
in this case the central limit theorem provides a guide rather than a formal equivalence.
For every data set examined (both simulated and empirical) the significance of the observedFw-statistic
was calculated using the permutation test directly as well as the normal alternative. The P-values obtained by using the permutation test are written as PP(Fw)
whereas the P-values obtained by using the normal alternative are written asPN(Fw).
Simulation study:We repeated many of the same sim-ulations that had been performed in other studies (Posada
and Crandall2001; Wiufet al.2001) but expanded the
parameter search space and considered theFw-statistic
as well as additional tests. The protocol followed was Figure 2.—The entries marked with a diamond in the
based on simulations from the neutral coalescent model (Kingman1982) with recombination (Hudson1983).
The coalescent model provides a natural foundation for simulation (Crandalland Templeton1999; Brown et al. 2001; Posada and Crandall 2001; Wiuf et al.
2001). Simulations were almost all conducted using the program Treevolve (Grasslyet al.1999). For very high
rates of recombination (r¼128), simulations were per-formed using the program Hudson (Schierupand Hein
2000a,b) since the program Treevolve did not run at such high rates of recombination. Mutations were added according to a Jukes–Cantor model ( Jukesand Cantor
1969). Other methods of sequence evolution were also examined, including the addition of extreme rate het-erogeneity (a¼0.1), which resulted in a moderate de-crease in power for all methods (results not shown). For each parameter setting, 1000 replicate data sets were created, with each replicate consisting of an alignment of length 1000 (see appendix b for further details).
Significance was set at the 0.05 level.
In addition to theFw-statistic, four of the best
non-parametric tests were computed for each parameter setting, namely the Max x2-statistic (Maynard Smith
1992), the NSS ( Jakobsen and Easteal 1996), and
two measures of correlation of linkage disequilibrium (r2 and jD9j) with distance (Lewontin 1964; Hill
and Robertson1968; Miyashitaand Langley1988;
Schaeffer and Miller 1993). Furthermore, results
obtained from a coalescent-based likelihood permuta-tion test (LPT) from LDHat (McVeanet al.2002) are
reported as well. The Maxx2-statistic has been found to
be the best general test for detecting recombination in a recent empirical study (Posada2002), and the NSS
statistic has been found to be very efficient as well (Brownet al.2001; Posadaand Crandall2001; Wiuf et al. 2001; Posada2002). Correlation of linkage
dis-equilibrium with distance usingr2has been found to be
the strongest nonparametric approach for detecting recombination within populations (McVeanet al.2002).
Recently, the likelihood permutation test was intro-duced as a powerful alternative to methods based on linkage disequilibrium (McVean et al. 2002). For the
Max x2-statistic a fixed window size of the number of
polymorphic sites divided by 1.5 was used following a previously described protocol (Posadaand Crandall
2001; Posada2002). For both measures of correlation
of r2 and D9 with distance, only sites with two alleles
segregating and minor allele frequencies of at least 0.1 were used, as this approach tends to maximize power (Weir and Hill 1986; McVean et al. 2002). For the
likelihood permutation test, precomputed likelihood files were used on the basis of 101 grid points with a value ofuper site of either 0.001 or 0.1. For each repli-cate, if the expected mean sequence diversity was,10%, then a likelihood file with auper site value of 0.001 was used; otherwise a likelihood file with auper site value of 0.1 was used (under a constant-size population the
expected mean sequence diversity of 10% corresponds to an expected value of u per site of 0.12). The sig-nificance for each of the statistics was obtained using a permutation test. For the power determination, 1000 permutations were performed, whereas for the false positives, 200 permutations were performed.
Power:To determine power in the presence of recom-bination, the recombination rater(under population growth r†) varied among 0, 1, 2, 4, 8, 16, and 128; the
expected nucleotide diversitypbetween any two sequen-ces varied among 1, 5, 10, 15, and 25%; and the growth rate of the populationbvaried between 0 (constant-size populations) and 5000. The sample sizemvaried among 5, 10, 15, 25, and 50. Forr¼128 simulations withb¼ 5000 were not performed since this option was not avail-able with the program Hudson. More details explaining the protocol can be found inappendix band elsewhere
(Wiufet al.2001).
False positives: Substitution rate heterogeneity across sites on a genealogy was modeled here using a G-distribution (Uzzell and Corbin 1971; Yang 1993).
In this case, the substitution rate at each sitei,Zi, is drawn from aG-distribution with shape parameteraand scale parameter 1/a(Yang1993).
Autocorrelation among substitution rates was mod-eled assuming Markov dependence among rates (Yang
1995). To achieve this, two random variablesYiandYi11 were drawn from a bivariate normal distribution with correlationrNand transformed into two marginally dis-tributed gamma random variablesZiandZi11with cor-relation rG (Yang 1995). Using the bivariate normal
distribution of YiandYi11(including correlation rN), the probability distribution function of random variable
Yi11was obtained conditional on the random variable
Yi, allowing Markov-dependent substitution rates to be drawn. The substitution ratesZiandZi11then represent draws from a bivariate G-distribution with correlation rG. The value ofrGis positively correlated with the value rNbut not identical (Yang1995).
Data sets were simulated using a modified version of Treevolve (Grassly et al.1999) with a number of the
sampling functions taken from PAML (Yang1997). The
correlation parameter rNvaried among 0 (no correla-tion), 0.3, 0.6, and 0.9; the expected nucleotide diversityp
between any two sequences varied among 1, 5, 10, 15, and 25%; the value ofafor theG-distribution varied among 0.1, 1.0, and‘; and the growth rate of the populationb varied between 0 (constant-size populations) and 5000. The sample sizemvaried among 5, 10, 15, 25, and 50.
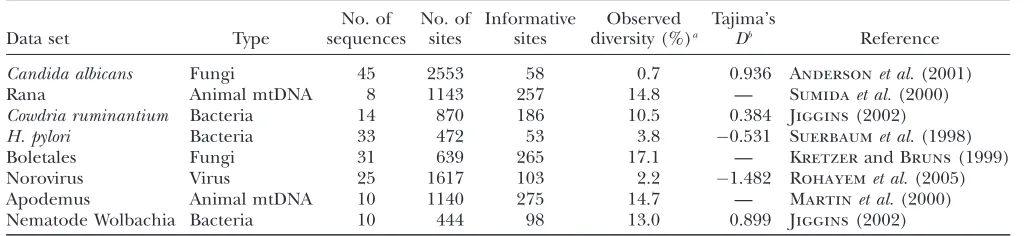
Empirical data: A number of population and species level data sets were examined. The presence of recombi-nation in each of these data sets was debated, unknown, or suspected. The rate of recombination in these data sets ranged from rare to very frequent. In general, data sets with at least a few hundred sites were chosen.
1992) and the NSS statistic ( Jakobsen and Easteal
1996). As in the simulation studies,wwas set to 100 for all analyses. One thousand permutations were per-formed to obtain significance. Additional results are reported for the population level data sets, using permu-tation tests based onr2andjD9j(Lewontin1964; Hill
and Robertson1968; Miyashitaand Langley1988;
Schaeffer and Miller 1993) as well as a
coalescent-based LPT with LDHat (McVeanet al.2002).
Further-more, an estimate of the rate of recombination was also obtained in LDHat using a model of crossing over rather than gene conversion. The maximum value ofrwas set to 100 and 100 grid points were used in LDHat. The value of Tajima’sD-statistic is also reported, as it can be an indicator of population growth or selective pressure (Tajima1989). Table 1 summarizes the data sets used.
The data sets include sequences from bacteria, viruses, and fungi. Two of the data sets were from animal mito-chondrial DNA (mtDNA).
For the Boletales data set additional analysis was per-formed by first estimating a neighbor-joining tree (Saitou
and Nei1987) using PAUP* (Swofford1998). Branch
lengths for the tree, a transition/transversion ratio, co-don frequencies, a value ofa for the substitution rate heterogeneity (Yang 1993), as well as the degree of
substitution rate autocorrelation (estimated using the autodiscrete gamma model) (Yang 1995), were then
estimated using a codon model in PAML (Yang1997). A
parametric bootstrap of 1000 replicates was then per-formed under the estimated parameters using a modified version of PAML that allowed autocorrelated substitu-tion rates. For each replicate, a test for recombinasubstitu-tion was performed using the Max x2-statistic, the NSS
statistic, and theFw-statistic (with 1000 permutations).
Significance was set at 0.05.
RESULTS AND DISCUSSION
Simulation studies: Analytical calculation of P-values:
Table 2 shows the proportion of times that
recombina-tion was inferred usingFw, when the rate of
recombi-nationrwas set to 0 and there was no population growth (b¼0). Since the significance level was set to 0.05, the Fw-test is too conservative when the mean sequence
diversity is1% or when there are few samples (e.g.,m¼ 5). This is partly due to the fact that there are very few informative sites or incompatibilities produced in these situations (results not shown). Table 2 also indicates that when the sequence diversity and sample size are small, obtaining significance using the permutation test (PP(Fw)) is even more conservative than obtaining significance using the normal distribution (PN(Fw)). On the other
hand, Figure 3 shows that both methods for obtaining significance give very similar answers for higher amounts of sequence diversity (at least 10%), with at least 15 sam-ples. These results suggest that it is sufficient to obtain significance forFwusing the normal distribution. For all
subsequent simulations, the results quickly obtained with theFw-statistic using the normal distribution are reported. Time: The time to calculate Fw is much faster than
other population genetic methods especially for mod-erate numbers of sites and sequences. For instance, sev-eral simulated alignments of 25 samples with 5000 sites with moderate sequence diversity (10%), corresponding TABLE 1
Summary of empirical data sets
Data set Type
No. of sequences
No. of sites
Informative sites
Observed diversity (%)a
Tajima’s
Db Reference
Candida albicans Fungi 45 2553 58 0.7 0.936 Andersonet al.(2001)
Rana Animal mtDNA 8 1143 257 14.8 — Sumidaet al.(2000)
Cowdria ruminantium Bacteria 14 870 186 10.5 0.384 Jiggins(2002)
H. pylori Bacteria 33 472 53 3.8 0.531 Suerbaumet al.(1998)
Boletales Fungi 31 639 265 17.1 — Kretzerand Bruns(1999)
Norovirus Virus 25 1617 103 2.2 1.482 Rohayemet al.(2005)
Apodemus Animal mtDNA 10 1140 275 14.7 — Martinet al.(2000)
Nematode Wolbachia Bacteria 10 444 98 13.0 0.899 Jiggins(2002)
a
Mean proportion of sites that differ between any two sequences.
b
Calculated on sites with only two alleles segregating.
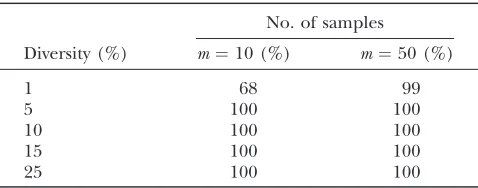
TABLE 2
Proportion of times recombination inferred usingFwwhen
r¼0 andb¼0 (without mutation rate correlation or substitution rate heterogeneity)
Diversity (%)
m 1 5 10 15 25
5 0.4 0.4 1.6 0.9 3.6 1.7 4.2 2.4 5.1 3.7 10 0.1 0.0 3.1 1.5 4.6 3.5 3.9 3.2 4.7 4.0 15 0.2 0.0 5.5 3.8 5.7 4.7 5.4 4.5 4.0 3.8 25 0.3 0.2 4.6 2.9 4.8 4.3 4.5 3.8 4.5 4.1 50 0.8 0.1 5.9 4.5 4.1 3.8 5.7 5.6 5.7 5.3
to viral genomic samples, were analyzed on a Mac G4 desktop computer. The time taken to analyze each alignment was 20 sec using Fw without the
permu-tation test, 30 sec usingFwwith the permutation test,
7 min with the linkage disequilibrium methods (using LDHat), and 8 hr using the likelihood permutation test of LDHat (using a precomputed likelihood file). For longer alignments, however, the permutation test be-comes impractical even for Fw and in these cases
analytical P-values are the only way to practically test for recombination. It is worth noting that since the power to detect recombination increases as a function of sequence length (Wiufet al.2001), this constitutes an
important advantage for the Fw-test, since faint
re-combinant signals may be detectable using only very long sequences.
Power: Figure 4 shows the power to detect recombi-nation forFw, Maxx2, NSS, the LPT in LDHat, and two
measures of correlation of linkage disequilibrium with distance (r2andjD9j), when the rate of recombinationr
is greater than zero, for two different sample sizes (m¼ 10 andm¼50). Two principal types of genealogies were created: with and without population growth. If there is population growth, the genealogies created will be more star-like with long branches at the leaves (Griffithsand
Tavare´1998; Wiufet al.2001). If there is no population
growth, there are short branches at the tip but long branches at the root. When genealogies are more star-like, recurrent mutations will tend to mask the initial recombination, and the recombination events are best considered to be ‘‘ancestral.’’
The top rows of Figure 4, a and b, show that without population growth (b¼0), all six methods performed similarly, although overallFwis the most powerful method
with a large number of samples. Without population
growth, the power to detect recombination of all six methods generally increases as a function of both se-quence diversity and the rate of recombination, similar to earlier observations (Posada and Crandall 2001;
Wiufet al. 2001). A notable exception is the LPT for
which there is a slight decline in power when the mean sequence diversity reaches 10%. At this point, a likeli-hood file with a value ofuper site of 0.1 was used rather than a likelihood file with a value ofuper site of 0.001. However, when the sequence diversity reaches 10%, the expected value ofuper site is0.12, suggesting that a value ofuper site of 0.1 is a better choice. Nonetheless, more power may be obtained by using a gross un-derestimate of u, although previous work has demon-strated a relative insensitivity of the LPT to a specific estimate ofu(McVeanet al.2002).
The top rows of Figure 4, a and b, suggest that the Fw method performs similarly to the linkage
disequi-librium approaches when there is very little sequence diversity (e.g.,p¼1%), despite the fact that the test is too conservative in these circumstances (Table 2). For very little sequence diversity (i.e.,p ¼1%), the coalescent-based method LPT is the most powerful method in constant-size populations, but has about the same power as Fw for growing populations. However, the results
suggest that all methods may underestimate the pres-ence of recombination if few sequpres-ences are present with very little divergence, especially in an expanding pop-ulation (or ‘‘star-like’’ genealogy).
By comparing the bottom rows of Figure 4, a and b, to the top rows of Figure 4, a and b, it is evident that detecting the presence of recombination under pop-ulation growth (b¼5000) is a more difficult task than detecting the presence of recombination without pop-ulation growth (b¼0). Of all six methods, the bottom rows of Figure 4, a and b, suggest thatFwis much better
at detecting recombination under population growth than Max x2, NSS, the coalescent-based LPT, or the
linkage disequilibrium approaches. For the coalescent-based LPT, it is worth noting that population growth could be incorporated in the method in the future, possibly increasing power. The decline of linkage dis-equilibrium in expanding populations using r2is
con-sistent with previous observations (Slatkin1994; McVean
2002), but the results suggest that the performance of the jD9jstatistic is similar. The results for theFw-test suggest
that subsequent mutations do not ‘‘mask’’ the recombi-nant signal for this method. Interestingly, this is similar behavior to the RECPARS method (Hein1993; Wiufet al.
2001) and may be of particular importance when trying to determine ancestral recombination between diverged genotypes. The results also suggest that theFw-statistic
can be used to distinguish between star-like genealogies due to population growth and star-like genealogies due to recombination (Schierupand Hein2000b).
A comparison of the top row of Figure 4a to the top row of Figure 4b reveals that an increase in sample size Figure3.—Comparison ofP-values obtained using the
fromm¼10 tom¼50 causes an increase in the ability of all six methods to infer recombination when there is no population growth (b¼0). For population growth (the bottom rows of Figure 4, a and b), the power to detect recombination for the NSS statistic for actually de-creases sharply fromm¼10 tom¼50. But for the other five tests, the power to detect recombination generally increases when moving from m¼ 10 tom ¼50 even under population growth. These results expand upon some previous observations (Wiufet al.2001).
Under a neutral coalescent model with recombina-tion, it is possible to use a likelihood-ratio test to deter-mine whether the hypothesis of no recombination (r¼0) should be rejected at a given significance level (Kuhner et al.2000; Brownet al.2001). However, even when data
are simulated according to the neutral coalescent with
low levels of recombination, the hypothesis r ¼ 0 is rejected only a limited proportion of the time (Brown et al.2001). However, such a simulation represents an ideal situation, where the likelihood-ratio test is guaran-teed to be the most powerful (Brownet al.2001) and
the model used to inferris identical to the model used to generate samples. This suggests that it might be difficult for any test to correctly infer the presence of recombination for very low recombination rates. Addi-tionally, a theoretical analysis shows that generating small sets of samples using a low rate of recombination produces only a limited number of incompatibilities (Wiufet al.2001). It is thus possible that full-likelihood
approaches (Kuhner et al. 2000; Fearnhead and
Donnelly 2001) or a phylogenetic network (Huson
and Bryant2006) approach could be particularly useful
Figure4.—Power to detect recombination for (a)m¼10 and (b)m¼50 samples for six different methods with (a and b, bottom rows) and without (a and b, top rows) population growth. The horizontal axis varies the rate of recombination whereas the vertical axis varies the amount of sequence diversity. Each cell represents the outcome of 1000 replicates with cells with lighter shading indicating increased power. The valuer†refers to the value ofrused to give the same expected number of recombinations
to determine whether there is any possibility of recom-bination when only a weak recombinant signal exists.
Table 3 demonstrates thatFwcan detect recombina-tion even under extremely high recombinarecombina-tion rates (r¼128). Except for low sequence diversity (p¼1%), the presence of recombination is correctly inferred each time. But even for low sequence diversity, the presence of recombination can be inferred nearly every time by increasing the sample size fromm¼10 tom¼50.
It is worth noting that the Fw-statistic can also be
calculated without the refined incompatibility score, but using only the traditional notion of compatibility. For cases without population growth (b¼0), the results are almost identical (results not shown). On the other hand, with population growth (b¼5000), there is an increase in power using the refined incompatibility score when the number of samples is large (e.g.,m¼50) and there is some recurrent mutation. For a rate of recom-bination ofr¼1, a sample size of 50, and exponential growth, the gains in power using the refined incompat-ibility score rather than the compatincompat-ibility score were 2, 5, and 12% for mean pairwise sequence divergences of 10, 15, and 25%, respectively. Similar results are obtained
for r ¼ 2 but not for higher rates of recombination (results not shown). This suggests that the refined in-compatibility score is a useful extension to the tradi-tional notion of compatibility especially for large sample sizes with sites that experience recurrent mutations.
For no population growth, theFw-test and the linkage
disequilibrium approaches perform similarly, although Fw is more powerful for a large number of samples.
However,Fwis applicable even if the samples are from
different species or different populations, whereas the linkage disequilibrium and coalescent approaches are not (Tsaousiset al. 2005). Under population growth,
however (b¼5000), onlyFwcontinues to consistently infer the presence of recombination as the power of the other five methods suffers sharp declines. This suggests that, of all six methods,Fwhas the greatest flexibility in
detecting recombination in the different circumstances studied.
False positives: Of particular concern for any test for recombination is the effect of confounding processes such as substitution rate heterogeneity and autocorre-lated substitution rates. Autocorrelation of substitution rates implies that the rate of substitution of one site is not independent of the rate of substitution of a neighboring site and can create ‘‘mutational hot spots’’ within a sequence. This can potentially create the same patterns as recombination.
Figure 5 shows the proportion of false positives for Maxx2and NSS when there is no recombination (r¼0)
but ‘‘mosaic’’ sequences are artificially induced by using a range of autocorrelated substitution rates. Figure 5 shows that both Maxx2and NSS falsely infer the
pres-ence of recombination .50% of the time in certain cases. The results for the linkage disequilibrium, like-lihood permutation test, and Fw are omitted from
Figure 5 since these methods did not falsely infer
Figure5.—Percentage of false positives for (a)m¼10 samples (withb¼5000), (b)m¼50 samples (withb¼0), and (c)m¼50 samples (withb¼5000), for Maxx2and NSS, with extreme rate heterogeneity (top row) and moderate rate heterogeneity
(bot-tom row). The horizontal axis varies the substitution rate correlation whereas the vertical axis varies the amount of sequence diversity. Each cell represents the outcome of 1000 replicates with cells with lighter shading indicating a higher percentage of false positives. The results forFw,r2, andjD9jare omitted since these approaches did not falsely infer recombination.7% of
the time for any of the conditions, but Table 4 shows a number of these results forFw.
TABLE 3
Power to detect recombination usingFwwith a high rate
of recombinationr¼128
No. of samples
Diversity (%) m¼10 (%) m¼50 (%)
1 68 99
5 100 100
10 100 100
15 100 100
recombination .7% of the time, although Table 4 shows this information forFw. Table 4 shows that the
Fw-statistic did not infer recombination .6% of the
time when recombination was falsely inferred.50% of the time using both Max x2 and NSS. Although the
global model of substitution rate autocorrelation em-ployed by this study is quite simple since it ignores codon positions and substitution rate correlation within local patterns of substitution (McVean2001), it
none-theless provides a guide to the effect of autocorrelated substitution rates.
The problem of false positives in NSS and Max x2is
most severe for large sample sizes (e.g.,m¼50), both under constant-size populations (Figure 5b) and under population growth (Figure 5c). Although the problem is in general greater for higher substitution heteroge-neity (Figure 5, top rows) it is also a problem with lower substitution rate heterogeneity (Figure 5, bottom rows). The level of false positives of both NSS and Max x2
suggests caution in interpreting evidence for recombi-nation, especially when autocorrelated rates are an issue. For instance, inferring the presence of recombi-nation in mitochondrial DNA should be done cau-tiously as substitution rate correlation is known (Yang
1995; Nielsen1997).
The results usingFwcontrast strongly with the results
using the NSS (which is also compatibility based). This is likely due to the difference in the statistics themselves. TheFw-statistic uses compatibility between closely linked
sites directly whereas the NSS statistic measures cluster-ing within a compatibility matrix. As the clustercluster-ing can be caused by substitution rate correlation, and not only by recombination, this might explain the difference between the two statistics. For Max x2 the problem is
possibly due to pairs of sequences that differ greatly on one side of a site (due to high mutation) but share a great degree of similarity on the other side of a site (due to low mutation). Local ‘‘bursts’’ of mutation (McVean
2001) likely exacerbate the problem, especially for link-age disequilibrium approaches that are based on allele frequencies at different sites.
Empirical data:The general information concerning the empirical data sets is summarized in Table 1. Tables 5 and 6 show the results of tests for recombination on all the empirical data sets. In addition to the results obtained using the Fw-statistic, results using Max x2
(MaynardSmith1992), NSS ( Jakobsenand Easteal
1996), correlation ofr2andjD9jwith distance (Lewontin
1964; Hilland Robertson1968), and a LPT (McVean et al. 2002) are shown. The estimates of r for the population level data sets were obtained using LDHat (McVeanet al. 2002). Tests for recombination within
populations (i.e., r2, jD9j, and LPT) were not applied
to data sets that contained individuals from different species.
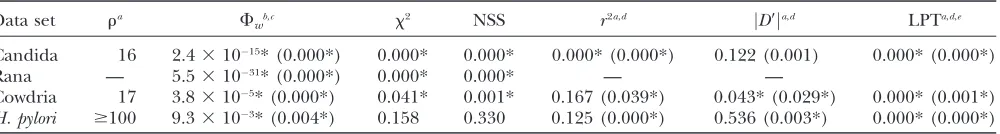
Recombinant examples: Table 5 shows that the null hy-pothesis of no recombination is rejected by all tests for most of the suspected recombinant data sets, including the Candida example that had very little sequence di-versity (0.7%). Whereas a lack of sequence didi-versity in the simulations made recombination harder to detect, this may be partially overcome by using longer align-ments, such as that for the Candida example, which had 2553 sites. Interestingly, the null hypothesis of no re-combination was not universally rejected for two of the bacterial data sets: Cowdria andHelicobacter pylori. For
TABLE 5
Analysis of suspected recombinant data sets
Data set ra F
wb,c x2 NSS r2a,d jD9ja,d LPTa,d,e Candida 16 2.431015* (0.000*) 0.000* 0.000* 0.000* (0.000*) 0.122 (0.001) 0.000* (0.000*)
Rana — 5.531031* (0.000*) 0.000* 0.000* — —
Cowdria 17 3.83105* (0.000*) 0.041* 0.001* 0.167 (0.039*) 0.043* (0.029*) 0.000* (0.001*) H. pylori $100 9.33103* (0.004*) 0.158 0.330 0.125 (0.000*) 0.536 (0.003*) 0.000* (0.000*)
*P,0.05.
a
Calculated on sites with only two alleles segregating with LDHat.
b
Each pair showsP-values calculated analytically and using a permutation test, respectively.
c
wwas set to 100 for all tests.
d
Terms in parentheses show results on sites with minor allele frequencies.0.1.
e
Denotes the value of a likelihood permutation test calculated in LDHat.
TABLE 4
Proportion of times recombination is falsely inferred using Fwwith substitution rate heterogeneitya¼0.1, mutation
rate correlation, and sample sizem¼50
Mutation rate correlation
Diversity (%) 0 0.3 0.6 0.9
1 2.0 3.6 2.5 3.6 2.6 3.9 1.1 3.8
5 4.9 4.7 5.8 4.5 4.7 3.3 3.0 1.0
10 4.1 5.6 4.7 4.6 4.8 3.0 1.8 1.5
15 4.9 4.0 4.5 4.7 3.8 4.5 2.9 1.8
25 5.3 4.0 3.7 3.5 4.1 3.9 3.4 2.1
these two bacterial examples, evidence for recombi-nation was found using the Fw-statistic as well as the
coalescent-based likelihood permutation test. However, recombination was detected in the Cowdria example using the correlation of distance withr2only after sites
with minor alleles were removed. Moreover, in the H. pyloridata set neither NSS nor Maxx2found significant
evidence for recombination. This could be due to the high suspected rate of recombination in the H. pylori
example, which has conditions approaching linkage equilibrium (Suerbaum et al. 1998). The linkage
dis-equilibrium methods seem to be highly sensitive to sites with low allele frequencies and consistent results are obtained only after the removal of these sites.
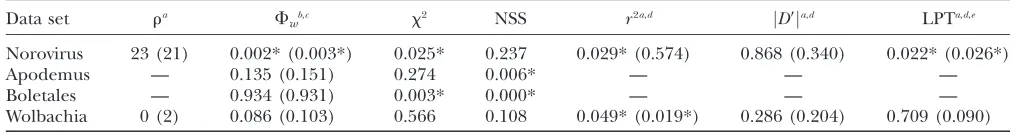
Possibly recombinant examples: The results obtained from the data sets for which the status of recombina-tion is debated are quite interesting (Table 6). For the Norovirus example, evidence of recombination is found usingFw, Maxx2, and the LPT. There is some evidence
of recombination found with r2, but after sites with
minor allele frequencies,0.1 are removed no further evidence is found by the linkage disequilibrium meth-ods. Since the samples came from a number of different cities, it could be that evidence of recent recombination is weakened by removing these sites. However, the LPT finds evidence of recombination regardless of whether or not these sites are removed.
For the bacterial symbiont nematode Wolbachia, there is little prior reason to suspect recombination ( Jiggins2002). Nonetheless, evidence for
recombina-tion is found using correlarecombina-tion ofr2with distance and
marginal evidence for recombination is found by using the likelihood permutation test when sites with minor alleles frequencies,0.1 are removed. The results ob-tained using the Fw-statistic also suggest that there is
marginal evidence for recombination with Wolbachia. The possible presence of recombination in Wolbachia should be tested further using more data.
Recombination in the animal mitochondrial DNA of Apodemus was first proposed (Ladoukakis and
Zouros 2001) and then disputed (Maynard Smith
and Smith 2002). Tests for recombination using Fw
and Max x2 indicate that there is little evidence for
recombination, although the NSS statistic does find evidence for recombination. The evidence for recom-bination within Apodemus using the Maxx2-test is even
weaker here than in previous studies (MaynardSmith
and Smith2002), possibly due to the fact that this
im-plementation of the Max x2-test uses a ‘‘fixed window
size.’’ Given the high level of false positives of NSS, the results suggest that evidence for recombination within Apodemus is lacking.
For the fungal Boletales, results using theFw-statistic are quite distinct from the results obtained using both the NSS and the Maxx2-statistic. TheF
w-based tests find
no evidence for recombination whereas both other tests find strong evidence for recombination. Interestingly, although most other methods for detecting recombina-tion find evidence for recombinarecombina-tion within this data set, Geneconv (Sawyer1989), another powerful
sequence-based test for recombination, does not (Posada2002).
One possibility for the Boletales data set is that theFw
-statistic is too conservative and produced a type II error (‘‘false negative’’). The Boletales data set is a saturated data set with a strong A1T bias (Kretzerand Bruns
1999). The strong A 1T bias results in an estimated transition/transversion ratio of 0.4. Simulations show, however, that even under such conditions, there is rea-son to believe that recombination will still create distinct patterns of compatibility and incompatibility that should be detectable using theFw-statistic (results not shown).
Moreover, simulations indicate that theFw-statistic
ap-pears to be more powerful than the NSS statistic (which is also compatibility based), suggesting that a type II error for theFw-statistic, but not for the NSS statistic, is unlikely.
Another possibility for the Boletales example is that both Maxx2and the NSS statistic are producing type I
errors, which, according to the simulations, autocorre-lated substitution rates might induce. To test this, a parametric bootstrap with 1000 replicates simulating codons (with no recombination) was performed using a substitution rate heterogeneity of 1.31 and global TABLE 6
Analysis of possibly recombinant data sets
Data set ra F
wb,c x2 NSS r2a,d jD9ja,d LPTa,d,e Norovirus 23 (21) 0.002* (0.003*) 0.025* 0.237 0.029* (0.574) 0.868 (0.340) 0.022* (0.026*)
Apodemus — 0.135 (0.151) 0.274 0.006* — — —
Boletales — 0.934 (0.931) 0.003* 0.000* — — —
Wolbachia 0 (2) 0.086 (0.103) 0.566 0.108 0.049* (0.019*) 0.286 (0.204) 0.709 (0.090)
*P,0.05.
aCalculated on sites with only two alleles segregating.
bEach pair showsP-values calculated analytically and using a permutation test, respectively. cwwas set to 100 for all tests.
d
Terms in parentheses show results on sites with minor allele frequencies.0.1.
e
substitution rate correlationrG¼0.35 as estimated from the data set. Figure 6 shows the distribution of estimated
P-values obtained on the 1000 replicates using the Max x2-statistic, NSS statistic, and theF
w-statistic.
Recombi-nation was inferred 5.7% of the time using the Fw
-statistic, 8.5% of the time with the Maxx2-statistic, and
37.5% of the time using the NSS statistic. Since none of the replicates contained recombination, the P-values for each of the three methods should follow a uniform distribution. Figure 6 shows that the parametric boot-strap creates conditions similar to recombination for both Max x2 and NSS [a one-sided Kolmogorov–
Smirnov test (Massey1951) rejects the uniform
distri-bution at a significance level of 107for both Maxx2and
NSS but fails to find any evidence to reject the uniform distribution forFw]. Whereas the results for Maxx2are
less striking than those for NSS, the parametric boot-strap fails to account for local patterns of mutation (Hey
2000; McVean 2001; McVeanet al. 2002), which are
likely to exacerbate the observed bias. These results suggest that there is reason to doubt the validity of the inferences of Maxx2and NSS concerning the presence
of recombination in the Boletales data set.
Conclusion: We have presented a simple, powerful test for detecting recombination that can be used re-gardless of sample history. The approach is very general (e.g., does not assume a single population) and aims to determine simply whether there is a recombinant signal present within the sequences. In contrast to two other general tests, Maxx2and NSS, our test does not falsely
infer the presence of recombination because of muta-tion rate correlamuta-tion (which is present in some mito-chondrial DNA). Interestingly, our approach performs very well even in the presence of population growth, in contrast to methods based on linkage disequilibrium (r2
and jD9j), a coalescent-based likelihood permutation test (from LDHat), Maxx2, and NSS. Our method can
be used by itself, or to validate the visual presence of recombination from a phylogenetic network approach,
or to independently verify the presence of recombina-tion if a positive estimate of the rate of recombinarecombina-tion is obtained. The approach may be particularly useful in distinguishing recurrent mutation from recombination when assumptions such as a single, randomly mating, and constant-size population are not met. The test can be used easily when many sequences and sites are pres-ent because of its computational efficiency and indeed is more powerful in such circumstances. A program im-plementing our test as well as both Maxx2and NSS is
available as a stand-alone program at the following ad-dress: http://www.mcb.mcgill.ca/
trevor. The test is also implemented in SplitsTree 4.2, available at http://www. splitstree.org.
T.B. thanks Kirk and Rachel Bevan, Scott Bunnell, Daniel Huson, and Russell Steele, as well as the two anonymous referees for a number of helpful suggestions that greatly improved the manuscript. T.B. is supported by the National Science Engineering and Research Council (NSERC) (postgraduate scholarship B) and by Le Fonds que´be´cois de la recherche sur la nature et les technologies (FQRNT grant 2003-NC-81840). D.B. is supported in part by NSERC (grant 238975-01). H.P. acknowledges Ge´nome Que´bec.
LITERATURE CITED
Anderson, J. B., C. Wickens, M. Khan, L. E. Cowen, N. Federspiel
et al., 2001 Infrequent genetic exchange and recombination in the mitochondrial genome of Candida albicans. J. Bacteriol.
183(3): 865–872.
Awadalla, P., 2003 The evolutionary genomics of pathogen
recom-bination. Nat. Rev. Genet.4(1): 50–60.
Awadalla, P., A. Eyre-Walkerand J. M. Smith, 1999 Linkage
dis-equilibrium and recombination in hominid mitochondrial DNA. Science286(5449): 2524–2525.
Brown, C. J., E. C. Garner, A. Keith Dunker and P. Joyce,
2001 The power to detect recombination using the coalescent. Mol. Biol. Evol.18(7): 1421–1424.
Bruen, T., and D. Bryant, 2006 A subdivision approach to
maxi-mum parsimony. Ann. Combinator. (in press).
Camin, J. H., and R. R. Sokal, 1965 A method for deducing
branch-ing sequences in phylogeny. Evolution19(3): 311–326.
Casella, G., and R. L. Berger, 2001 Statistical Inference.Duxbury Press,
Belmont, CA.
Crandall, K. A., and A. R. Templeton, 1999 Statistical approaches
to detecting recombination, pp. 153–176 inThe Evolution of HIV, edited by K. A. Crandall. Johns Hopkins University Press,
Baltimore.
Drouin, G., F. Prat, M. Elland G. D. Clarke, 1999 Detecting and
characterizing gene conversions between multigene family mem-bers. Mol. Biol. Evol.16(10): 1369–1390.
Fearnhead, P., and P. Donnelly, 2001 Estimating recombination
rates from population genetic data. Genetics159:1299–1318.
Felsenstein, J., 2004 Inferring Phylogenies.Sinauer Associates,
Sun-derland, MA.
Grassly, N. C., and E. C. Holmes, 1997 A likelihood method for
the detection of selection and recombination using nucleotide sequences. Mol. Biol. Evol.14(3): 239–247.
Grassly, N. C., P. H. Harveyand E. C. Holmes, 1999 Population
dynamics of HIV-1 inferred from gene sequences. Genetics151:
427–438.
Griffiths, R. C., and P. Marjoram, 1996 Ancestral inference from
samples of DNA sequences with recombination. J. Comput. Biol.
3(4): 479–502.
Griffiths, R. C., and S. Tavare´, 1998 The age of a mutation in a
general coalescent tree. Stoch. Models14:273–295.
Hagenblad, J., and M. Nordborg, 2002 Sequence variation and
haplotype structure surrounding the flowering time locus FRI inArabidopsis thaliana.Genetics161:289–298.
Haydon, D. T., A. D. S. Bastos and P. Awadalla, 2004 Low
linkage disequilibrium indicative of recombination in foot-and-mouth disease virus gene sequence alignments. J. Gen. Virol.
85:1095–1100.
Hein, J., 1990 Reconstructing evolution of sequences subject to
re-combination using parsimony. Math. Biosci.98(2): 185–200. Hein, J., 1993 A heuristic method to reconstruct the history of
sequences subject to recombination. J. Mol. Evol.36(4): 396– 405.
Hein, J., M. H. Schierupand C. Wiuf, 2005 Gene Genealogies, Variation
and Evolution.Oxford University Press, London/New York/Oxford. Hey, J., 2000 Human mitochondrial DNA recombination: Can it be
true? Trends Ecol. Evol.15(5): 181–182.
Hey, J., and J. Wakeley, 1997 A coalescent estimator of the
popu-lation recombination rate. Genetics145:833–846.
Hill, W., and A. Robertson, 1968 Linkage disequilibrium in finite
populations. Theor. Appl. Genet.33:54–78.
Hudson, R., 1983 Properties of a neutral allele model with
intra-genic recombination. Theor. Popul. Biol.23:183–201.
Hudson, R. R., 2001 Two-locus sampling distributions and their
ap-plication. Genetics159:1805–1817.
Hudson, R. R., and N. L. Kaplan, 1985 Statistical properties of the
number of recombination events in the history of a sample of DNA sequences. Genetics111:147–164.
Huson, D. H., and D. Bryant, 2006 Application of phylogenetic
networks in evolutionary studies. Mol. Biol. Evol.23:254–267. Innan, H., and M. Nordborg, 2002 Recombination or mutational
hot spots in human mtDNA? Mol. Biol. Evol. 19(7): 1122– 1127.
Jakobsen, I. B., and S. Easteal, 1996 A program for calculating and
displaying compatibility matrices as an aid in determining retic-ulate evolution in molecular sequences. Comput. Appl. Biosci.
12(4): 291–295.
Jiggins, F. M., 2002 The rate of recombination in Wolbachia
bacte-ria. Mol. Biol. Evol.19(9): 1640–1643.
Jukes, T. H., and C. R. Cantor, 1969 Mammalian Protein Metabolism,
Vol. III, pp. 21–132. Academic Press, New York/London.
Kimura, M., 1969 The number of heterozygous nucleotide sites
maintained in a finite population due to steady flux of mutations. Genetics61:893–903.
Kingman, J., 1982 The coalescent. Stoch. Proc. Appl.13:235–248.
Kretzer, A. M., and T. D. Bruns, 1999 Use of atp6 in fungal
phy-logenetics: an example from the boletales. Mol. Phylogenet. Evol.
13(3): 483–492.
Kuhner, M. K., J. Yamatoand J. Felsenstein, 2000 Maximum
likeli-hood estimation of recombination rates from population data. Genetics156:1393–1401.
Ladoukakis, E. D., and E. Zouros, 2001 Recombination in animal
mitochondrial DNA: evidence from published sequences. Mol. Biol. Evol.18(11): 2127–2131.
LeQuesne, W. J., 1969 A method of selection of characters in
nu-merical taxonomy. Syst. Zool.18(2): 201–205.
Lewontin, R., 1964 The interaction of selection and linkage. I.
General considerations; heterotic models. Genetics49:49–67.
Martin, D., and E. Rybicki, 2000 RDP: detection of recombination
amongst aligned sequences. Bioinformatics16(6): 562–563.
Martin, Y., G. Gerlach, C. Schlottererand A. Meyer, 2000
Mo-lecular phylogeny of European muroid rodents based on com-plete cytochrome b sequences. Mol. Phylogenet. Evol. 16(1): 37–47.
Massey, F. J., 1951 The Kolmogorov-Smirnov test for goodness of
fit. J. Am. Stat. Assoc.46(253): 68–78.
MaynardSmith, J., 1992 Analyzing the mosaic structure of genes.
J. Mol. Evol.34(2): 126–129.
MaynardSmith, J., and N. H. Smith, 2002 Recombination in
an-imal mitochondrial DNA. Mol. Biol. Evol.19(12): 2330–2332. McGuire, G., and F. Wright, 2000 TOPAL 2.0: improved detection
of mosaic sequences within multiple alignments. Bioinformatics
16:130–134.
McVean, G., P. Awadallaand P. Fearnhead, 2002 A
coalescent-based method for detecting and estimating recombination from gene sequences. Genetics160:1231–1241.
McVean, G. A., 2001 What do patterns of genetic variability reveal
about mitochondrial recombination? Heredity87:613–620. McVean, G. A. T., 2002 A genealogical interpretation of linkage
dis-equilibrium. Genetics162:987–991.
Minin, V. N., K. S. Dorman, F. Fangand M. A. Suchard, 2005 Dual
multiple change-point model leads to more accurate recombina-tion detecrecombina-tion. Bioinformatics21:3034–3042.
Miyashita, N., and C. H. Langley, 1988 Molecular and phenotypic
variation of the white locus region in Drosophila melanogaster.
Genetics120:199–212.
Myers, S. R., and R. C. Griffiths, 2003 Bounds on the minimum
number of recombination events in a sample history. Genetics
163:375–394.
Nielsen, R., 1997 Site-by-site estimation of the rate of substitution
and the correlation of rates in mitochondrial DNA. Syst. Biol.
46(2): 346–353.
Nielsen, R., 2000 Estimation of population parameters and
recom-bination rates from single nucleotide polymorphisms. Genetics
154:931–942.
Penny, D., and M. Hendy, 1986 Estimating the reliability of
evolu-tionary trees. Mol. Biol. Evol.3(5): 403–417.
Piganeau, G., M. Gardnerand A. Eyre-Walker, 2004 A broad
sur-vey of recombination in animal mitochondria. Mol. Biol. Evol.
21(12): 2319–2325.
Posada, D., 2001 Unveiling the molecular clock in the presence of
recombination. Mol. Biol. Evol.18(10): 1976–1978.
Posada, D., 2002 Evaluation of methods for detecting
recombina-tion from DNA sequences: empirical data. Mol. Biol. Evol.
19(5): 708–717.
Posada, D., and K. A. Crandall, 2001 Evaluation of methods for
detecting recombination from DNA sequences: computer simu-lations. Proc. Natl. Acad. Sci. USA98(24): 13757–13762.
Posada, D., and K. A. Crandall, 2002 The effect of recombination
on the accuracy of phylogeny estimation. J. Mol. Evol.54(3): 396– 402.
Rohayem, J., J. Munchand A. Rethwilm, 2005 Evidence of
re-combination in the norovirus capsid gene. J. Virol. 79(8): 4977–4990.
Saitou, N., and M. Nei, 1987 The neighbor-joining method: a new
method for reconstructing phylogenetic trees. Mol. Biol. Evol.
4(4): 406–425.
Sawyer, S., 1989 Statistical tests for detecting gene conversion. Mol.
Biol. Evol.6(5): 526–538.
Schaeffer, S. W., and E. L. Miller, 1993 Estimates of linkage
dis-equilibrium and the recombination parameter determined from segregating nucleotide sites in the alcohol dehydrogenase region ofDrosophila pseudoobscura.Genetics135:541–552.
Schierup, M. H., and J. Hein, 2000a Consequences of
recombina-tion on tradirecombina-tional phylogenetic analysis. Genetics156:879–891.
Schierup, M. H., and J. Hein, 2000b Recombination and the
molec-ular clock. Mol. Biol. Evol.17(10): 1578–1579.
Slatkin, M., 1994 Linkage disequilibrium in growing and stable
Slatkin, M., and R. R. Hudson, 1991 Pairwise comparisons of
mi-tochondrial DNA sequences in stable and exponentially growing populations. Genetics129:555–562.
Sneath, P., M. Sackinand R. Ambler, 1975 Detecting evolutionary
incompatibilities from protein sequences. Syst. Zool. 24(3): 311–332.
Song, Y. S., and J. Hein, 1999 On the minimum number of
recom-bination events in the evolutionary history of DNA sequences. J. Math. Biol.48(2): 160–186.
Suerbaum, S., J. M. Smith, K. Bapumia, G. Morelli, N. H. Smith
et al., 1998 Free recombination withinHelicobacter pylori.Proc. Natl. Acad. Sci. USA95(21): 12619–12624.
Sumida, M., M. Ogataand M. Nishioka, 2000 Molecular
phyloge-netic relationships of pond frogs distributed in the Palearctic region inferred from DNA sequences of mitochondrial 12S ribo-somal RNA and cytochrome b genes. Mol. Phylogenet. Evol.
16(2): 278–285.
Swofford, D. L., 1998 PAUP*. Phylogenetic Analysis Using Parsimony
(*and Other Methods).Sinauer Associates, Sunderland, MA.
Tajima, F., 1989 Statistical method for testing the neutral mutation
hypothesis by DNA polymorphism. Genetics123:585–595.
Tsaousis, A. D., D. P. Martin, E. D. Ladoukakis, D. Posadaand
E. Zouros, 2005 Widespread recombination in published
ani-mal mtDNA sequences. Mol. Biol. Evol.22(4): 925–933.
Uzzell, T., and K. W. Corbin, 1971 Fitting discrete probability
dis-tributions to evolutionary events. Science172:1089–1096. Wall, J. D., 2000 A comparison of estimators of the population
re-combination rate. Mol. Biol. Evol.17(1): 156–163.
Weiller, G. F., 1998 Phylogenetic profiles: a graphical method for
detecting genetic recombinations in homologous sequences. Mol. Biol. Evol.15(3): 326–335.
Weir, B., and W. Hill, 1986 Nonuniform recombination within the
hu-man beta-globin gene cluster. Am. J. Hum. Genet.38(5): 776–781. Wiuf, C., and J. Hein, 2000 The coalescent with gene conversion.
Genetics155:451–462.
Wiuf, C., T. Christensenand J. Hein, 2001 A simulation study of
the reliability of recombination detection methods. Mol. Biol. Evol.18(10): 1929–1939.
Yang, Z., 1993 Maximum-likelihood estimation of phylogeny from
DNA sequences when substitution rates differ over sites. Mol. Biol. Evol.10(6): 1396–1401.
Yang, Z., 1995 A space-time process model for the evolution of DNA
sequences. Genetics139:993–1005.
Yang, Z., 1997 PAML: a program package for phylogenetic
anal-ysis by maximum likelihood. Comput. Appl. Biosci.13(5): 555– 556.
Communicating editor: M. Veuille
APPENDIX A
The normal approximation to the permutation test requires calculation of the expectation and variance of theFw
-statistic under permutations of the alignment. This section contains derivations for both the mean and the variance and outlines how to compute both values efficiently. Again, assume that the proportion of informative sites isqand let
wbe a fixed width (in bases). Throughout this section, letk¼wq.
Let M¼(Mi,j) be a givenn 3 n refined incompatibility matrix. Note that Mis symmetric. Let I ¼ f1, . . .,ng
be an index set. Lets be any permutation of the index set, and define a permutation of the matrix as s(M)¼ (Ms(i),s(j)).
Define the sample spaceVbyV¼ fs(M):s2Sng. Assume that every permutationsis equally likely. Define ann3n
random matrixX:V/Rn3nby
X¼s(M). Note thatXis symmetric, a fact that is used throughout without further mention.
Define for all 1#i#n:fi ¼Pn j¼1
j6¼i
Mi;jandgi¼Pnj¼1 j6¼i
M2
i;j.
Also defineu¼Pn
i¼1fi;v¼
Pn
i¼1gi;andw¼
Pn i¼1ðfiÞ
2 .
Lemma1.Let X be a random matrix. Then for any arbitrary but distinctfi,j,k,lg
E½Xi;j ¼
ðn2Þ!
n! u
E½Xi2;j ¼
ðn2Þ!
n! v
E½Xi;jXi;k ¼
ðn3Þ!
n! ðwvÞ
E½Xi;jXk;l ¼
ðn4Þ!
n! ðu
212v4wÞ:
Proof. Note that a permutationsofIcan be viewed as mapping toI/I. Denote the value ofs(i) bysi. The total
number of permutations is thenn!. The number of permutations that havemdistinct elements fixed in some mapping is (nm)! (e.g.,s(a1)¼b1,s(a2)¼b2,. . .,s(am)¼bm). Since every permutation is equally likely the probability of such a permutation is
ðnmÞ!
Note that every distinct pair (i,j),i6¼jcan be mapped to any distinct pair (a,b),a6¼b, by somes. Note also that Pr[Xi,j¼ Ma,b]¼Pr[sa¼i^sb¼j]. Finally, for notational convenience the summationPna¼1is written as
P
a. Hence,
E½Xi;j ¼ X
a X
b6¼a
Ma;bPr½sa ¼i^sb ¼j
¼X
a X
b6¼a Ma;b
ðn2Þ!
n!
¼ðn2Þ!
n! u
E½Xi2;j ¼ X
a X
b6¼a
Ma2;bPr½sa ¼i^sb ¼j
¼ðn2Þ!
n! v
E½Xi;jXi;k ¼ X
a X
b6¼a X
c6¼a;b
Ma;bMa;cPr½sa ¼i^sb ¼j^sc¼k
¼ðn3Þ!
n!
X
a
ððfaÞ2gaÞ
¼ðn3Þ!
n! ðwvÞ
E½Xi;jXk;l ¼ X
a¼1 X
b6¼a X
c6¼a;b X
d6¼a;b;c
Ma;bMc;dPr½sa ¼i^sb ¼j^sc ¼k^sd ¼l
¼ðn4Þ!
n!
X
a fa
!2
1X
a
ð2ga4ðfaÞ2Þ !
¼ðn4Þ!
n! ðu
212v4wÞ:
n
Consider the statisticFwdefined on a random matrixXas
Fw¼ 2
kð2nk1Þ
Xk
j¼1 Xnj
i¼1 Xi;i1j:
Define (for 1#a,b#n)
Pk¼ fða;bÞ: a,b#a1kg:
Note that
jPkj ¼ ðn1Þ1ðn2Þ;. . .;ðnkÞ ¼
kð2nk1Þ
2 :
Then
Fw¼ 1 jPkj
X
ða;bÞ2Pk Xa;b:
Theorem1.The expectation and variance ofFwcan be written as
E½Fw ¼
ðn2Þ!