DOI: 10.1534/genetics.105.052449
Constructing Genetic Linkage Maps Under a Tetrasomic Model
Z. W. Luo,*
,†,1Ze Zhang,* Lindsey Leach,* R. M. Zhang,
†John E. Bradshaw
‡and M. J. Kearsey*
*School of Biosciences, University of Birmingham, Edgbaston, Birmingham B15 2TT, United Kingdom,†Laboratory of Population and Quantitative Genetics, State Key Laboratory of Genetic Engineering, Fudan University, Shanghai 200433, China and
‡Scottish Crop Research Institute, Invergowrie, Dundee DD2 5DA, United Kingdom
Manuscript received October 14, 2005 Accepted for publication January 11, 2006
ABSTRACT
An international consortium has launched the whole-genome sequencing of potato, the fourth most important food crop in the world. Construction of genetic linkage maps is an inevitable step for taking advantage of the genome projects for the development of novel cultivars in the autotetraploid crop species. However, linkage analysis in autopolyploids, the kernel of linkage map construction, is theoretically challenging and methodologically unavailable in the current literature. We present here a theoretical analysis and a statistical method for tetrasomic linkage analysis with dominant and/or codominant molec-ular markers. The analysis reveals some essential properties of the tetrasomic model. The method accounts properly for double reduction and incomplete information of marker phenotype in regard to the corre-sponding phenotype in estimating the coefficients of double reduction and recombination frequency and in testing their significance by using the marker phenotype data. Computer simulation was developed to validate the analysis and the method and a case study with 201 AFLP and SSR markers scored on 228 full-sib individuals of autotetraploid potato is used to illustrate the utility of the method in map construction in autotetraploid species.
P
OLYPLOIDY has played an important role in theevolution of eukaryotes, particularly flowering plants, and has implications for genetic improvement of many important agricultural crops such as alfalfa, potato, sugarcane, and cotton (Grant 1971; Lewis 1980; Ottoand Whitton2000). In the era of geno-mics, genetic linkage maps exist or are rapidly be-coming available for most important diploid animal and plant species and provide the springboard for genome projects in these species. In sharp contrast, the corresponding study in autopolyploid species is still in its initial stages. As the theoretical kernel of genetic map construction, linkage analysis in this group of spe-cies has been a historical challenge since the years of pioneering quantitative geneticists such as Haldane (1930), Mather (1936), and Fisher (1947). This is largely due to the complexities of gene segregation and recombination during meiosis in such organisms, namely: (i) multiplex allele segregation; (ii) double reduction, a phenomenon in which sister chromatids enter in the same gamete and cause systematic segrega-tion distorsegrega-tion and complex segregasegrega-tion pattern; and (iii) mixed bivalent and quadrivalent pairings among homologous chromosomes.
The current data sets available for linkage analyses in autotetraploids are DNA molecular polymorphisms that
exhibit either dominant (e.g., AFLPs and RAPDs) or co-dominant (e.g., RFLPs and SSRs) segregation in a map-ping population. In addition to the aforementioned complexities (i–iii), challenges in modeling these PCR-based genetic markers involve (iv) occurrence of null alleles due to experimental failure to identify the pres-ence of some alleles and (v) one phenotype representing several genotypes. Linkage analyses of autopolyploids in the current literature have been based either on the use of single-dose (simplex) dominant markers (e.g., AFLPs and RAPDs) that segregate in a simple 1:1 ratio in mapping populations (Wuet al.1992; Meyeret al.1998; Brouwerand Osborn1999; Barcacciaet al.2003) or on assuming solely random bivalent pairing among homologous chromosomes (Ripolet al.1999; Hackett et al.2001; Luoet al. 2001; Bradshawet al.2004; Cao et al.2005). These have effectively avoided the analytical complexities but at the same time ignored some es-sential features of the problems.
Having considered these analytical complexities, we developed a statistical framework for genetic linkage analysis in autotetraploid species (Luoet al.2004). The basis of the analysis is the theoretical model that relates the coefficients of double reduction at two loci with recombination frequency between them. A likelihood-based approach was developed to estimate the model parameters and to test their significance. In this article, the method is elaborated in detail with the aims of in-vestigating the statistical properties of tetrasomic link-age analysis and demonstrating its utility and efficiency 1Corresponding author:School of Biosciences, University of Birmingham,
Edgbaston, Birmingham B15 2TT, United Kingdom. E-mail: [email protected]
in genetic map construction in autotetraploid species. It is illustrated through a case study of constructing ge-netic linkage maps of microsatellite and AFLP markers collected from a mapping population of cultivated au-totetraploid potato (Solanum tuberosum).
METHODS
The current data sets available for linkage analyses in autotetraploids are DNA molecular polymorphisms that exhibit either dominant (e.g., AFLPs and RAPDs) or codominant (e.g., RFLPs and SSRs) segregation in a map-ping population. We have summarized the challenges in tetrasomic linkage analysis with these PCR-based ge-netic markers in the Introduction. Here we illustrate a general method of tetrasomic linkage analysis between two loci, taking all these problems into account. The method analyzes marker phenotypic data (usually gel bands) scored on two autotetraploid parental lines and their offspring at any two marker loci and has the fol-lowing steps:
1. We calculate the probability distribution of all pos-sible parental genotypes that is consistent with the observed phenotypes given the parental phenotypes and phenotypes of their offspring, independently at each of the two loci. A simulation study showed that both the parental genotypes can be correctly iden-tified with a probability of nearly 1.0 even with a modest population size of 100 (Luoet al.2000). At this step, the maximum-likelihood estimate (MLE) of the coefficient of double reduction can be in-dependently worked out at each of the two loci. Whenever there are several probable parental geno-types, the most probable two genotypes will be considered in the next step of linkage analysis. 2. From the predicted parental genotypes at each of two
loci, we can construct two-locus genotypes of the parents by considering all possible linkage phases. For a given pair of parental genotypes, we calculate the probability distribution of offspring genotypes as a function ofl(the probability of a randomly chosen diploid gamete from bivalent pairing), a (the co-efficient of double reduction at the putative locus A), and r (recombination frequency between the two loci) by making use of a computer-based algorithm developed in Luoet al.(2001, 2004). The genotypic distribution is then converted into the phenotypic distribution according to the rules that account for dominance/codominance of markers under ques-tion and the possibility of the null allele at each of the loci.
3. With the phenotypic distribution and the numbers of different phenotypes observed from the mapping population, we developed an EM (expectation-maximization) algorithm to estimate the model pa-rameters and to test their significance on the basis of
a likelihood-ratio test. The algorithm is detailed in methods.
4. We can repeat the above steps 1–3 for all possible parental genotypes (different configurations of alle-lic constitution at each of the two loci and their linkage phase) and make a statistical inference about the most likely model.
Maximum-likelihood estimation of the model param-eters:Here we present a statistical framework to analyze phenotypic data of dominant or codominant markers under the two-locus tetrasomic inheritance model. We have shown that the probability of theith phenotype in the mapping population can be expressed as
fiðl;a;rÞ ¼l2xi0ðrÞ1lð1lÞxi1ða;rÞ1ð1lÞ2xi2ða;rÞ
¼yi0ðl;rÞ1
X1
k¼0
yi1kðl;rÞakð1aÞ1k
1X
2
k¼0
yi2kðl;rÞakð1aÞ2k
¼X
4
j¼0
zijðl;aÞrjð1rÞ4j; ð1Þ
in which the coefficientsxij;yijk;andzijdepend on the model parametersl,a, and/orr. The second subscript ofyijkrefers to the possible number of double-reduction gametes (j ¼ 1, 2). We developed a computer-based algorithm to calculate these parameters for any given pair of parental genotypes, dominance model of marker alleles, and model parameter values. The algorithm first mimics two cases of gametogenesis, respectively, in-volving bivalent and quadrivalent pairing of homolo-gous chromosomes of a given parental genotype. Then gamete genotypes generated from the two parents are paired into all possible offspring genotypes under each of these two pairing cases or a mixture of them. For each of the three possible pairing types, the off-spring genotypes were sorted according to the number of double-reduction gametes if the gametogenesis in-volved quadrivalent chromosomal pairing and the number of recombinant gametes. These offspring ge-notypes are sorted again into phenotype groups by summing up the individuals that turn up in the same phenotype. In parallel with these sorting processes, double-reduction and recombinant statuses for the in-dividuals (also the coefficients of the offspring geno-typic frequencies) within the same phenotype groups are also updated and stored, yielding thexij’s,yijk’s, and zij’s.
If a random sample ofnindividuals is collected from
the mapping population and there are M different
LðG1;G2;VjOÞ}PrfOjG1;G2; Vg
¼ n
n1n2; . . .;nM
fn1
1 f n2
2 ; . . .;fMnM; ð2Þ
whereni(i¼1, 2,. . .,M) is the number of individuals with theith phenotype class in the sample. Since the phenotype data provide only partial information on offspring genotypes, the log-likelihood function can be analyzed with the EM algorithm (Dempsteret al. 1977), a statistical approach appropriate for missing data. The EM algorithm in the present context involves iterating the following two steps from initially given values of parameters:
The E-step calculates the probability of individuals with theith phenotype havingk(k¼0, 1, 2) gametes from meiosis with bivalent chromosome pairing from
gik¼xiklkð1lÞ2k=fiðl;a;rÞ; ð3aÞ
the probability of these individuals carrying ak(k¼0, 1) double-reduction gamete from
jijk¼yijkakð1aÞjk=fiðl; a;rÞ; ð3bÞ
and the probability of having k (k ¼ 0, 1,. . ., 4) recombinant chromosomes from
hik¼zikrkð1rÞ4k=fiðl;a;rÞ; ð3cÞ
wherexij’s,yijk’s, andzij’s are those given in Equation 1.
The M-step updates the model parameters from
ˆ
l¼ 1
2n XM
i¼1
nið2gi21gi1Þ ð4aÞ
ˆ
a¼X
M
i¼1
ni
X2 j¼1
Xj
k¼0
kjijk=X M
i¼1
ni
X2 j¼1
jX
j
k¼0
jijk ð4bÞ
^r ¼ 1 4n
XM
i¼1
ni
X4 j¼1
j3hij: ð4cÞ
Iteration of the two steps generates a series of the pa-rameter estimates, which monotonically converge to local maxima of the log-likelihood function depending on the values used to initiate the algorithm (McLachlan and Krishnan 1997), particularly when parameter l needs to be modeled. Thus, we suggest the use of dif-ferent sets of initial values to search for the maximum-likelihood estimates of the parameters.
Simulation model of multilocus tetrasomic inheri-tance:The simulation model mimics gametogenesis of an autotetraploid individual whose meiosis involves quad-rivalent pairing of homologous chromosomes. The model considersmloci on a chromosome:L1,L2,. . ., Lm. For simplicity, we assume that L1 is the most
proximal to the centromere and Lmis the most distal. There are at most four distinct alleles at any locus of an autotetraploid individual genotype. When quadrivalent pairing forms among homologous chromosomes, cross-ing over can occur between any pair of nonsister chromatids. Sexual differentiation in recombination frequency and interference are assumed to be absent. The gametogenesis is simulated as a Markovian process: the gamete genotype atL1is randomly sampled follow-ing the probability distribution given by
PrfAi1Aj1g ¼ a1=4 i¼j
ð1a1Þ=6 i6¼j; ð5Þ
where a1 is the coefficient of double reduction at the locus. The distribution implies that there are a total of 10 possible gamete genotypes when double reduction occurs and that the number reduces to 6 when double reduction is absent.
Given the gamete genotype at LT being ATi A T j , the probability of the genotype atLT11 beingAT1k 1A
T11
l is
given by
PrfAT11
k AT
11
l jATiAjTg
¼
ð1rTÞ2 i¼k and j ¼l
rTð1rTÞ=3 i¼k and j 6¼l or i6¼k and j¼l
rT2=9 i6¼k and j 6¼l;
8 > < > :
ð6Þ
where rT is the recombination frequency between the lociLTandLT11. The equality in subscripts means that alleles locate on the same chromosomes. We can show that the coefficient of double reduction at the locus LT11is determined by bothaT, the coefficient of double reduction at the locus LT, and r, the recombination frequency between the two loci, through Equation 1 (Luoet al. 2004).
We have described another simulation model that mimics the multiple-locus gametogenesis of an autotet-raploid individual whose meiosis involves bivalent pair-ing only (Luoet al.2001). These two simulation models are programmed into two computer subroutines to generate gametes from any given multilocus tetraploid genotype under either a quadrivalent or a bivalent pairing setting. The gametes are randomly united to form zygotes.
RESULTS
second. If r denotes the recombination frequency between the two loci, we show that the relationship between the two double-reduction coefficients is medi-ated by the recombination frequency in the form of
b¼ ½að34rÞ212rð32rÞ=9 ð7Þ
(Luo et al. 2004). It reveals that any recombination occurring between a locus and the centromere may cause double reduction at that locus. Second, the level of double reduction at a locus is linearly related to that of a linked locus by an extent depending on their recombination frequency. Figure 1 illustrates a numer-ical evaluation of the coefficient of double reduction, b, for various values of a over all possible values of recombination frequency. It shows that the upper limit for the coefficient of double reduction is1
4rather than 1 6
as cited in historical literature (Muller1914; Mather 1935; Bailey 1961) and in more recent publications (Ronfort 1998; Butruille and Boiteux 2000) and that the maximal value of recombination frequency in autotetraploids is 0.75, at which double reduction reaches its highest frequency, rather than 0.5 as in diploid species. With the assumption of a Poisson dis-tribution of crossovers and absence of interference in recombination, we are able to work out a mapping func-tion that is analogous to Haldane’s mapping funcfunc-tion in autotetraploid species as
r ¼3 4ð1e
ð4=3ÞxÞ; ð8Þ
where x is the genetic distance in map units of
centimorgans.
It is not difficult to explain34as the upper limit value of recombination frequency in autotetraploids if one
notes that only one-fourth of the gametes are non-recombinants when two marker loci segregate indepen-dently when a quadrivalent forms at the first division of meiosis. This was also observed in Sved (1964). The
maximum value of 1
6 for the coefficient of double
reduction was originally predicted as the product of two probabilities:1
3, the probability that two homologous
chromosomes with the crossover go to the same pole at the first anaphase, and12, the probability that sister chromatids in the homologous chromosomes enter in the same gamete. However, this prediction is question-able in at least two aspects. First, crossovers may occur between any pair of the four homologous chromosomes when a quadrivalent forms (Welch1962). The proba-bility of1
3would underestimate the probability that two
homologous chromosomes with the crossover go to the same pole at the first anaphase and thus underestimate the upper bound of the double-reduction coefficient. In fact, there has been experimental evidence supporting the coefficient of double reduction in autotetraploid potato being substantially.1
6 (Mather 1936; Haynes
and Douches1993). Second, the prediction ignores the fact that the level of double reduction at a given locus depends on its recombination frequency with the cen-tromere. On this principle, the maximum value of the coefficient of double reduction should coincide with the limit of recombination frequency. The model pre-sented by Equation 7 accounts for these issues properly.
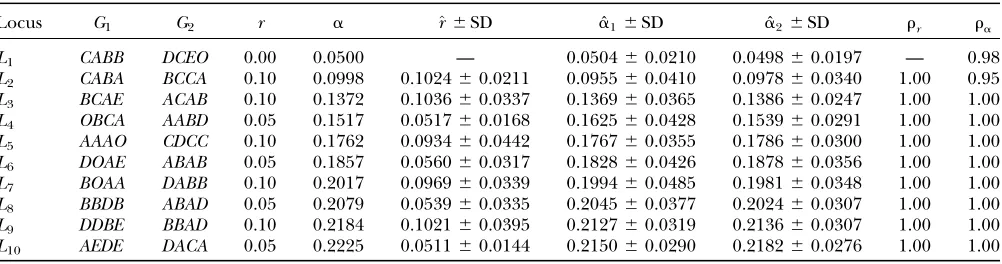
Two-locus tetrasomic linkage analysis: To illustrate the above procedure, we first analyzed simulated data that mimic quadrivalent pairing of homologous chro-mosomes (i.e.,l¼0.0), recombination, and segregation of alleles at 10 linked marker loci. Table 1 lists the simulated values of the coefficient of double reduction at each locus and recombination frequency between adjacent loci. The simulated parental genotypes at each of the marker loci were determined by independently sampling from six possible alleles whose population frequencies were assumed to be 0.3 (alleleA), 0.2 (allele B), 0.2 (alleleC), 0.1 (alleleD), 0.1 (alleleE), and 0.1 (null alleleO), respectively. The coefficient of double reduction was estimated either at step 1 as ˆa1or at step 3 as ˆa2. It can be seen that ˆa2 has a consistently smaller sampling variance than ˆa1, reflecting the fact that the two-locus analysis takes advantage of using information at two linked marker loci. Moreover, the estimates show a pattern of increase in their values as the frequency of recombination increases from the first to the last locus as expected from the theoretical model. It is clear that the recombination frequency is consistently estimated.
We tested for the significance of these parameters against their hypothesized null values (a¼0.0,r¼0.75) separately by approximating the log-likelihood ratio as a chi-square test statistic with 1 d.f. (x2
1). The proportion of the significant test statistic in the repeated simula-tions was calculated as the empirical power for testing the significance of double reduction (ra) and linkage
(rr). The analysis has a statistical power of nearly 1.0 in detecting significance of these parameters in all of the simulated cases studied. However, it is important to explore the effect of the presence of double reduction on the test of linkage because the linkage test is one of the major components in the following map construc-tion. To explore this question, we carried out indepen-dent simulation withrbeing fixed at its boundary value of 0.75 but the double-reduction coefficient having three different values. Table 2 lists the basic statistics of the log-likelihood ratio for the linkage test. It shows that the log-likelihood ratio has the mean, variance, and 95th percentile that are approximately equal to those of x2
1 when double reduction was absent (a ¼ 0.0), as expected. However, in the presence of double reduc-tion, the large sample distribution of the
likelihood-ratio statistic under the null hypothesis (r ¼ 0.75) is equivalent to the case considered by Selfand Liang (1987) that one parameter takes the true value on the boundary of the parameter space and another param-eter has the true value not on the boundary. The likelihood-ratio test statistic in this situation has a mixture distribution of 12x2
11 1 2x
2
2, indicating that the use of a significant threshold based onx2
1 is no longer appropriate for testing linkage. Large variation in the 95th percentile whena.0.0 in Table 2 agrees well with this prediction. Thus, we suggest the use of x2
2 as an approximate distribution for the test statistic of linkage to be conservative. Under the more stringent criterion, rrin Table 1 remains unchanged.
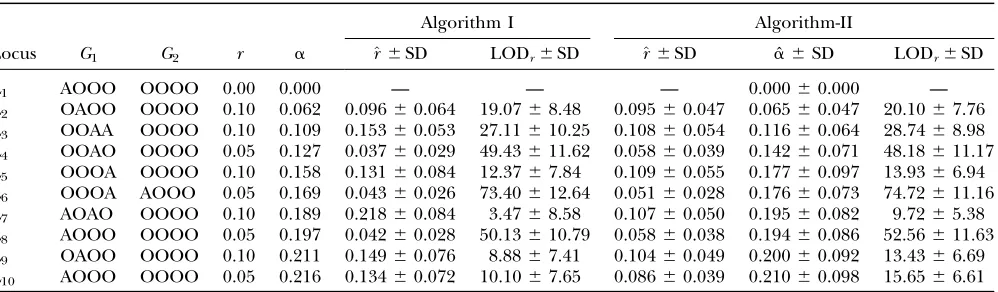
Given that current linkage analyses have been carried out with mostly dominant markers, we explored con-sequences of ignoring double reduction in analyzing dominant marker data. We simulated 10 linked domi-nant markers on which there were varying levels of double reduction due to quadrivalent pairing. The simulated parental genotypes at the marker loci are listed together with other simulated parameters in Table 3. The simulation data were analyzed by algorithm I developed in Luoet al.(2001), which assumes randomly bivalent pairing between homologous chromosomes and thus ignores the presence of double reduction, and by algorithm II that models double reduction. Table 3 also tabulates mean and standard deviation of the maximum-likelihood estimates of the simulated param-eters over 100 repeated simulations of a full-sib pop-ulation comprising 200 individuals. It shows that both algorithms provide comparable estimates of recombi-nation frequency. In addition, algorithm II estimates the coefficient of double reduction adequately. It is seen that algorithm II yields smaller deviation of the recom-bination frequency estimates from the corresponding simulated parameters than algorithm I. The LOD score
TABLE 1
Mean and standard deviation of the maximum-likelihood estimates of recombination frequency and the coefficient of double reduction from 100 replicates of simulation of a full-sib population of 200 autotetraploid individuals
Locus G1 G2 r a ^r6SD aˆ16SD aˆ26SD rr ra
L1 CABB DCEO 0.00 0.0500 — 0.050460.0210 0.049860.0197 — 0.98
L2 CABA BCCA 0.10 0.0998 0.102460.0211 0.095560.0410 0.097860.0340 1.00 0.95
L3 BCAE ACAB 0.10 0.1372 0.103660.0337 0.136960.0365 0.138660.0247 1.00 1.00
L4 OBCA AABD 0.05 0.1517 0.051760.0168 0.162560.0428 0.153960.0291 1.00 1.00
L5 AAAO CDCC 0.10 0.1762 0.093460.0442 0.176760.0355 0.178660.0300 1.00 1.00
L6 DOAE ABAB 0.05 0.1857 0.056060.0317 0.182860.0426 0.187860.0356 1.00 1.00
L7 BOAA DABB 0.10 0.2017 0.096960.0339 0.199460.0485 0.198160.0348 1.00 1.00 L8 BBDB ABAD 0.05 0.2079 0.053960.0335 0.204560.0377 0.202460.0307 1.00 1.00
L9 DDBE BBAD 0.10 0.2184 0.102160.0395 0.212760.0319 0.213660.0307 1.00 1.00
L10 AEDE DACA 0.05 0.2225 0.051160.0144 0.215060.0290 0.218260.0276 1.00 1.00
G1andG2are simulated parental genotypes at the 10 marker loci,randaare the simulated values of recombination frequency between adjacent loci and the coefficient of double reduction. ˆa1is the estimate of double-reduction coefficient obtained by the
single-locus method and ˆa2is the estimate of double-reduction coefficient obtained by the two-locus method.rrandrarepresent the empirical statistical power for testing significance of genetic linkage and double reduction.
TABLE 2
Estimated mean, variance, and 95th percentile of the log-likelihood ratio in the simulation with
recombination frequencyr¼0.75
Marker
locia a ^r6SD Mean Variance
95th percentile
L1–L2 0.00 0.7460.0650 0.9058 2.6070 4.23
L1–L2 0.10 0.7460.0574 0.7487 0.8711 2.53
L1–L3 0.00 0.7460.0600 1.1400 2.7500 4.85
L1–L3 0.05 0.7560.0565 1.0220 2.0871 3.98
L1–L3 0.10 0.7560.0495 0.8410 1.9072 3.14
L1–L4 0.00 0.7460.0521 1.0264 1.6878 3.65
L1–L4 0.05 0.7360.0217 1.3997 2.9630 5.25
L1–L4 0.10 0.7560.0555 1.3068 3.4320 5.66
L1–L6 0.00 0.7560.0504 1.0200 1.8761 3.30
L1–L6 0.05 0.7560.0472 0.9137 3.4365 3.21
L1–L6 0.10 0.7460.0409 0.7302 1.2361 2.95
a
values for testing for significance of linkage between the dominant markers are usually slightly larger from algorithm II than from algorithm I, suggesting that the algorithm properly accounting for double reduc-tion has a better power to test for linkage than the algorithm ignoring double reduction even when dom-inant markers are considered. Moreover, we explored performance of algorithm II in analyzing the simulation data generated from bivalent pairing solely and from a mixture of both bivalent and quadrivalent pairings. The algorithm provides nearly identical estimates of simu-lated recombination frequencies to those from algo-rithm I when double reduction is actually absent and to those from the algorithm when a mixture of bivalent and quadrivalent pairing is modeled. It accurately estimates the linkage parameters but may underesti-mate the degree of double reduction to the extent depending on the proportion of bivalent pairing in the simulated meioses (data not shown). This indicates that the algorithm considering quadrivalent pairing only will not influence adequacy of estimation of recombination frequency even though the mapping population is generated from mixing both bivalent and quadrivalent pairings. The biased estimates of the double-reduction parameter will not influence prediction of genetic maps. We found that to ignore the mixed chromosome pairing by making use of algorithm II will effectively improve robustness of the EM algorithm to converge to the maximum-likelihood estimates of the recombina-tion parameter.
Map construction based on pairwise-locus linkage analysis: There has been cytological evidence that meioses of autotetraploids may involve a mixture of bivalent and quadrivalent pairings of homologous
chromosomes (Swaminathan and Howard 1953;
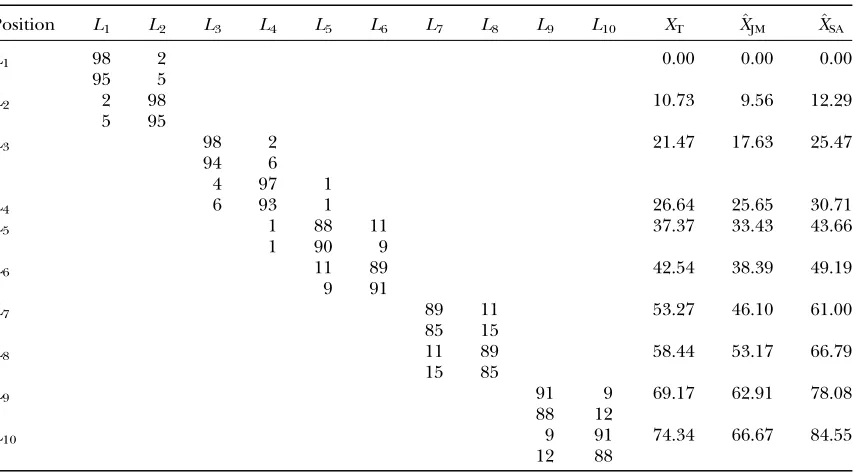
Wallaceand Callows1995; Steinet al.2004). Here we present an analysis of a data set from a computer simulation that mimics the mixed bivalent and quadri-valent pairings of homologous chromosomes at an equal proportion (l¼0.5), recombination and segre-gation of alleles at 10 linked marker loci. The parental genotypes at the linked loci and the other genetic parameters are the same as those in Table 1. Under this scenario, the genotypic distribution in the mapping populations is a mixture of distributions of diploid gamete genotypes from bivalent and quadrivalent chro-mosomal pairings during meiosis. In each of 100 repeated simulation data sets, we obtained the MLEs of the model parametersl,a, andrfor all pairs of the 10 markers, giving 45 different pairs. With the MLEs of r and the corresponding LOD scores, we constructed a genetic linkage map of these linked loci using two different approaches: JoinMap (Stam 1993), a least-squares approach that minimizes the difference be-tween expected and estimated mapping distances, and simulated annealing (Hackett et al. 2003). Table 4 summarizes the frequency of the correctly predicted location for each of the simulated marker loci. It shows that the markers were individually mapped to a correct location order in the linkage map in .90 of 100 repeated simulations. There is a clear decrease in the proportion of the correct location orders predicted fromL1toL10, which is in parallel with the increasing level of double reduction. There is no remarkable difference in the rate of correctly predicted orders of individual markers between the two approaches. How-ever, the JoinMap method yielded 65 linkage maps with all the marker locus orders being correctly recovered, whereas the simulated annealing method achieved only 56 linkage maps of the same kind. Table 4 also tabulates
TABLE 3
Mean and standard deviation of the maximum-likelihood estimates of recombination frequencies and the coefficient of double reduction over 100 replicates of simulation of a full-sib population comprising 200 autotetraploid individuals
Locus G1 G2 r a
Algorithm I Algorithm-II
^r6SD LODr6SD ^r6SD aˆ6SD LODr6SD
L1 AOOO OOOO 0.00 0.000 — — — 0.00060.000 —
L2 OAOO OOOO 0.10 0.062 0.09660.064 19.0768.48 0.095 60.047 0.06560.047 20.1067.76
L3 OOAA OOOO 0.10 0.109 0.15360.053 27.11610.25 0.108 60.054 0.11660.064 28.7468.98
L4 OOAO OOOO 0.05 0.127 0.03760.029 49.43611.62 0.058 60.039 0.14260.071 48.18611.17
L5 OOOA OOOO 0.10 0.158 0.13160.084 12.3767.84 0.109 60.055 0.17760.097 13.9366.94
L6 OOOA AOOO 0.05 0.169 0.04360.026 73.40612.64 0.051 60.028 0.17660.073 74.72611.16
L7 AOAO OOOO 0.10 0.189 0.21860.084 3.4768.58 0.107 60.050 0.19560.082 9.7265.38
L8 AOOO OOOO 0.05 0.197 0.04260.028 50.13610.79 0.058 60.038 0.19460.086 52.56611.63
L9 OAOO OOOO 0.10 0.211 0.14960.076 8.8867.41 0.104 60.049 0.20060.092 13.4366.69
L10 AOOO OOOO 0.05 0.216 0.13460.072 10.1067.65 0.086 60.039 0.21060.098 15.6566.61
the means of estimated genetic distances of the linkage maps in the cases that all markers were predicted with correct location orders. It can be seen that the in-crement in the estimated map distances between adjacent markers agrees well with the simulated values for both methods. The linkage maps constructed from the JoinMap method are shorter than those from the simulated annealing method, reflecting the fact that the former favors a shorter map in the optimization procedure.
Construction of linkage maps with DNA molecular markers in autotetraploid potato:Here we demonstrate the tetrasomic linkage analysis for the construction of genetic linkage maps with dominant and codominant DNA molecular markers in cultivated autotetraploid potato. The marker data set comprised 197 AFLP markers and 4 microsatellite markers scored on 228 offspring from a cross between two parental lines: the advanced potato breeding line 1260lab1 and the culti-var Stirling (Bradshawet al.2004). Some of the AFLP markers were present in one parent and absent in the other and some were present in both parents. Details for developing the markers are described in Isidoreet al. (2003). First, the clustering approach described in Luo et al.(2001) was used to classify all the 201 markers into linkage groups, yielding 11 (rather than the expected 12) groups when a significance level of 1010was used. In other words, a combined map of two parents was
produced. We predicted the most probable genotypes of the parental lines at each of the markers on the basis of marker phenotypes of the parents and their offspring (Luoet al. 2000). The most probable parental genotypes were predicted with a probability of nearly 1.0 ($0.95) at all these marker loci and used as the estimated parental genotypes in the linkage analysis below.
Second, the linkage analysis was carried out within each of the linkage groups on the basis of the analytical algorithm that models only quadrivalent homologous chromosome pairing. This may underestimate the co-efficients of double reduction but will not influence the estimation of the recombination frequency and the pre-diction of the linkage maps as explained in the above simulation study. The analysis considered the two possible orders of putative loci A and B in the model presented above. The LOD score was used to infer the most likely order. Of the 201 markers, 36 showed significant double reduction (3.66#LOD score#21.64). The MLEs of the model parameters and the corresponding LOD scores for all possible pairs of marker loci within each of the linkage groups were estimated.
Finally, we loaded the MLEs of the recombination frequencies for all pairs of marker loci and the corre-sponding LOD scores into JoinMap analysis to work out the map order and map distance of the markers in each of the linkage groups. Figure 2 gives the 11 estimated linkage groups, which have a total map distance of
TABLE 4
Frequency of the correctly predicted location of each marker locus in a simulated genetic linkage map with 10 marker loci from JoinMap ( JM) and simulated annealing (SA), respectively, and the means of
estimated mapping distances from the two methods (XˆJMandXˆSA)
Position L1 L2 L3 L4 L5 L6 L7 L8 L9 L10 XT XJM^ XSA^
L1 98 2 0.00 0.00 0.00
95 5
L2 2 98 10.73 9.56 12.29
5 95
L3 98 2 21.47 17.63 25.47
94 6
4 97 1
L4 6 93 1 26.64 25.65 30.71
L5 1 88 11 37.37 33.43 43.66
1 90 9
L6 11 89 42.54 38.39 49.19
9 91
L7 89 11 53.27 46.10 61.00
85 15
L8 11 89 58.44 53.17 66.79
15 85
L9 91 9 69.17 62.91 78.08
88 12
L10 9 91 74.34 66.67 84.55
12 88
888 cM. The SSR markers on linkage groups 5 and 6 are known to be located on chromosomes 11 and 4, respectively. The other linkage groups cannot be as-signed to known chromosomes, but this was not neces-sary for the purpose of this article. The markers that
mapped together and at the ends of their correspond-ing linkage groups.
DISCUSSION
An international consortium has launched a project to sequence the whole genome of potato, the fourth most important food crop in the world. The project aims at paving the way for the development of novel cultivars comprising a large variety of high performance characteristics, such as disease resistance and processing quality. To achieve the targets, we need a good knowl-edge of genetic control of the quantitative traits. The genome sequence project will yield an abundance of DNA molecular genetic markers for construction of genetic linkage maps of the molecular markers and for mapping the quantitative trait loci (Xieand Xu2000; Hackett et al. 2001), in turn, to facilitate marker-assisted breeding programs. This article provides a statistical method and algorithm for constructing ge-netic linkage maps in autotetraploid species with dom-inant and codomdom-inant genetic markers. The method was demonstrated by a simulation study and by a case study analyzing the phenotype data of 201 AFLP and SSR markers scored on 228 full-sib individuals from crossing two parental lines of tetraploid potato.
Built on the theoretical model of tetrasomic linkage analysis (Fisher 1947; Luo et al. 2004), the method takes appropriate account of essential features of tetra-somic inheritance and various complexities of analyzing marker phenotypic data in autotetraploids. Double reduction, a consequence of quadrivalent pairing and recombination between homologous chromosomes, is one of the distinctive features of tetrasomic inheritance. It causes not only distorted segregation of marker alleles but also a more complicated distribution of offspring genotypes. To avoid the analytical complexity of double reduction in linkage analysis of tetraploids, the current literature on linkage analysis of tetraploids has relied on a random bivalent pairing model (Ripol et al. 1999; Hackettet al. 2001; Luoet al. 2001; Bradshawet al. 2004; Caoet al.2005) or on an oversimplified assump-tion (refer to Luo and Zhang 2005 for details). The methods based on the bivalent pairing model may not be used to analyze the data properly when double reduction does exist. For example, there are a total of 41 possible phenotypes in the offspring of parental lines with genotypes AA/BB/BB/OB and CA/DA/EC/EO when double reduction is present. However, the num-ber reduces to 36 when double reduction is absent. The method presented in this article allows appropriately modeling not only quadrivalent pairing but also a mixture of bivalent and quadrivalent pairings in tetra-somic linkage analysis. In addition, it is well known that double reduction is a position-dependent phenome-non;i.e., the coefficient of double reduction at a locus increases as its distance from the centromere increases.
This raises a theoretical question about the limiting values of the genetic parameters in the tetrasomic model. We demonstrate that the upper limits for the coefficient of double reduction and the recombination frequency are 1
4 and 34, respectively. Butruille and
Boiteux(2000) showed that a level of double reduction as small as 0.04 was able to reduce greatly the equilib-rium frequencies of gametophytic lethal alleles. Given that the upper limit is much greater than the rate cited above, we may anticipate that double reduction is effective in eliminating lethal alleles along autotetra-ploid chromosomes. On the other hand, the recombi-nation frequency in autotetraploids could be as high as
3
4, as opposed to the upper limit of 1
2 in diploids,
sup-porting the observation that the evolution of polyploid genomes was an extremely dynamic process compared to that of diploids (Songet al.1995; Luoet al. 2006).
It must be pointed out that segregation distortion may occur at loci under selection in addition to double reduction in the tetrasomic linkage analysis. Selection may favor particular genotype(s) but double reduction leads to excessive homozygosity when compared to random allelic segregation. However, it may be difficult to distinguish the distortion due to selection from that due to double reduction. The linkage analysis proposed in this article models the double-reduction-caused seg-regation distortion but this does not necessarily mean it models properly the segregation distortion due to selection or other different factors. Thus, it will be useful to develop an appropriate statistical method to test the al-ternative hypotheses of the segregation distortion factors. Built on the theoretical model of double reduction and recombination of genetic markers such as AFLPs, RFLPs, and SSRs in tetrasomic chromosomes, this method accounts for partial information of the pheno-type of the markers in regard to their genopheno-types in mapping populations. A simulation study demonstrated the adequacy of the method in estimating the model parameters and in testing their significance. We ex-ploited the efficiency of the pairwise linkage analysis in map construction by using JoinMap and simulated annealing algorithms and found that the former pro-vided a slightly higher rate of correctly predicting the order of all markers in the simulated linkage group (65% vs. 56%). It should be pointed out that these algorithms search for the optimal map order and distance of genetic markers by using information from pairwise linkage analysis. A multilocus approach like that used in diploids (Landerand Green1987) could be developed on the basis of the two-locus linkage model and the mapping efficiency would be expected to be improved even though tedious algebraic formulation and programming efforts are inevitable.
occurred on 10 of the 11 linkage groups and the markers exhibiting double reduction tended to be at the tips of their linkage groups, revealing the chromosome and loca-tion dependence of the meiotic events. It should be pointed out that it is difficult to infer relative locations of these marker loci in each of the linkage maps to that of the centromere solely on the basis of distribution of double reduction events predicted in the linkage groups. However, this problem could become tractable by in-corporating the markers whose physical map informa-tion is known into the linkage analysis.
The analysis developed in this article can be extended for interval mapping of QTL under a tetrasomic model. In fact, the conditional probability distribution of geno-types at a putative QTL given genogeno-types at its flanking markers can be calculated by making use of the analyt-ical tools developed in the study. Also, given the double-reduction coefficients at the flanking markers and the tested position of QTL given the double-reduction coefficient of its left flanking marker and recombina-tion frequency between the QTL and the marker, the expected coefficient of double reduction at the QTL may be predicted from Equation 7. The conditional probability distribution can thus be worked out as a function of the double-reduction and recombination parameters by modeling gametogenesis at the three loci as a Markovian process described in Equations 5 and 6. All data analyses and computer simulations presented in this article have been programmed in Fortran-90 computer language and are available upon request from the corresponding author.
We thank Christine Hackett for her generosity in providing us with the key subroutine for simulated annealing analysis in this article and Barnaly Pande for kindly providing the molecular marker data. Two anonymous reviewers and the associated editor offered constructive critical comments that have been helpful in improving presentation of this article. This study is supported by research grants from the Bio-technology and Biological Science Research Council and the Natural Environment Research Council of the United Kingdom. Z.W.L. and R.Z. are also supported by China’s National Natural Science Founda-tion (30430380), Basic Research Program (2004CB518605), and Shanghai Science and Technology Committee (04ZR14014).
LITERATURE CITED
Bailey, N. T. J., 1961 Introduction to the Mathematical Theory of Genetic
Linkage.Clarendon Press, Oxford.
Barcaccia, G., S. Meneghetti, E. Albertini, L. Triest and
M. Lucchin, 2003 Linkage mapping in tetraploid willows:
seg-regation of molecular markers and estimation of linkage phases support an allotetraploid structure for Salix alba3Salix fragilis interspecific hybrids. Heredity90:169–180.
Bradshaw, J. E., B. Pande, G. J. Bryan, C. A. Hackett, K. McLean
et al., 2004 Interval mapping of quantitative trait loci for resis-tance to late blight, height and maturity in a tetraploid popula-tion of potato. Genetics168:983–995.
Brouwer, D. J., and T. C. Osborn, 1999 A molecular marker
link-age map of tetraploid alfalfa (Medicago sativaL.). Theor. Appl. Genet.99:1194–1200.
Butruille, D. V., and L. S. Boiteux, 2000 Selection-mutation
bal-ance in polysomic tetraploids: impact of double reduction and
gametophytic selection on the frequency and subchromosomal localization of deleterious mutations. Proc. Natl. Acad. Sci. USA97:6608–6613.
Cao, D. C., B. A. Craigand R. W. Doerge, 2005 A model
selection-based interval-mapping method for autopolyploids. Genetics
169:2371–2382.
Dempster, A. P., N. M. Lairdand D. B. Rubin, 1977 Maximum
like-lihood from incomplete data via EM algorithm (with discussion). J. R. Stat. Soc. Ser. B39:1–38.
Fisher, R. A., 1947 The theory of linkage in polysomic inheritance.
Philos. Trans. R. Soc. Lond. Ser. B23:55–87.
Grant, V., 1971 Plant Speciation.Columbia University Press, New
York/London.
Hackett, C. A., J. E. Bradshawand J. W. McNicol, 2001 Interval
mapping of quantitative trait loci in autotetraploid species. Genetics159:1819–1832.
Hackett, C. A., B. Pandeand G. J. Bryan, 2003 Constructing
link-age maps in autotetraploid species using simulated annealing. Theor. Appl. Genet.106:1107–1115.
Haldane, J. B. S., 1930 Theoretical genetics of autotetraploids.
J. Genet.22:359–372.
Haynes, K. G., and D. S. Douches, 1993 Estimation of the
coeffi-cient of double reduction in the cultivated tetraploid potato. Theor. Appl. Genet.85:857–862.
Isidore, E., H.vanOs, S. Andrzejewski, J. Bakker, I. Barrenaet al.,
2003 Toward a marker-dense meiotic map of the potato ge-nome: lessons from linkage group I. Genetics 165: 2107– 2116.
Lander, E. S., and P. Green, 1987 Construction of multilocus
genetic linkage maps in humans. Proc. Natl. Acad. Sci. USA
84:2363–2367.
Lewis, W. H., 1980 Polyploidy: Biological Relevance. Plenum Press,
New York.
Luo, Z. W., and Z. Zhang, 2005 Commentary on Wu and Ma.
Genetics171:2149–2150.
Luo, Z. W., C. A. Hackett, J. E. Bradshaw, J. W. McNicoland
D. Milbourne, 2000 Predicting parental genotypes and gene
segregation for tetrasomic inheritance. Theor. Appl. Genet.
100:1067–1073.
Luo, Z. W., C. A. Hackett, J. E. Bradshaw, J. W. McNicoland
D. Milbourne, 2001 Construction of a genetic linkage map
in tetraploid species using molecular markers. Genetics 157:
1369–1385.
Luo, Z. W., R. M. Zhangand M. J. Kearsey, 2004 Theoretical basis
for genetic linkage analysis in autotetraploid species. Proc. Natl. Acad. Sci. USA101:7040–7045.
Luo, Z. W., Z. Zhang, R. M. Zhang, M. Pandey, O. Gailinget al.,
2006 Modeling population genetic data in autotetraploid spe-cies. Genetics172:639–646.
Mather, K., 1935 Reductional and equational separation of the
chromosomes in bivalents and multivalents. J. Genet.30:53– 78.
Mather, K., 1936 Segregation and linkage in autotetraploids.
J. Genet.30:287–314.
McLachlan, G. J., and T. Krishnan, 1997 The EM Algorithm and
Extensions.Wiley, New York.
Meyer, R. C., D. Milbourne, C. A. Hackett, J. E. Bradshaw, J. W.
McNicolet al., 1998 Linkage analysis in tetraploid potato and
associations of markers with quantitative resistance to late blight (Phytophthora infestans). Mol. Gen. Genet.259:150–160. Muller, H. J., 1914 A new mode of segregation in Gregory’s
tetra-ploid primulas. Am. Nat.48:508–512.
Otto, S. P., and J. Whitton, 2000 Polyploid incidence and
evolu-tion. Annu. Rev. Genet.34:401–437.
Ripol, M. I., G. A. Churchill, J. A. G.daSilvaand M. Sorrells,
1999 Statistical aspects of genetic mapping in autotetraploids. Gene235:31–41.
Ronfort, J. L., E. Jenczewski, T. Bataillon and F. Rousset,
1998 Analysis of population structure in autotetraploid species. Genetics150:921–930.
Self, S. G., and K. Y. Liang, 1987 Asymptotic properties of
maxi-mum likelihood estimators and likelihood ratio tests under non-standard condition. J. Am. Stat. Assoc.82:605–610. Song, K., P. Lu, K. Tangand T. C. Osborn, 1995 Rapid genome
for polyploid evolution. Proc. Natl. Acad. Sci. USA 92:7719– 7723.
Stam, P., 1993 Construction of integrated genetic linkage maps by
means of a new computer package: JoinMap. Plant J.3:739–744. Stein, J., C. L. Quarin, E. J. Martinez, S. C. Pessinoand J. P. A.
Ortiz, 2004 Tetraploid races of Paspalum notatum show
poly-somic inheritance and preferential chromosome pairing around the apospory-controlling locus. Theor. Appl. Genet.109:186–191. Sved, J. A., 1964 The relationship between diploid and tetraploid
recombination frequencies. Heredity19:585–596.
Swaminathan, M. S., and H. W. Howard, 1953 The cytology and
genetics of the potato (Solanum tuberosum) and related species. Bibliogr. Genet16:1–19.
Wallace, A. J., and R. S. Callows, 1995 Meiotic variation in an
in-tergenomic autopolyploid series. 2. Pairing behavior. Genome
38:133–139.
Welch, J. E., 1962 Linkage in autotetraploid maize. Genetics47:
367–396.
Wu, K. K., W. Burnquist, M. E. Sorrells, T. L. Tew, P. H. Moore
et al., 1992 The detection and estimation of linkage in poly-ploids using single-dose restriction fragments. Theor. Appl. Genet.83:294–300.
Xie, C., and S. Xu, 2000 Mapping quantitative trait loci in tetraploid
populations. Genet. Res.76:105–115.