Translational Selection and Yeast Proteome Evolution
Hiroshi Akashi
1Institute of Molecular Evolutionary Genetics and Department of Biology, Pennsylvania State University, University Park, Pennsylvania 16802
Manuscript received October 11, 2002 Accepted for publication March 14, 2003
ABSTRACT
The primary structures of peptides may be adapted for efficient synthesis as well as proper function. Here, theSaccharomyces cerevisiaegenome sequence, DNA microarray expression data, tRNA gene numbers, and functional categorizations of proteins are employed to determine whether the amino acid composition of peptides reflects natural selection to optimize the speed and accuracy of translation. Strong relationships between synonymous codon usage bias and estimates of transcript abundance suggest that DNA array data serve as adequate predictors of translation rates. Amino acid usage also shows striking relationships with expression levels. Stronger correlations between tRNA concentrations and amino acid abundances among highly expressed proteins than among less abundant proteins support adaptation of both tRNA abundances and amino acid usage to enhance the speed and accuracy of protein synthesis. Natural selection for efficient synthesis appears to also favor shorter proteins as a function of their expression levels. Comparisons restricted to proteins within functional classes are employed to control for differences in amino acid composition and protein size that reflect differences in the functional requirements of proteins expressed at different levels.
T
HE predominant view of protein evolution consid- Akashi1996; Gutie´rrez et al. 1996; Percudani et al. 1997). Although individual amino acid mutations are ers fitness effects of amino acid changes that arisefrom gene-specific relationships between the primary likely to have small effects on overall cellular physiology, global evolutionary forces could underlie proteome-structures of encoded polypeptides and their particular
function(s) (Nei1975;Kimura1983;Li1997). Critical wide patterns of amino acid composition as well as varia-tion in rates of protein evoluvaria-tion.
properties of proteins (i.e., specificity, activity, or
stabil-ity) depend on particular amino acids in specific regions Among microbes, as well as multicellular eukaryotes, synonymous codon usage is coadapted with tRNA pools of their structures. Mutation pressure and genetic drift
to enhance the efficiency of protein synthesis (reviewed determine encoded amino acids and their evolutionary
in Andersson and Kurland 1990; Sharpet al. 1993; divergence at sites where protein function is more
toler-Akashi2001). Among codons recognized by different ant to amino acid replacements.
aminoacyl tRNAs (aa-tRNAs), translationally preferred Selection pressures related to efficient synthesis, rather
codons tend to be recognized by the more abundant than to proper function, of proteins are less firmly
estab-isoacceptor. Among codons recognized by the same lished. Amino-acid-altering mutations could affect
fit-isoacceptor (through “wobble” pairing), preferred co-ness through physiological effects that are independent
dons generally have intermediate codon-anticodon sta-of their effects on protein function. Amino acids may
bility (GrosjeanandFiers1982;Ikemura1985;Yamao vary in the energetic costs of their biosynthesis (
Rich-et al. 1991;Kanayaet al. 1999;Percudani and Otto-mond1970;KarlinandBucher1992;Lobryand
Gau-nello 1999). In Escherichia coli, translation of major tier 1994; Dufton 1997; Craig and Weber 1998;
codons occurs 3- to 6-fold more quickly (Robinsonet Garatand Musto 2000;Jansenand Gerstein 2000;
al. 1984; Varenne et al. 1984; Sorensen et al. 1989) Akashi and Gojobori 2002;Zavala et al. 2002), the
and 10-fold more accurately (PrecupandParker1987) complexity of their biosynthetic pathways (Karlinand
than translation of minor codons. Thus, major codons Bucher1992;Dufton1997;CraigandWeber1998),
allow efficient use of ribosomes and reduce the cost of requirements for limiting resources (Mazeland
Mar-GTP-dependent “proofreading” or rejection of noncog-lie`re1989;Craig et al. 2000; Baudouin-Cornu et al.
nate isoacceptors. In addition, accurate translation re-2001), or the speed and accuracy with which their
isoac-duces the costs of producing dysfunctional peptides re-ceptors are translated (EigenandSchuster1979;
Tri-sulting from misincorporations and processivity errors fonov1987;Shpaer1989; LobryandGautier 1994;
(frameshifting and premature termination). Stronger codon usage bias in highly expressed genes reflects in-creases in the fitness benefits of major codons with the 1Address for correspondence:Department of Biology, 208 Mueller
Labo-number of translation events at a given codon. Major
ratory, Pennsylvania State University, University Park, PA 16802.
E-mail: [email protected] codon preference among synonymous codons was
parent from early examinations of small numbers of their synthesis. Selection for efficient biosynthesis may also constrain protein size; among proteins in the same yeast genes (BennetzenandHall1982;Ikemura1982;
Sharpet al. 1986) and is consistent with large population broad functional category, proteins encoded by highly expressed genes are consistently smaller than those en-sizes and a close relationship between growth rate and
fitness in these microbes. coded by less expressed loci.
Among tRNAs carrying different amino acids, varia-tion in either cellular concentravaria-tions or codon-anticodon
MATERIALS AND METHODS stability could lead to translation selection both within
andamongsynonymous families (Shpaer1989;Lobry Yeast gene sequences:S. cerevisiaeprotein-coding sequences andGautier1994;Akashi1996;Percudaniet al. 1997; and descriptions (Goffeau et al. 1996) were obtained from MortonandSo2000;Akashi2001). Amino acid com- ftp://genome-ftp.stanford.edu/pub/yeast/. Mitochondrial DNA-encoded genes, short coding regions (⬍100 codons), and position is related to gene expression in prokaryotes
genes identified as originating from phage or transposable (Shpaer1989;Yamaoet al. 1991;LobryandGautier
elements were excluded from the analysis. In addition, genes 1994; Gutie´rrez et al. 1996; Akashi and Gojobori with recent common ancestors (paralogs) were identified by 2002;Zavalaet al. 2002), yeast (Ikemura1982;Percu- performing unfiltered BLAST (Altschulet al. 1990) searches daniet al. 1997;Jansen andGerstein 2000), Giardia among all pairs of proteins encoded in the genome. Pairs of protein sequences showing alignments with ⱖ60% identity lamblia(GaratandMusto2000),Caenorhabditis elegans
overⱖ60 amino acids were formed into clusters and one gene (Duret2000), and plant chloroplasts (MortonandSo
from each cluster was included in the analysis. To maintain 2000). Furthermore, amino acids represented by
abun-the sample size of highly expressed loci, abun-the gene with abun-the dant tRNAs tend to be preferentially encoded in highly highest estimate of transcript abundance (see below) was cho-expressed genes (Shpaer 1989; Yamao et al. 1991; sen from each cluster.
Yeast expression data and functional categorization of pro-LobryandGautier1994;Percudaniet al. 1997;Duret
teins:Transcript abundance data fromHolstegeet al. (1998) 2000). However, highly expressed proteins fall into
par-were obtained from http://web.wi.mit.edu/young/expression/ ticular functional categories (i.e., energy metabolism transcriptome.html and protein abundance measures (from and protein synthesis) and tRNA pools could simply 2D gel data) were taken fromFutcheret al. (1999). Functional be adjusted to match the amino acid requirements for categorizations of gene products were obtained from the Yeast Protein Database (YPD; Costanzo et al. 2000; https://www. proper functioning of these proteins (Garel 1974;
incyte.com / proteome / YPDcategories / Functional_Categories. Ikemura 1982; Yamao et al. 1991; Xia 1998; Duret
html). Composite categories were constructed for 1571 genes 2000).
listed in more than one category. Using this criterion, I found In multicellular eukaryotes, tissue-specific tRNA abun- that yeast proteins fall into 259 different functional categories dances have been found in tissues committed to high (including “unknown”) and 128 of the categories contain a single gene. Only genes listed in both the YPD and the Hols-expression of a small number of genes. tRNA
concentra-tege transcript abundance database were included in the analy-tions match amino acid usage of fibroin in the posterior
ses. Of the 6310 predicted yeast protein-coding genes, 5483 silk gland of the silkwormBombyx moriL. and crystallines
were included in the final data set (see supplemental material in the calf lens (Garel1974) and hemoglobin in rabbit at http://www.genetics.org/supplemental/).
and human reticulocytes (Hatfieldet al. 1982).Garel Sequence and expression data for C. elegans, Drosophila melanogaster, Bacillus subtilis, and E. coli: Coding sequences (1974) proposed “functional adaptation of tRNA”;
selec-and estimates of transcript abundances [from matches to ex-tion for efficient translaex-tion regulates cellular tRNA
pressed sequences tag (EST) libraries] for C. elegansand D. isoacceptor concentrations to match the amino acid
melanogaster(Maraiset al. 2001) were obtained from http:// requirements of highly expressed proteins but does not pbil.univ-lyon1.fr/datasets/Marais2001/data.html. Short cod-affect their composition or evolutionary rates. ing regions (⬍100 codons) and genes identified as originating This study attempts to distinguish between unidirec- from phage or transposable elements were excluded from the analysis. Single members of each family of paralogs were tional adjustments of tRNA pools to the amino acid
included as described above. Genes that were not listed in the requirements of highly expressed genes and
coadapta-Maraiset al. (2001) expression data files were not included tion of both isoacceptor concentrationsandamino acid in the analysis. A total of 11,546 and 11,864 predicted genes usage in the budding yeast, Saccharomyces cerevisiae. were analyzed fromD. melanogasterandC. elegans, respectively. Strong associations between synonymous codon usage E. coliandB. subtilisdata are described inAkashiand
Gojo-bori(2002). and oligonucleotide DNA array estimates of mRNA
lev-Identification of major codons:Major codon usage (MCU) els suggest that estimates of transcript abundance
pro-was calculated as (number of major codons)/(number of ma-vide informative predictors of the translation rates of
jor codons⫹number of minor codons). Identities of major genes. Usage of several amino acids shows associations codons forS. cerevisiaewere taken fromKanayaet al. (1999) with gene expression, and changes in amino acid com- except for glutamic acid [the major codon was identified as GAA in Ikemura (1982)]. Major codons were taken from position result in stronger correlations between amino
Akashi(1995) forD. melanogaster,Duret(2000) forC. elegans, acid usage and tRNA abundances in highly expressed
and Kanayaet al. (1999) forE. coliandB. subtilis[with modifi-genes than in less expressed loci. Similar relationships
tional steps. Major codons for the two serine families were identified as those showing significant positive correlations with either gene expression [S. cerevisiae (Table 1) and C. elegans] or major codon usage for nonserine families (E. coli
andB. subtilis).
Analyses of whole-genome data: Spearman rank correla-tions were employed in the whole-genome analyses. Because abundances for some codons and amino acids are quite low, analyses were conducted on binned data. Genes were ranked by theHolstegeet al. (1998) estimates of transcript abun-dance and data were pooled for genes with low to high tran-script abundance until 5000 codons were reached for each bin (all genes with identical expression estimates were included in the same bin). The numbers of genes in low expression bins were elevated by large numbers of identical estimates of
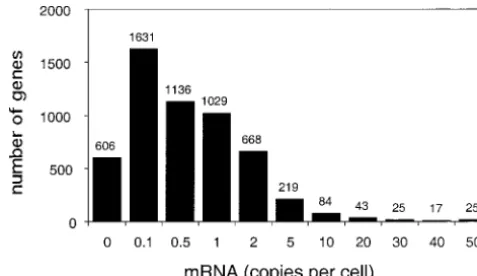
tran-Figure 1.—Distribution of transcript abundances of yeast script abundance. For statistical analyses, codon and amino
genes. Data are fromHolstegeet al. (1998). The first column acid usages were compared among 65 expression classes
con-plots the number of genes with no detectable transcripts. taining an average of 84 genes each. Bins of 50,000 codons
Other columns plot the numbers of genes with transcript were employed for visualization of trends (Figures 2, 3, 4,
abundances between a lower limit shown below the columns and 6).
and an upper limit shown beneath the column to the right Analyses within functional categories:Within functional
cat-(the last column has no upper limit). egories, amino acid usage was compared between genes falling
above and below a cutoff of one transcript per cell. Amino acid abundances were compared in 2⫻2 contingency tables;
the columns of the tables were the high and low expression cules (Hereford and Rosbash 1977). Figure 1 plots classes and the rows consisted of the counts of a particular the distribution of transcript abundances among yeast amino acid and the pooled counts for all other amino acids.
genes from the high-density oligonucleotide array data The Mantel-Haenszel procedure (Snedecor and Cochran
ofHolstegeet al. (1998) from yeast cells grown to mid-1989) was employed to calculate an overall probability for
departures from equal amino acid usage among low and high log phase in YPD media. The distribution of transcript expression genes across contingency tables from different abundance is strongly skewed toward low values;⬎80% functional categories. Thirty-one functional categories con- of genes are represented byⱕ2 mRNA molecules and tainingⱖ10 genes in both expression classes were included
only 3.5% of genes have transcript abundances ofⱖ10 in the analysis. “Unknown” was not included as a functional
mRNA molecules per cell.Futcheret al. (1999) found category.
The proportion of amino acids falling within “low complex- good correspondence between 2D gel quantifications ity” regions was analyzed in a similar manner. The rows of of protein concentrations (ranging from 200 to 2⫻106
2⫻2 contingency tables consisted of the numbers of codons molecules/cell) and estimates of transcript abundances. that fall within and outside of low complexity regions
identi-They estimate a rate of protein synthesis of roughly 4000 fied by the SEG and SEGN programs (Woottonand
Feder-proteins/transcript for genes represented byⱖ1 mRNA
hen1996) using default parameter settings. The columns were
the low- and high-expression classes and Mantel-Haenszel tests molecule/cell. For proteins represented by⬍1 mRNA/ were conducted as described above. cell, they suggest post-transcriptional regulation; i.e., Mann-WhitneyU-tests (SnedecorandCochran1989) were mRNA abundances are not informative predictors of employed to test for differences in the mean gene lengths
translation rates. of highly and lowly expressed genes within each functional
Synonymous codon usage was examined among ex-category.Zvalues of Mann-WhitneyU-tests were assigned
posi-tive and negaposi-tive signs for higher and lower mean ranks of pression classes to determine the strength of correspon-size among highly expressed proteins. To test for a consistent dence between GeneChip estimates of transcript abun-trend among categories, a Wilcoxon ranked signs test statistic dances and the translation rates of genes. Under major was calculated for the signedZvalues. A null distribution of
codon preference, the fitness benefit of a major codon the test statistic was generated by 106 iterations of random
is strongly dependent on the number of translation assignment of sign (withP⫽0.5) to eachZvalue and
recalcula-tion of the test statistic. events experienced at a given codon. Coghlan and
Yeast tRNA abundances:Ikemura(1982) quantified cellu- Wolfe (2000) found that ⬍40% of the variation in lar abundances for 22 yeast tRNAs using 2D gel electrophore- ranks of measures of codon bias among yeast genes sis. The correlation between these measurements and the copy
was explained by transcript abundance (Spearman rank numbers of the corresponding tRNA genes in theS. cerevisiae
correlation,rs⫽ 0.62). However, correlations between
genome (Percudani et al. 1997) is remarkably high (r2 ⫽
0.803). To include all 41 isoaccepting tRNAs in the analyses, major codon usage and transcript abundance are re-the gene copy numbers ofPercudaniet al. (1997) were em- markably high in comparisons among bins of genes ployed as estimates of tRNA abundances. with similar expression estimates (Akashi2001; Table 1; Figure 2). Similar patterns among synonymous families that differ in the favored nucleotide in the third codon RESULTS
position (G-favored: Lys, Leu; A-favored: Pro, Gln; T-favored: Gly; C-favored: Phe, Tyr, His, Asn, Asp)
sug-Transcript abundance and translation rates in yeast:
mole-TABLE 1
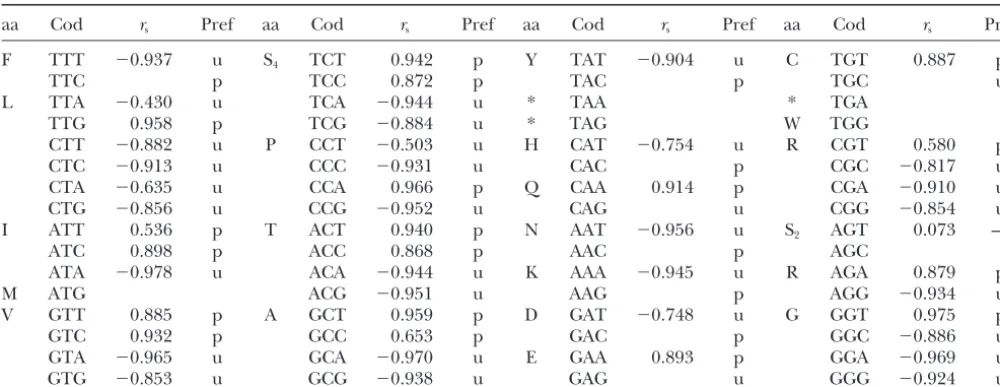
Transcript abundance and synonymous codon usage inS. cerevisiae
aa Cod rs Pref aa Cod rs Pref aa Cod rs Pref aa Cod rs Pref
F TTT ⫺0.937 u S4 TCT 0.942 p Y TAT ⫺0.904 u C TGT 0.887 p
TTC p TCC 0.872 p TAC p TGC u
L TTA ⫺0.430 u TCA ⫺0.944 u * TAA * TGA
TTG 0.958 p TCG ⫺0.884 u * TAG W TGG
CTT ⫺0.882 u P CCT ⫺0.503 u H CAT ⫺0.754 u R CGT 0.580 p
CTC ⫺0.913 u CCC ⫺0.931 u CAC p CGC ⫺0.817 u
CTA ⫺0.635 u CCA 0.966 p Q CAA 0.914 p CGA ⫺0.910 u
CTG ⫺0.856 u CCG ⫺0.952 u CAG u CGG ⫺0.854 u
I ATT 0.536 p T ACT 0.940 p N AAT ⫺0.956 u S2 AGT 0.073 —
ATC 0.898 p ACC 0.868 p AAC p AGC
ATA ⫺0.978 u ACA ⫺0.944 u K AAA ⫺0.945 u R AGA 0.879 p
M ATG ACG ⫺0.951 u AAG p AGG ⫺0.934 u
V GTT 0.885 p A GCT 0.959 p D GAT ⫺0.748 u G GGT 0.975 p
GTC 0.932 p GCC 0.653 p GAC p GGC ⫺0.886 u
GTA ⫺0.965 u GCA ⫺0.970 u E GAA 0.893 p GGA ⫺0.969 u
GTG ⫺0.853 u GCG ⫺0.938 u GAG u GGG ⫺0.924 u
Spearman rank correlation coefficients,rs, are shown for usage of each codon within its synonymous familyvs. average transcript
abundance among genes grouped by expression estimates (bin size, 5000 codons). All correlations were statistically significant after Bonferroni sequential correction for multiple tests (Rice 1989) except for codons in the S2, serine twofold, family. p,
preferred codons, those that increase in frequency in highly transcribed genes; u, unpreferred codons, those that decrease in frequency.
(among binned genes) and that translation selection is genes (Figure 3). These patterns correspond to differ-ences in the numbers of tRNA genes (presumably re-sufficient to overcome mutational biases associated with
transcription (Datta and Jinks-Robertson 1995; sulting in higher tRNA abundances) that recognize the twofold and fourfold families for these amino acids. Moreyet al. 2000) and substitutional biases associated
with gene conversion (Gerton et al. 2000; Birdsell Translational selection appears to discriminate among synonymous codons recognized by nonoverlapping 2002). Codon preferences determined using microarray
estimates of transcript abundance are consistent with groups of tRNAs. Similar preferences may also bias the usage of codons that encode different amino acids. those established through correspondence analysis of
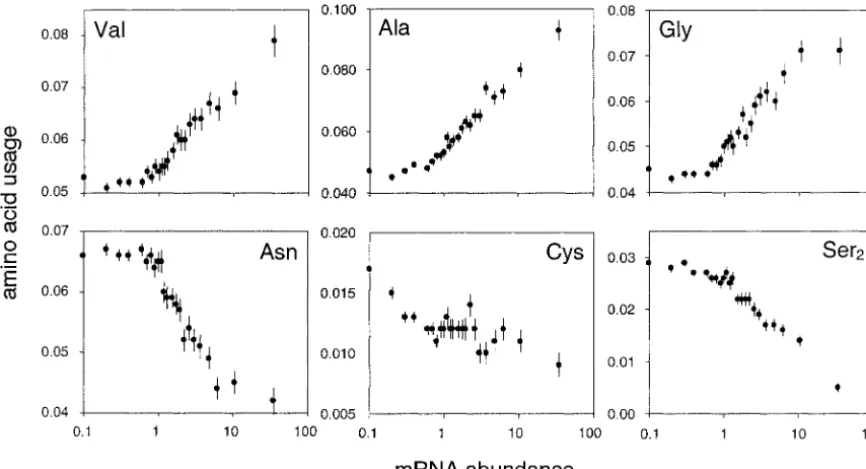
codon usage (Sharp and Cowe 1991; Kanaya et al. Gene expression and amino acid composition in yeast: Abundances for a number of amino acids are 1999).
Seven of the twofold synonymous families (all NNY strongly correlated with gene expression levels (Table 2). The magnitude of changes in abundance can be types) are recognized by a single isoacceptor through
wobble pairing at the third codon position. Six of these quite large; alanine usage increases by greater than two-fold in highly expressed genes and serine twotwo-fold co-families (Asn, Asp, Cys, His, Phe, and Tyr) show steady
increases in usage of a single codon in highly transcribed dons are only one-third as abundant in highly expressed genes (Figure 4).
genes (Table 1; Figure 2). Such patterns are consistent
with translational selection for codon-anticodon stabil- InS. cerevisiae, estimates of transcript abundance show strong positive associations with the frequency of mei-ity (Grosjeanet al. 1978;Percudani andOttonello
1999). otic double-strand breaks, a measure of local
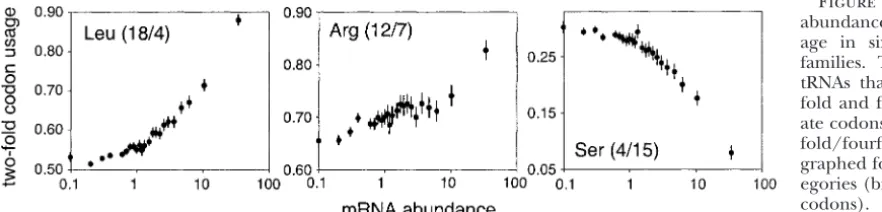
recombina-tion rate (Gertonet al. 2000;Birdsell2002). The latter Codon usage for amino acids encoded by sixfold
re-dundant codons provide the clearest evidence for trans- is also positively correlated with both intergenic and third position GC content (Birdsell2002), suggesting lational preferences related to tRNA abundances. Third
codon position wobble rules for eukaryotes are ambigu- that biased gene conversion elevates G ⫹ C content. However, associations between amino acid usage and ous (Percudani2001), but wobble pairing is not known
to occur at the first codon position. Thus, fourfold and estimates of recombination rate are considerably smaller than associations with transcript abundance (data avail-twofold redundant families for Leu, Arg, and Ser are
recognized by nonoverlapping sets of tRNAs. Usage of able from H. Akashi).
The interpretation of relationships between gene ex-twofold codons for Leu (rs⫽0.933,P⬍10⫺5) and Arg
(rs ⫽ 0.558,P ⬍ 10⫺5) increases dramatically whereas pression and amino acid composition is less
straightfor-ward than that for similar associations among synony-twofold codons for Ser decrease (rs⫽ ⫺0.897,P⬍10⫺5)
Figure 2.—Transcript abun-dance and major codon usage. Data are graphed for expression catego-ries (bin sizes ⱖ50,000 codons). Abundances are within synonymous families.
differences in the functional roles of proteins expressed amino acid composition was compared among genes classified into common functional categories in the at different levels (Garel1974;Ikemura1982;Yamao
et al. 1991;Xia1998;Duret2000). For example,Jansen Yeast Proteome Database (Costanzoet al. 2000). Table 3 shows the 31 different categories containing at least and Gerstein (2000) showed that transcript
abun-dances are higher for cytosolic proteins than for mem- 10 genes in both the low (one or less transcript per cell) and the high (more than one transcript per cell) brane proteins in yeast. Greater usage of hydrophobic
residues in less expressed proteins may reflect a greater expression classes. There are clear differences in expres-sion patterns among these categories; transcription fac-abundance of transmembrane regions. To control for
Figure 3.—Transcript abundance and codon us-age in sixfold redundant families. The numbers of tRNAs that recognize two-fold and fourtwo-fold degener-ate codons are shown (two-fold/fourfold). Data are graphed for expression cat-egories (bin sizesⱖ5⫻104
codons). Abundances are within synonymous families.
represented by few transcripts. Two classes of more expressed genes may simply be those required for proper functioning of ribosomal proteins and cytosolic abundant transcripts encode oxidoreductases,
includ-ing enzymes of central metabolism and amino acid bio- enzymes.
For analyses within the 31 functional categories, synthesis, and proteins involved in translation, such as
ribosomal proteins and elongation factors. Transcript amino acid usage was compared between low- and high-expression classes in 2⫻2 contingency tables. Table 2 abundances for these classes are consistent with
esti-mates of 200,000 ribosomes/cell in rapidly growing shows, for each amino acid, the number of individually significant 2 ⫻ 2 tests as well as the probability of the yeast (Warner1999) and 2,000,000 molecules/cell for
some glycolytic enzymes (Futcher et al. 1999). Thus, overall trend across tables. With cutoff values of two, three, and four transcripts per cell to divide high- and amino acids that are employed more often in highly
TABLE 2
Gene expression and amino acid composition in yeast
Fun cat (31) tRNA
Amino acid gene no. Codons Usage All genes (rs) Gtest Z
Ala 16 GCN 0.054 0.930* 22/0 24.99*
Gly 21 GGN 0.049 0.849* 20/0 21.74*
Val 18 GTN 0.056 0.847* 9/0 11.06*
Thr 16 ACN 0.058 0.140 1/1 0.81
Lys 21 AAR 0.074 0.133 1/3 ⫺0.38
Glu 16 GAR 0.066 0.096 5/3 2.83*
Tyr 8 TAY 0.033 ⫺0.055 1/6 ⫺4.55*
Met 5 ATG 0.019 ⫺0.106 3/0 1.21
Arg 19 CGN, AGR 0.045 ⫺0.123 2/4 ⫺2.94*
Pro 12 CCN 0.043 ⫺0.159 2/4 ⫺1.83
Trp 6 TGG 0.010 ⫺0.179 2/0 0.41
Asp 15 GAY 0.059 ⫺0.245 5/1 3.83*
Phe 10 TTY 0.045 ⫺0.325 2/2 ⫺2.93*
Ser4 15 TCN 0.066 ⫺0.359* 2/4 ⫺2.57
Cys 4 TGY 0.013 ⫺0.478* 2/5 ⫺5.52*
His 10 CAY 0.022 ⫺0.508* 1/4 ⫺2.8*
Gln 7 CAR 0.040 ⫺0.508* 3/3 1.3
Ile 15 ATH 0.066 ⫺0.540* 0/8 ⫺7.97*
Leu 21 TTR, CTN 0.097 ⫺0.847* 0/8 ⫺11.76*
Ser2 4 AGY 0.025 ⫺0.892* 0/18 ⫺15.48*
Asn 10 AAY 0.062 ⫺0.911* 0/17 ⫺15.42*
tRNA gene copy numbers are fromPercudaniet al. (1997). The numbers are pooled among genes encoding isoacceptors for each amino acid. Frequency of usage of amino acids in the genome is shown. Amino acids are listed in order of decreasing Spearman rank correlations, rs, in all gene analyses among 65 expression
classes (bin sizeⱖ5000 codons). Functional category (fun cat) analyses were conducted among 31 categories with at least 10 genes in the high- and low-expression groups, using a cutoff of one transcript per cell. Amino acid composition was compared in 2 ⫻ 2 contingency tables for each amino acid within each functional category.Gtest shows the numbers of tables with higher/lower abundance in the high expression class (G
Figure 4.—Transcript abundance and amino acid usage. Data are graphed for expression categories (bin sizesⱖ5 ⫻ 104
codons). Abundances are among all codons.
low-expression classes, the numbers of functional cate- that experience few translation events will be under little or no selection for translationally preferred codons gories with at least 10 genes in each expression class
reduce to 21, 15, and 11, respectively. However, the (among either synonymous or nonsynonymous alterna-tives). Thus, relationships between tRNA abundance main trends of amino acid usage are robust to these
cutoff values; Mantel-Haenszel test statistics remain sig- and amino acid usage should show substantial scatter. However, under translational selection, the magnitude nificantly positive for Val, Ala, Gly, and Glu and negative
for Phe, Leu, Ile, His, Asn, Cys, and Ser2for cutoff values of fitness differences among codons recognized by rare
and common isoacceptors should increase as a function between one and four transcripts per cell.
Several amino acids show strong statistical associa- of gene expression levels. Such fitness differences may exist among nonsynonymous as well as synonymous al-tions with expression levels in both whole-genome and
within-category analyses. Ala, Val, and Gly show strong ternatives. In highly expressed genes, translational selec-tion at posiselec-tions of peptides otherwise determined increases in abundance in highly expressed genes,
whereas Leu, Ser2, and Asn show strong declines (Figure largely by mutation drift will result in greater
correspon-dences between amino acid usage and tRNA 4). For such amino acids, changes in the relative
abun-dances of different types of proteins in different expres- dances.
Figure 6 shows that the Pearson product-moment cor-sion classes are unlikely to explain relationships between
amino acid usage and expression levels. These patterns relation coefficient between amino acid usage and tRNA gene numbers increases steadily as a function of gene are consistent withJansenandGerstein’s (2000)
find-ings through comparison of amino acid composition of expression levels (5000 codons/bin,rs⫽0.68,Z⫽6.39,
P⬍ 10⫺5). Plots are shown for bins of 50,000 codons.
the yeast genome and transcriptome (amino acid usage
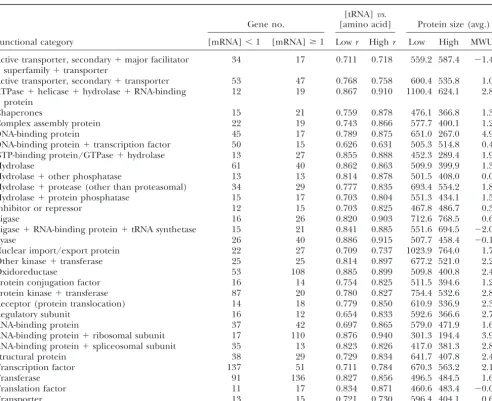
for a given gene was weighted by estimates of its tran- Stronger correlations between amino acid usage and tRNA gene copy numbers in highly expressed proteins script abundance). However, results for some amino
acids (Gln, Ser4, Arg, Glu, and Tyr) differ between the within functional categories (Table 3) support the
con-tribution of translational selection in determining the all-gene and within-category analyses. Such patterns
could reflect differences in the functional requirements amino acid composition of proteins (Wilcoxon ranked signs test,P ⬍10⫺5).
of genes in different expression classes or differences
in the statistical power of the two approaches. In either Gene expression and protein size:Given some toler-ance of protein function to insertion/deletion variation, case, these amino acids show small differences in
abun-dance between lowly and highly expressed genes. translational selection will favor reductions in protein size (Akashi 1996). Eliminating codons from a given
Amino acid usage and tRNA abundances:
Relation-ships between amino acid usage and tRNA gene num- gene will reduce the amount of time that ribosomes spend translating its transcripts and enhance the overall bers for yeast genes with low, intermediate, and high
En-TABLE 3
Analyses within yeast protein functional categories: expression levels and tRNA vs. amino acid usage and protein sizes
[tRNA]vs.
Gene no. [amino acid] Protein size (avg.)
Functional category [mRNA]⬍1 [mRNA]ⱖ1 Lowr Highr Low High MWUZ
Active transporter, secondary⫹major facilitator 34 17 0.711 0.718 559.2 587.4 ⫺1.40 superfamily⫹transporter
Active transporter, secondary⫹transporter 53 47 0.768 0.758 600.4 535.8 1.05
ATPase⫹helicase⫹hydrolase⫹RNA-binding 12 19 0.867 0.910 1100.4 624.1 2.84
protein
Chaperones 15 21 0.759 0.878 476.1 366.8 1.35
Complex assembly protein 22 19 0.743 0.866 577.7 400.1 1.22
DNA-binding protein 45 17 0.789 0.875 651.0 267.0 4.96
DNA-binding protein⫹transcription factor 50 15 0.626 0.631 505.3 514.8 0.42
GTP-binding protein/GTPase⫹hydrolase 13 27 0.855 0.888 452.3 289.4 1.92
Hydrolase 61 40 0.862 0.863 509.9 399.9 1.33
Hydrolase⫹other phosphatase 13 13 0.814 0.878 501.5 408.0 0.08
Hydrolase⫹protease (other than proteasomal) 34 29 0.777 0.835 693.4 554.2 1.83
Hydrolase⫹protein phosphatase 15 17 0.703 0.804 551.3 434.1 1.51
Inhibitor or repressor 12 15 0.703 0.825 467.8 486.7 0.39
Ligase 16 26 0.820 0.903 712.6 768.5 0.60
Ligase⫹RNA-binding protein⫹tRNA synthetase 15 21 0.841 0.885 551.6 694.5 ⫺2.05
Lyase 26 40 0.886 0.915 507.7 458.4 ⫺0.12
Nuclear import/export protein 22 27 0.709 0.737 1023.9 764.0 1.75
Other kinase⫹transferase 25 25 0.814 0.897 677.2 521.0 2.22
Oxidoreductase 53 108 0.885 0.899 509.8 400.8 2.42
Protein conjugation factor 16 14 0.754 0.825 511.5 394.6 1.21
Protein kinase⫹transferase 87 20 0.780 0.827 754.4 532.6 2.89
Receptor (protein translocation) 14 18 0.779 0.850 610.9 336.9 2.36
Regulatory subunit 16 12 0.654 0.833 592.6 366.6 2.79
RNA-binding protein 37 42 0.697 0.865 579.0 471.9 1.66
RNA-binding protein⫹ribosomal subunit 17 110 0.876 0.940 301.3 194.4 3.92
RNA-binding protein⫹spliceosomal subunit 35 13 0.823 0.826 417.0 381.3 2.80
Structural protein 38 29 0.729 0.834 641.7 407.8 2.41
Transcription factor 137 51 0.711 0.784 670.3 563.2 2.18
Transferase 91 136 0.827 0.856 496.5 484.5 1.63
Translation factor 11 17 0.834 0.871 460.6 483.4 ⫺0.05
Transporter 13 15 0.721 0.730 596.4 404.1 0.62
Functional categorizations are from the Yeast Protein Database (Costanzoet al. 2000). The numbers of genes in low (less than transcript per cell) and high (one or more transcripts per cell) expression groups are shown. Pearson product-moment correlation coefficients,r, for relationships between tRNA gene copy numbers (Percudaniet al. 1997) and amino acid abundances are shown for the two expression classes within each functional category. Average sizes of proteins were compared among the high- and low-expression classes.Zstatistics from the Mann-WhitneyU-test (MWUZ) are shown (positive values indicate lower mean ranks of size among highly expressed proteins).
ergy expenditure for both amino acid and protein syn- 27 show a higher mean rank of protein size among the less highly expressed proteins and 4 deviate in the thesis will also be reduced. The magnitude of time and
energy savings, and, consequently, the fitness advantage opposite direction (Table 3). Mann-Whitney U-tests show significant departures at the 5% level (prior to of protein size reduction will be a function of the
num-ber of times a given gene is translated. correction for multiple tests) for 12 of the 31 classes; highly expressed proteins are smaller in 11 of these 12 Negative correlations between gene length and both
synonymous codon bias (MoriyamaandPowell1998) classes. Overall, highly expressed genes tend to encode smaller proteins than do less expressed proteins in the and transcript abundance (CoghlanandWolfe2000;
JansenandGerstein2000;Palet al. 2001b) have been same functional category (Wilcoxon ranked signs test, P ⬍10⫺5). Protein length is also negatively correlated
found among yeast genes. However, previous studies
did not control for differences in the functional require- with 2D gel quantifications of abundance for 64 proteins (Futcheret al. 1999) from cells grown on both glucose ments of proteins among expression classes, such as
the lack of highly expressed transmembrane proteins. (rs⫽ ⫺0.47,P ⬍ 10⫺4) and ethanol (rs⫽ ⫺0.33, P ⬍
Figure 5.—Correlations between amino acid usage and tRNA gene copy numbers. tRNA gene copy numbers are from
Percudaniet al. (1997). The numbers are pooled among genes encoding isoacceptors for each amino acid.
To determine whether low complexity nucleotide se- B. subtilis(AkashiandGojobori2002), andC. elegans (our unpublished data) proteins.
quences (including homonucleotide runs and short re-peats) contribute to differences in protein sizes among expression classes, simple sequences were identified
us-ing the SEGN software (Wootton and Federhen DISCUSSION
1996). Of the 31 functional categories, 21 show a higher
Establishing translational selection in protein
evolu-percentage of simple sequences in less expressed
pro-tion:Major codon preference posits adaptation of both teins and 10 deviate in the opposite direction. A
Mantel-tRNA concentrations and synonymous codon usage. Haenszel test shows significantly lower proportions of
Regulation of aa-tRNA abundances may result from rela-simple nucleotide sequences in highly expressed
pro-tively few, strongly selected mutations. However, codon teins (Z ⫽ 12.29, P ⬍ 10⫺5). However, this reduction
usage bias results from weak selection at thousands of in simple sequences does not account entirely for the “silent” sites throughout the genome (reviewed in smaller sizes of highly expressed proteins; differences Andersson and Kurland 1990; Sharp et al. 1993; in the sizes remain highly significant after removal of Akashi2001). Although relationships between amino low-complexity regions (Wilcoxon ranked signs test,P⬍ acid composition and gene expression have been estab-10⫺4). Interestingly, the proportion of “low-complexity”
lished in yeast (Ikemura1982; Percudaniet al. 1997; amino acid sequences increases in highly expressed pro- Jansen and Gerstein 2000), translation selection in teins within functional categories; 20 of 31 categories protein evolution has been difficult to substantiate be-deviate in this direction and the overall pattern is highly cause associations between amino acid composition and statistically significant (Mantel-Haenszel test,Z⫽20.06, tRNA abundances can be explained by selection on P⬍10⫺5). This pattern may reflect a greater abundance
tRNA concentrations to match the functional needs of of particular structural motifs (soluble folds with
combi-nations of helices and sheets) represented among highly expressed proteins (JansenandGerstein2000).
Gene expression and GNN usage: In yeast, GCN,
GGN, and GTN codons for Ala, Gly, and Val, respec-tively, show the strongest increases in usage in highly expressed genes (Table 2; Figure 4). Figure 7 shows that such patterns are common to many prokaryotes and multicellular eukaryotes. GNN usage shows remarkably consistent increases in abundance with measures of translation rates (either estimates of transcript abun-dance or measures of synonymous codon usage bias) inC. elegans,D. melanogaster,B. subtilis, andE. coli (see also Gutie´rrez et al. 1996), as well as yeast. Similar patterns have been noted in the genomes of plant
chlo-Figure 6.—Correlation between amino acid usage and roplasts (MortonandSo2000) and Buchnera (
Pala-tRNA gene copy numbers among expression classes. Data are cios and Wernegreen 2002). GNN increases occur
graphed for expression categories (bin sizesⱖ5⫻104codons).
among cytosolic and membrane proteins encoded in Pearson product moment correlation coefficients between plant chloroplast genomes (MortonandSo2000) and tRNA gene copy numbers and amino acid usage are plotted
Figure7.—Gene expression and GNN codon usage among highly diverged genomes. Data are described in the text. The pooled abundances of GNN codons (Val, Ala, Asp, Glu, and Gly) among all codons are plotted on they-axis. mRNA abundances forC. elegansandD. melanogasterare counts of matches to EST libraries (DuretandMouchiroud1999) and are employed as estimators of translation rates. Bin sizes for ranking by mRNA abundances are 5⫻104for each genome. MCU, major codon
usage, is the number of major codons/(number of major⫹minor codons) and is also employed as an estimator of translation rates. Bins were constructed similarly to transcript abundance estimates (see text) for genes ranked by MCU. Bin sizes are 1⫻ 105forS. cerevisiae,C. elegans, andD. melanogasterand 5⫻104forB. subtilisandE. coli.
highly expressed proteins (Garel1974;Ikemura1982; scription rates could contribute to relationships be-tween gene expression and codon and amino acid us-Yamaoet al. 1991;Xia 1998;Duret2000).
Here, functional categorizations of proteins were em- age, as well as protein length. In E. coli, transcription induces C→T transitions on the nontranscribed strand, ployed to distinguish between associations between
gene expression and amino acid composition that arise presumably due to increased deamination of cytosine (Francinoet al. 1996;BeletskiiandBhagwat1998). as a by-product of the functional requirements of
pro-teins and those that reflect fitness benefits to transla- Genetic experiments in yeast have shown ⬎10-fold in-creases in rates of ⫺1 frameshift reversion mutations tionally superior codons. Increases in the correlation
between tRNA gene numbers and amino acid usage as with transcription rates (DattaandJinks-Robertson 1995). However, such experiments screen for particular a function of expression levels among all genes and
similar patterns within broad functional categories sup- types of mutations and the dependence of the overall spectrum of mutations on transcription has not been port translational selection. Although the functional
cat-egorizations of proteins may be crude, it is unlikely that determined. InD. melanogaster(KlimanandHey1994) andC. elegans(DuretandMouchiroud1999), intron functional requirements explain consistent trends in
amino acid usage in nonoverlapping groups of genes. base composition has been examined to determine whether mutational processes are transcription depen-These findings do not exclude functional adaptation
of isoacceptor abundances. tRNA pools may have been dent. However, the small numbers of introns in the yeast genome (Daviset al. 2000) and their greater abundance initially adjusted to match the functional requirements
of highly expressed ribosomal proteins and enzymes (Ares et al. 1999; Lopez and Seraphin 1999) and lengths (Vinogradov2001) in highly expressed tran-of central metabolism. Translational selection would
magnify amino acid usage biases beyond the initial func- scripts suggest that intron base composition does not reflect mutational equilibrium.
tional needs of abundant proteins. The gradual increase
in the correlation between amino acid usage and gene Population genetic analyses of putative fitness classes of nonsynonymous mutations (Akashi1995) may pro-expression (Figure 6) supports a contribution of
transla-tional selection in the amino acid composition of even vide a means to distinguish between the contributions of translational selection and mutational biases in amino moderately expressed yeast genes. However, Table 2
shows relatively high overall usage of some amino acids acid composition. In contrast to compositional studies that assume constant mutational processes among that appear to be translationally less preferable (i.e.,
Leu, Asn, and Ile), suggesting a balance among forces genes, such analyses assume constancy of mutational processes within genes over evolutionary time, and the including translational selection, functional constraint,
and mutation pressure. statistical power to detect weak selection can be quite
tran-taken here may provide putative fitness classes of amino Baudouin-Cornuet al. (2001) have shown that yeast proteins involved in sulfur and nitrogen transport and acid changes for such studies. Rigorous support for
translational selection in yeast protein evolution may processing show reduced levels of amino acids requir-ing these atoms. Examination of the usage of S- and require sequence data from within and between closely
related species. N-containing amino acids among proteins that are
highly expressed during nitrogen or sulfur starvation
Properties of translationally preferred aa-tRNAs:The
rate and accuracy of protein synthesis depend on both would add support for nutrient limitation and protein evolution.
the abundances of aa-tRNAs and their intrinsic
proper-ties, such as the stability of codon-anticodon interac- Calculations of the energetic costs of amino acid bio-synthesis may differ between yeast andE. coliorB. subtilis tions. Recent studies have demonstrated
conforma-tional changes in aa-tRNAs, elongation factors, and due to both differences in amino acid biosynthetic path-ways and alternative energy production pathpath-ways (alco-ribosomes during protein synthesis (Ogleet al. 2001).
Codon-anticodon interactions determine rate constants hol fermentation and respiration). Such analyses may help to explain the identities of amino acids whose usage during the processes of tRNA selection, proofreading,
and peptidyl transfer, which, in turn, determine both differs between highly and lowly expressed genes but are not undertaken here.
the speed and the accuracy of protein synthesis
(re-viewed in Rodnina and Wintermeyer 2001). Pro- Translational selection and protein size:In the yeast genome, the smaller sizes of proteins encoded by highly cessing of aa-tRNAs also affects translation of
neigh-boring codons; near-cognate isoacceptors bound at the expressed genes are consistent with selection favoring reductions in the metabolic costs of protein and/or ribosomal P site induce frameshift events at the A site
(Farabaugh2000). The analyses presented here have amino acid biosynthesis. Relationships between gene length and expression levels in multicellular eukaryotes focused on aa-tRNA abundances, an extrinsic property
of isoacceptors, because they can be estimated from are less clear. DuretandMouchiroud (1999) found no association between protein length and transcript gene numbers. However, codon preferences among
nonsynonymous codons are likely to also reflect intrinsic abundance (measured by the numbers of matches of ESTs to predicted gene sequences) inArabidopsis thali-properties of tRNAs or the amino acids that they carry.
For example, the decline of Leu usage in highly ex- anaand positive correlations between protein size and expression in theD. melanogasterandC. elegans. In con-pressed genes may reflect, in part, selection against
us-age of frameshift-prone codons (Farabaugh2000). trast,Castillo-Daviset al. (2002) employed DNA array estimates of mRNA abundance and found strong statisti-Increasing GNN usage is the most prominent feature
of associations between amino acid usage and gene ex- cal support for reductions in length among highly ex-pressedC. elegansgenes. Biases in methods for estimat-pression in yeast as well as in a number of distantly
related organisms. Three base nucleotide periodicities ing gene expression will need to be explored and patterns will need to be studied among proteins of re-in protere-in-codre-ing genes (NassarandCook1976;
Tri-fonovandSussman1980;Shepherd1981) have been lated function to determine whether gene length and expression level are related in these organisms. A lack explained in light of theoretical studies of the early
evolution of the genetic code (Cricket al. 1976;Eigen of negative relationships would be at odds with strong evidence of selection for metabolic efficiency at silent and Schuster 1979). Trifonov (1987, 1992) has
ar-gued that G:non-G:N codons may aid in maintenance sites in these multicellular eukaryotes (reviewed in Sharpet al. 1993;Akashi2001;Duret2002).
of translational reading frame through interactions
be-tween mRNA and 16S rRNA during translation. Bio- Translational selection and protein divergence:Rates of protein divergence are negatively correlated with ex-chemical studies of protein synthesis will be required
to determine whether GNN codons have special transla- pression levels among yeast genes (Pal et al. 2001a). Translational selection in protein evolution could pro-tional properties.
Intrinsic features of aa-tRNAs could also include prop- vide an explanation (Akashi2001); in highly expressed genes, amino acid changes that may be neutral with erties of amino acids such as their requirements for
limiting resources (MazelandMarlie`re1989;Craig respect to protein function will be selected against if they decrease the rate or accuracy of protein synthesis. et al. 2000; Baudouin-Cornu et al. 2001) or costs of
biosynthesis or transport (Richmond1970;Karlinand Translationally unpreferred amino acids that are main-tained in these genes may be restricted to those that Bucher1992;LobryandGautier1994;Dufton1997;
CraigandWeber1998;GaratandMusto2000;Jan- serve critical roles in protein function and may also be evolutionarily conserved.
senand Gerstein 2000;Akashi andGojobori 2002;
Zavalaet al. 2002). Natural selection may have elevated Rates of protein evolution are also negatively corre-lated with gene expression in plants (Wright et al. tRNA abundances for isoacceptors carrying
metaboli-cally favored amino acids so that translation selection 2002), mammals (DuretandMouchiroud2000;Iida andAkashi2000), and Drosophila (Betancourtand acts in the same direction as such preferences (Akashi
to mRNA concentration and protein length inSaccharomyces cere-may be a factor in protein divergence among
multicellu-visiae.Yeast16:1131–1145.
lar eukaryotes. However, Duret and Mouchiroud Costanzo, M. C., J. D. Hogan, M. E. Cusick, B. P. Davis, A. M. (2000) proposed that expression patterns are related Fancheret al., 2000 The yeast proteome database (YPD) and
Caenorhabditis elegansproteome database (WormPD):
comprehen-to functional constraint. Proteins expressed in multiple
sive resources for the organization and comparison of model
tissues encounter a large number of chemical environ- organism protein information. Nucleic Acids Res.28:73–76. ments and their primary structures may be constrained Craig, C. L., andR. S. Weber, 1998 Selection costs of amino acid
substitutions in ColE1 and ColIa gene clusters harbored by Esche-to avoid physical interactions with other proteins (
Hast-richia coli.Mol. Biol. Evol.15:774–776.
ings 1996). Alternatively, proteins expressed in a Craig, C. L., C. Riekel, M. E. Herberstein, R. S. Weber, D. Kaplan greater number of tissues or in a greater number of et al., 2000 Evidence for diet effects on the composition of silk proteins produced by spiders. Mol. Biol. Evol.17:1904–1913.
developmental stages may be more likely than
tissue-Crick, F. H., S. Brenner, A. KlugandG. Pieczenik, 1976 A
specula-specific proteins to affect fitness. Both ideas relate rates tion on the origin of protein synthesis. Origins Life7:389–397. of protein evolution to constraints on function. If the Datta, A., andS. Jinks-Robertson, 1995 Association of increased spontaneous mutation rates with high levels of transcription in
interpretations proposed here are correct, then fitness
yeast. Science268:1616–1619.
effects of amino acid changes related to the overall Davis, C. A., L. Grate, M. SpingolaandM. Ares, Jr., 2000 Test of physiology of cells, rather than the specific functions of intron predictions reveals novel splice sites, alternatively spliced mRNAs and new introns in meiotically regulated genes of yeast.
proteins, should also contribute to patterns of protein
Nucleic Acids Res.28:1700–1706.
divergence and amino acid compositional differences Dufton, M. J., 1997 Genetic code synonym quotas and amino acid
among taxa. complexity: Cutting the cost of proteins? J. Theor. Biol.187:
165–173.
I am grateful to C. Castillo-Davis, F. Holstege, T. Ikemura, and W.-Y. Duret, L., 2000 tRNA gene number and codon usage in theC. Ko for valuable discussions and comments on the manuscript. This elegansgenome are co-adapted for optimal translation of highly work was supported by a grant from the Alfred P. Sloan Foundation. expressed genes. Trends Genet.16:287–289.
Duret, L., 2002 Evolution of synonymous codon usage in metazo-ans. Curr. Opin. Genet. Dev.12:640–649.
Duret, L., andD. Mouchiroud, 1999 Expression pattern and, sur-prisingly, gene length shape codon usage in Caenorhabditis,
Dro-LITERATURE CITED
sophila, and Arabidopsis. Proc. Natl. Acad. Sci. USA96:4482– 4487.
Akashi, H., 1995 Inferring weak selection from patterns of
polymor-Duret, L., andD. Mouchiroud, 2000 Determinants of substitution phism and divergence at “silent” sites in Drosophila DNA.
Genet-rates in mammalian genes: expression pattern affects selection ics139:1067–1076.
intensity but not mutation rate. Mol. Biol. Evol.17:68–74.
Akashi, H., 1996 Molecular evolution betweenDrosophila
melanogas-Eigen, M., andP. Schuster, 1979 The Hypercycle, a Principle of Natural terandD. simulans: reduced codon bias, faster rates of amino
Self-organization. Springer-Verlag, Berlin/New York. acid substitution and larger proteins inD. melanogaster.Genetics
Farabaugh, P. J., 2000 Translational frameshifting: implications for
144:1297–1307.
the mechanism of translational frame maintenance. Prog.
Nu-Akashi, H., 1999 Inferring the fitness effects of DNA mutations
cleic Acid Res. Mol. Biol.64:131–170. from polymorphism and divergence data: statistical power to
Francino, M. P., L. Chao, M. A. RileyandH. Ochman, 1996 Asym-detect directional selection under stationarity and free
recombi-metries generated by transcription-coupled repair in enterobacte-nation. Genetics151:221–238.
rial genes. Science272:107–109.
Akashi, H., 2001 Gene expression and molecular evolution. Curr.
Futcher, B., G. I. Latter, P. Monardo, C. S. MclaughlinandJ. I.
Opin. Genet. Dev.11:660–666.
Garrels, 1999 A sampling of the yeast proteome. Mol. Cell.
Akashi, H., andT. Gojobori, 2002 Metabolic efficiency and amino
Biol.19:7357–7368. acid composition in the proteomes ofEscherichia coliandBacillus
Garat, B., andH. Musto, 2000 Trends of amino acid usage in the
subtilis.Proc. Natl. Acad. Sci. USA99:3695–3700.
proteins from the unicellular parasiteGiardia lamblia.Biochem.
Altschul, S. F., W. Gish, W. Miller, E. W. MyersandD. J. Lipman,
Biophys. Res. Commun.279:996–1000. 1990 Basic local alignment search tool. J. Mol. Biol.215:403–
Garel, J. P., 1974 Functional adaptation of tRNA population. J. 410.
Theor. Biol.43:211–225.
Andersson, S. G., andC. G. Kurland, 1990 Codon preferences in
Gerton, J. L., J. Derisi, R. Shroff, M. Lichten, P. O. Brownet al., free-living microorganisms. Microbiol. Rev.54:198–210.
2000 Inaugural article: global mapping of meiotic
recombina-Ares, M., Jr., L. Grate andM. H. Pauling, 1999 A handful of
tion hotspots and coldspots in the yeast Saccharomyces cerevisiae. intron-containing genes produces the lion’s share of yeast mRNA.
Proc. Natl. Acad. Sci. USA97:11383–11390. RNA5:1138–1139.
Goffeau, A., B. G.Barrell, H.Bussey, R. W.Davis, B.Dujonet Baudouin-Cornu, P., Y. Surdin-Kerjan, P. Marliere and D.
al., 1996 Life with 6000 genes. Science274:546, 563–547.
Thomas, 2001 Molecular evolution of protein atomic
composi-Grosjean, H., andW. Fiers, 1982 Preferential codon usage in pro-tion. Science293:297–300.
karyotic genes: the optimal codon-anticodon interaction energy
Beletskii, A., andA. S. Bhagwat, 1998 Correlation between
tran-and the selective codon usage in efficiently expressed genes. scription and C to T mutations in the non-transcribed DNA
Gene18:199–209. strand. Biol. Chem.379:549–551.
Grosjean, H., D. Sankoff, W. M. Jou, W. FiersandR. J. Cedergren,
Bennetzen, J. L., andB. D. Hall, 1982 Codon selection in yeast.
J. Biol. Chem.257:3026–3031. 1978 Bacteriophage MS2 RNA: a correlation between the
stabil-ity of the codon:anticodon interaction and the choice of code
Betancourt, A. J., andD. C. Presgraves, 2002 Linkage limits the
power of natural selection in Drosophila. Proc. Natl. Acad. Sci. words. J. Mol. Evol.12:113–119.
Gutie´rrez, G., L. Marquez andA. Marin, 1996 Preference for USA99:13616–13620.
Birdsell, J. A., 2002 Integrating genomics, bioinformatics, and clas- guanosine at first codon position in highly expressedEscherichia coligenes. A relationship with translational efficiency. Nucleic sical genetics to study the effects of recombination on genome
evolution. Mol. Biol. Evol.19:1181–1197. Acids Res.24:2525–2527.
Hastings, K. E., 1996 Strong evolutionary conservation of broadly
Castillo-Davis, C. I., S. L. Mekhedov, D. L. Hartl, E. V. Koonin
and F. A. Kondrashov, 2002 Selection for short introns in expressed protein isoforms in the troponin I gene family and other vertebrate gene families. J. Mol. Evol.42:631–640. highly expressed genes. Nat. Genet.31:415–418.
aminoacyl-tRNA population of human reticulocytes. J. Biol. Percudani, R., 2001 Restricted wobble rules for eukaryotic ge-nomes. Trends Genet.17:133–135.
Chem.257:3183–3188.
Hereford, L. M., andM. Rosbash, 1977 Number and distribution Percudani, R., andS. Ottonello, 1999 Selection at the wobble position of codons read by the same tRNA inSaccharomyces
cerevis-of polyadenylated RNA sequences in yeast. Cell10:453–462.
Holstege, F. C., E. G. Jennings, J. J. Wyrick, T. I. Lee, C. J. Hengart- iae.Mol. Biol. Evol.16:1752–1762.
Percudani, R., A. PavesiandS. Ottonello, 1997 Transfer RNA
neret al., 1998 Dissecting the regulatory circuitry of a eukaryotic
genome. Cell95:717–728. gene redundancy and translational selection inSaccharomyces
cere-visiae.J. Mol. Biol.268:322–330.
Iida, K., andH. Akashi, 2000 A test of translational selection at
‘silent’ sites in the human genome: base composition compari- Precup, J., andJ. Parker, 1987 Missense misreading of asparagine codons as a function of codon identity and context. J. Biol. Chem. sons in alternatively spliced genes. Gene261:93–105.
Ikemura, T., 1982 Correlation between the abundance of yeast trans- 262:11351–11355.
Rice, W. R., 1989 Analyzing tables of statistical tests. Evolution43:
fer RNAs and the occurrence of the respective codons in protein
genes. Differences in synonymous codon choice patterns of yeast 223–225.
Richmond, R. C., 1970 Non-Darwinian evolution: a critique. Nature andEscherichia coliwith reference to the abundance of
isoaccept-ing transfer RNAs. J. Mol. Biol.158:573–597. 225:1025–1028.
Robinson, M., R. Lilley, S. Little, J. S. Emtage, G. Yarrantonet Ikemura, T., 1985 Codon usage and tRNA content in unicellular
and multicellular organisms. Mol. Biol. Evol.2:13–34. al., 1984 Codon usage can affect efficiency of translation of genes inEscherichia coli.Nucleic Acids Res.12:6663–6671.
Jansen, R., and M. Gerstein, 2000 Analysis of the yeast
tran-scriptome with structural and functional categories: characteriz- Rodnina, M. V., and W. Wintermeyer, 2001 Ribosome fidelity: tRNA discrimination, proofreading and induced fit. Trends Bio-ing highly expressed proteins. Nucleic Acids Res.28:1481–1488.
Kanaya, S., Y. Yamada, Y. KudoandT. Ikemura, 1999 Studies of chem. Sci.26:124–130.
Sharp, P. M., andE. Cowe, 1991 Synonymous codon usage in
Sac-codon usage and tRNA genes of 18 unicellular organisms and
quantification ofBacillus subtilistRNAs: gene expression level and charomyces cerevisiae.Yeast7:657–678.
Sharp, P. M., T. M. TuohyandK. R. Mosurski, 1986 Codon usage species-specific diversity of codon usage based on multivariate
analysis. Gene238:143–155. in yeast: cluster analysis clearly differentiates highly and lowly
expressed genes. Nucleic Acids Res.14:5125–5143.
Karlin, S., andP. Bucher, 1992 Correlation analysis of amino acid
usage in protein classes. Proc. Natl. Acad. Sci. USA89:12165– Sharp, P. M., M. Stenico, J. F. PedenandA. T. Lloyd, 1993 Codon usage: Mutational bias, translational selection, or both? Biochem. 12169.
Kimura, M., 1983 The Neutral Theory of Molecular Evolution. Cam- Soc. Trans.21:835–841.
Shepherd, J. C., 1981 Periodic correlations in DNA sequences and bridge University Press, Cambridge, UK/New York.
Kliman, R. M., andJ. Hey, 1994 The effects of mutation and natural evidence suggesting their evolutionary origin in a comma-less genetic code. J. Mol. Evol.17:94–102.
selection on codon bias in the genes of Drosophila. Genetics
137:1049–1056. Shpaer, E. G., 1989 Amino acid composition is correlated with
pro-tein abundance inEscherichia coli: Can this be due to optimization
Li, W.-H., 1997 Molecular Evolution. Sinauer Associates, Sunderland,
MA. of translational efficiency? Protein Seq. Data Anal.2:107–110.
Snedecor, G. W., andW. G. Cochran, 1989 Statistical Methods. Iowa
Lobry, J. R., andC. Gautier, 1994 Hydrophobicity, expressivity
and aromaticity are the major trends of amino-acid usage in 999 State University Press, Ames, IA.
Sorensen, M. A., C. G. KurlandandS. Pedersen, 1989 Codon
Escherichia colichromosome-encoded genes. Nucleic Acids Res.
22:3174–3180. usage determines translation rate inEscherichia coli.J. Mol. Biol.
207:365–377.
Lopez, P. J., andB. Seraphin, 1999 Genomic-scale quantitative
anal-ysis of yeast pre-mRNA splicing: implications for splice-site recog- Trifonov, E. N., 1987 Translation framing code and frame-monitor-ing mechanism as suggested by the analysis of mRNA and 16 S nition. RNA5:1135–1137.
Marais, G., D. MouchiroudandL. Duret, 2001 Does recombina- rRNA nucleotide sequences. J. Mol. Biol.194:643–652.
Trifonov, E. N., 1992 Recognition of correct reading frame by the tion improve selection on codon usage? Lessons from nematode
and fly complete genomes. Proc. Natl. Acad. Sci. USA98:5688– ribosome. Biochimie74:357–362.
Trifonov, E. N., andJ. L. Sussman, 1980 The pitch of chromatin 5692.
Mazel, D., andP. Marlie`re, 1989 Adaptive eradication of methio- DNA is reflected in its nucleotide sequence. Proc. Natl. Acad. Sci. USA77:3816–3820.
nine and cysteine from cyanobacterial light-harvesting proteins.
Nature341:245–248. Varenne, S., J. Buc, R. LloubesandC. Lazdunski, 1984 Translation
is a non-uniform process. Effect of tRNA availability on the rate
Morey, N. J., C. N. GreeneandS. Jinks-Robertson, 2000 Genetic
analysis of transcription-associated mutation inSaccharomyces cere- of elongation of nascent polypeptide chains. J. Mol. Biol.180:
549–576.
visiae.Genetics154:109–120.
Moriyama, E. N., andJ. R. Powell, 1998 Gene length and codon Vinogradov, A. E., 2001 Intron length and codon usage. J. Mol. Evol.52:2–5.
usage bias inDrosophila melanogaster,Saccharomyces cerevisiaeand
Escherichia coli.Nucleic Acids Res.26:3188–3193. Warner, J. R., 1999 The economics of ribosome biosynthesis in yeast. Trends Biochem. Sci.24:437–440.
Morton, B. R., andB. G. So, 2000 Codon usage in plastid genes
is correlated with context, position within the gene, and amino Wootton, J. C., andS. Federhen, 1996 Analysis of compositionally biased regions in sequence databases. Methods Enzymol. 266:
acid content. J. Mol. Evol.50:184–193.
Nassar, R. F., andR. D. Cook, 1976 Non-randomness of nucleotide 554–571.
Wright, S. I., B. LaugaandD. Charlesworth, 2002 Rates and bases in mRNA codons. Genet. Res.27:353–362.
Nei, M., 1975 Molecular Population Genetics and Evolution. North-Hol- patterns of molecular evolution in inbred and outbred Arabi-dopsis. Mol. Biol. Evol.19:1407–1420.
land/American Elsevier, Amsterdam/New York.
Ogle, J. M., D. E. Brodersen, W. M. Clemons, Jr., M. J. Tarry, A. P. Xia, X., 1998 How optimized is the translational machinery in Esche-Carteret al., 2001 Recognition of cognate transfer RNA by richia coli,Salmonella typhimuriumandSaccharomyces cerevisiae? Ge-the 30S ribosomal subunit. Science292:897–902. netics149:37–44.
Pal, C., B. PappandL. D. Hurst, 2001a Highly expressed genes Yamao, F., Y. Andachi, A. Muto, T. IkemuraandS. Osawa, 1991 in yeast evolve slowly. Genetics158:927–931. Levels of tRNAs in bacterial cells as affected by amino acid usage
Pal, C., B. PappandL. D. Hurst, 2001b Does the recombination in proteins. Nucleic Acids Res.19:6119–6122.
rate affect the efficiency of purifying selection? The yeast genome Zavala, A., H. Naya, H. RomeroandH. Musto, 2002 Trends in provides a partial answer. Mol. Biol. Evol.18:2323–2326. codon and amino acid usage inThermotoga maritima.J. Mol. Evol.
Palacios, C., and J. J. Wernegreen, 2002 A strong effect of AT 54:563–568. mutational bias on amino acid usage in Buchnera is mitigated