DOI: 10.1534/genetics.109.111880
Identification of a Maize Locus That Modulates the Hypersensitive Defense
Response, Using Mutant-Assisted Gene Identification and Characterization
Satya Chintamanani,* Scot H. Hulbert,
†Gurmukh S. Johal* and Peter J. Balint-Kurti
‡,1*Department of Botany and Plant Pathology, Purdue University, West Lafayette, Indiana 47907–2054,†Department of Plant Pathology, Washington State University, Pullman, Washington 99164-6430,‡United States Department of Agriculture–Agricultural Research
Service (USDA–ARS) Plant Science Research Unit and Department of Plant Pathology, North Carolina State University, Raleigh, North Carolina 27695-7616
Manuscript received November 7, 2009 Accepted for publication December 8, 2009
ABSTRACT
Potentially useful naturally occurring genetic variation is often difficult to identify as the effects of individual genes are subtle and difficult to observe. In this study, a novel genetic technique called Mutant-Assisted Gene Identification and Characterization is used to identify naturally occurring loci modulat-ing the hypersensitive defense response (HR) in maize. Mutant-Assisted Gene Identification and Characterization facilitates the identification of naturally occurring alleles underlying phenotypic variation from diverse germplasm, using a mutant phenotype as a ‘‘reporter.’’ In this study the reporter phenotype was caused by a partially dominant autoactive disease resistance gene,Rp1-D21, which caused HR lesions to form spontaneously all over the plant. Here it is demonstrated that theRp1-D21phenotype is profoundly affected by genetic background. By crossing the Rp1-D21 gene into the IBM mapping population, it was possible to map and identify Hrml1 on chromosome 10, a locus responsible for modulating the HR phenotype conferred byRp1-D21. Other loci with smaller effects were identified on chromosomes 1 and 9. These results demonstrate that Mutant-Assisted Gene Identification and Characterization is a viable approach for identifying naturally occurring useful genetic variation.
P
OTENTIALLY useful naturally occurring genetic variation is often difficult to identify as the effects of individual genes are subtle and difficult to observe. Furthermore, so many different alleles are available that it is a major challenge just to sift through the enormous diversity available. To this end, we recently conceptual-ized a simple yet effective method to discover and char-acterize variation present naturally in plant germplasm( Johalet al.2008). This method, Mutant-Assisted Gene
Identification and Characterization, makes use of a mutant phenotype for a gene affecting the trait of interest as a reporter to discover and analyze relevant, interacting genes present naturally in diverse germ-plasm. Mutant-Assisted Gene Identification and Char-acterization involves crossing a mutant to diverse germplasm and then evaluating the mutant progenyfor transgressive changes (both suppressed and severe) in the mutant phenotype(s). If the mutation is recessive, the population needs to be advanced to the F2
generation to be able to detect and analyze such varia-tion. However, for a dominant or partially dominant mutant, evaluations can be made immediately in the F1
to discover lines that contain suppressors or enhancers
of the trait (mutation) under study. Mutant F1
pro-genies from such crosses can then be propagated fur-ther to identify, map, and clone genes/QTL that affect the trait positively or negatively. In the case of maize and other species for which genetically characterized mapping populations are available, modifying loci can be rapidly mapped by crossing a mutant line to each member of a mapping population and evaluating the resulting F1families. In this study we provide a
proof-of-concept for the Mutant-Assisted Gene Identification and Characterization technique, using it to identify loci involved in the defense response of maize.
Plants are constantly exposed to numerous potential pathogens with diverse modes of attack. Nevertheless, it is rather rare to see plants succumbing to disease. One key reason for this is the presence of a highly effective and inducible defense system, a major component of which is the hypersensitive response (HR). HR is usually associated with a specific recognition event and is ac-tivated after other nonspecific resistance mechanisms have been overcome or evaded (see Bentand Mackey 2007). Although it was initially coined to refer to the rapid collapse of cells at the site of infection, over the years the term HR has been used to refer to both cell death and the associated induction of a number of other defense responses, including the accumulation of phytoalexins and pathogenesis-related (PR) proteins at the site of infection, to name a few (Muret al.2007).
1Corresponding author:USDA–ARS Plant Science Research Unit and Department of Plant Pathology, North Carolina State University, 3418 Gardner Hall, Raleigh, NC 27695-7616.
E-mail: [email protected]
Reactive oxygen species such as superoxide and H2O2
appear to be causally involved in cell death underlying the HR response ( Jonesand Dangl2006).
HR is under the control of a subset of disease-resistance genes, commonly referred to as R genes. These R genes specifically recognize matchingavirulence
(Avr) effectors from the pathogen. Many R genes
encode products containing a nucleotide-binding site (NBS) domain in the middle of the protein and a leucine-rich repeat (LRR) domain at the C-terminal end (Bentand Mackey2007). R proteins are involved both in the recognition of the pathogen and the subsequent induction of the HR response. How R proteins remain in a quiescent but ‘‘vigilant’’ state remains to be estab-lished. Certain mutations in R genes have been found that abolish their dependence on AVR proteins for activation. Such aberrant R genes mostly behave as dom-inant or partially domdom-inant alleles and trigger the HR constitutively in the absence of the pathogen (Huet al. 1996; Zhang et al. 2003; Dodds et al. 2006). Two consequences of such ‘‘autoactive’’ or ‘‘ectopically ac-tive’’ R genes are a massive induction of cell death and the consequential stunting of the organism (Doddset al. 2006). Although autoactive R genes have been found to exist in many plant species, the first few examples came from the maizeRp1 locus, which confers race-specific resistance to common rust, caused by Puccinia sorghi
(Hu et al.1996). Such autoactive R genes can be used
to investigate HR genetics and etiology in the absence of confounding effects from the pathogen and consti-tute an excellent candidate for analysis using Mutant-Assisted Gene Identification and Characterization.
The details of the HR cell death reaction as well as the pathway(s) that link R gene activation with the HR remain unclear (Muret al.2007). Despite considerable research over the past decade, only a few components have been found thus far. Some of these,Ndr1, Eds1,
Pad4, Rar1, and Sgt1, were identified in mutagenesis
screens conducted to identify mutants that failed to undergo an HR reaction in response to infection by an avirulent pathogen (reviewed in Bent and Mackey 2007). A few others,RIN4, for example, were identified in yeast two-hybrid assays using an NBS–LRR protein as bait (Mackey et al. 2003). Recently, an Arabidopsis gain-of-function mutant that carries a point mutation in an R gene analog (a gene with the structure of an R gene but not known to be involved in resistance to any pathogen) was used to isolate a few more potential genes in the HR pathway in a second site suppressor approach following mutagenesis with ethane methyl sulfonate (EMS) (Palma et al. 2005; Zhang and Li 2005; Goritschnig et al. 2007). A problem with approaches based on intentional mutagenesis is that they fail to uncover genes that have either redundant or essential functions. One way to avoid this problem would be to seek naturally occurring allelic variants affecting HR. Such natural variation is pervasive in all
species, being generated and selected for over millions of years of evolution.
Although natural variation has served as a constant provider of the R genes in all plant species, natural variability has not been tapped as a tool for understand-ing other aspects of the disease-resistance response (Holub2007). TheRp1-D21gene is an autoactive allele from the maizeRp1disease-resistance locus that initiates HR randomly all over the plant (Pryor1993; Collins
et al.1999; Sunet al.2001). Our objective for this study
was to use theRp1-D21gene phenotype as a test case for the Mutant-Assisted Gene Identification and Character-ization approach. We show here that enormous varia-tion exists in the maize germplasm that is capable of affecting the HR response positively or negatively and we identify loci that modulate expression of the HR phenotype segregating in the well-known Intermated B73 3 Mo17 (IBM) advanced intercross line (AIL) population (Coe et al. 2002; Lee et al. 2002). This constitutes the first demonstration of the utility of the Mutant-Assisted Gene Identification and Characteriza-tion approach—an approach that is likely to prove widely applicable.
MATERIALS AND METHODS
Plant materials: TheRp1-D21-H95 line was generated by crossing theRp1-D21variant to the maize inbred line H95 and backcrossing to the H95 parent four times, while selecting for the HR phenotype indicated by the spontaneous formation of cell death lesions. Since Rp1-D21 homozygotes in the H95 background are often unable to produce and sustain a viable ear, this stock is maintained in heterozygous condition by repeatedly crossing it to the H95 inbred.
The Rp1-D21-H95 heterozygote was crossed both to a collection of maize inbred lines (see Table 1) and to 233 recombinant inbred lines (RILs) from the maize IBM pop-ulation (Lee et al. 2002). As expected, in each case, the resulting F1families segregated in a 1:1 ratio for mutant (with Rp1-D21 HR lesions) to wild-type individuals. The IBM mapping population itself is composed of 302 F7:8 RILs derived from the cross of maize inbred lines B73 and Mo17. This population was intermated four times following the F2 stage before inbred lines were derived (Leeet al.2002). Seed of IBM lines was received from the Maize Genetic Stock Center and also as gifts from Drs. A. Stapleton and O. Hoekenga.
Field trials: Experiments were performed at the North Carolina State University Central Crops Research Station located at Clayton, North Carolina, in the summers of 2006, 2007, and 2008 and at the Purdue Agronomy Center for Research and Education (ACRE) in West Lafayette, Indiana, in the summers of 2006 and 2007.
lines and the parental lines (B73 and Mo17) were planted in 2007 and 2008. In 2007, 184 F1families were evaluated and in 2008, 233 F1 families were evaluated. Experimental units in each case consisted of single-row plots arranged in random-ized complete blocks with two replications.
In West Lafayette, Indiana, 20 seeds per row were planted in 6-m rows spaced 0.76 m apart. As in Clayton, progenies of crosses ofRp1-D21-H95 with diverse inbreds were planted in 2009, while the test-cross progenies of 184 IBM RILs with Rp1-D21were planted in 2007. Plants were drip irrigated as needed. Scores were assigned on a row basis, only considering the mutantRp1-D21individuals within each row. They were scored on a 1–5 quantitative scale for HR lesion severity with 1 being complete absence of lesions and 5 being complete coverage of the ear leaf with lesions. In North Carolina, the plants were scored seven times in 2007 and 10 times in 2008 at approxi-mately 1-week intervals during June and July. In Indiana the plants were scored twice, once on June 29 and once on July 9, 2007. At the end of the season the heights of all the plants were measured. In North Carolina in 2007, the time to anthesis of each plant was also measured.
Greenhouse trials: F1families from 184 different Rp1-D21-H95 heterozygote3IBM lines were examined in the green-house in Raleigh, North Carolina, in January 2006. Six complete randomized blocks were planted using single plants in 3-in.-diameter clay pots as experimental units. Pots were filled with a 50:50 mixture of Metromix (Scott’s Inc., Marys-ville, OH) and sterilized soil. Supplemental lighting was used for 14hr/day to maintain a16-hr day length. The plants were maintained at 26°during the day and 22°during the night. The actual temperature rarely deviated more than 4° from these target temperatures.
Each F1family segregated 1:1 for the mutant to wild-type individuals so on average, only threeRp1-D21individuals were grown for each family. By chance, for 10 families only wild-type plants and no mutant plants were planted while 5 families consisted solely of mutantRp1-D21plants. Plants were scored every 4 or 5 days from 17 days after planting to 44 days after planting on a 1–5 scale similarly to the field experiments. At 44 days, the height of all the plants was measured. For each family the average score of theRp1-D21phenotype (regardless of how many plants this was) was used as the score for subsequent analyses.
Marker-assisted analysis of Hrml1 in A632: To check the status ofHrml1in the maize line A632 a ‘‘pseudo-F2 popula-tion’’ was generated by crossing A632 and Rp1-D21-H95 to generate an F1 population segregating 1:1 for wild-type to mutant plants. Wild-type F1 plants were then crossed with mutant F1 plants to generate the pseudo-F2, which again segregated 1:1 for wild-type to mutant plants. A number of SSR markers located in bins 10.2 and 10.3 were examined for polymorphism between A632 andRp1-D21-H95. The marker
umc1962was selected and used to genotype extreme segre-gants from the pseudo-F2. DNA was extracted by a fast extract protocol as described by Xinet al.(2003). PCR was performed in a total volume of 20ml containing 2.5 mmMgCl2, 0.4 mm each dNTPs, 50 ng each of forward and reverse primers, and 0.3 units ofTaqpolymerase (Promega, Madison, WI). The PCR conditions were 30 sec each at 94°, 57°, and 72°for 35 cycles.
Expression analyses:Expression analysis of maize defense response genes was conducted using semiquantitative reverse transcriptase polymerase chain reaction (RT–PCR). Total RNA was extracted from maize leaf tissue using TRIZOL (Invitrogen, Carlsbad, CA) and was treated with RNase-free DNase I (Promega Corp., Madison, WI). For RT–PCR, 200 ng of total RNA was reverse transcribed using oligo(dT) primers and AMV reverse transcriptase (Promega) to synthesize first-strand cDNA. In accordance with the manufacturer’s
instruc-tions, 0.5 mg oligo(dT) primer/mg RNA was mixed in nuclease-free water and incubated at 70°for 5 min and then chilled on ice for 5 min. The AMV RT reaction mix (Promega) was then added to a final volume of 25ml and the sample was incubated at 42°for 1 hr followed by 15 min at 70°to deactivate the reverse transcriptase. The resulting cDNA was then used to quantify transcript levels of several maize defense genes using the following PCR conditions: 94°for 30 sec, 57°for 30 sec, and 72°for 30 sec (32 cycles for the defense response genes and 28 cycles for the 18S ribosomal RNA [18S rRNA] control). The primers18S-F(59-TCCTGAGTAACGAACGAGACC-39) and
18S-R (59-CACGATGAAATTTCCCAAGAT-39) were used to amplify the 18S rRNA control. The primers PR1-F (59 -AGGCTCGCGTGCCTCCTAGCTCTGG-39) andPR1-R(59-GG AGTCGCGCCACACCACCTGCGTG-39) were used to amplify the maizePR1defense response gene. The primersPR5-F(59 -AACAACTGCGGTTCACCGTG-39) and PR5-R (59-ACCGA GATGTCGTAGAAGTCC-39) were used to amplify the PR5
defense response gene. The primer pair PRms-F (59-ACCT GGAGCACGAAGCTGCAG-39) and PRms-R (59-GCAGCCGA TGCTTGTAGTGGC-39) was used to amplify the maize defense response genePRms. The primersWIP1-F(59-TGCTGATCCT GTGCCTCCAG-39) and WIP1-R (59-CTCTCTGATCTAGCAC TTGGGG-39) were used to amplify theWIP1gene. All primers were obtained from Integrated DNA Technologies (Coralville, IA). Reaction products were visualized via gel electrophoresis (1% agarose) using a Gel-Doc imaging and documentation system (Bio-Rad, Hercules, CA).
Detection of H2O2 and superoxide ions: The in situ
presence of H2O2 and superoxide in Rp1-D21 leaves was visually detected with 3,3-diaminobenzidine (DAB) and nitro-blue tetrazolium (NBT), respectively, using the procedures described by Thordal-Christensenet al.(1997). The leaves undergoingRp1-D21lesion initiation were excised with a razor blade and allowed to take up NBT (1 mg/ml) or DAB (1 mg/ ml) through the cut ends under high light intensity at room temperature. After 3 hr incubation, leaves were decolorized by boiling in 96% ethanol to remove chlorophyll before exam-ining under a bright light transmission microscope.
Statistical analysis and QTL mapping:F1families derived from the cross between the Rp1-D21-H95 heterozygote line and 233 IBM lines were assessed in the field in both Clayton, North Carolina, in 2007 and 2008 and West Lafayette, Indiana, in 2007 (henceforth called NC 907 and NC 908 and IN, respectively). The population was also assessed in the green-house as juvenile plants in the winter of 2006. The population was scored for HR lesion intensity and severity (‘‘necrosis’’) and mutant:wild type height ratio within an F1 family (‘‘height’’) in all four environments and for differential between anthesis date of mutant and wild-type plants within an F1 family (‘‘anthesis) in NC 907 (see materials and methods for details of trait measurement). Least-squares means were calculated for the height and necrosis sAUDPC (standardized area under disease progress curve) traits mea-sured in the three field trials. The traits were called ‘‘overall necrosis’’ and ‘‘overall height.’’ All correlation calculations were made using the PROC CORR procedure of SAS. The Windows QTL cartographer software package (Department of Statistics, North Carolina State University, Raleigh, NC) was used to detect the QTL. Composite interval mapping was used with a walk speed of 0.5 cM, window size 10 cM. Model 6 was used with five control markers and threshold values de-termined by permutation analysis with a significance level of 0.05. The following eleven traits were used for QTL analysis:
hetero-zygote3 IBM lines F1 family grown on the greenhouse. sAUDPC ratings were calculated in the following way: The average value of two consecutive ratings was obtained and multiplied by the number of days between the ratings. Values were then summed over all intervals and then divided by the number of days of evaluation to determine the weighted average. This method is a standard way of measuring disease (or in this case lesion) development over time (Shanerand Finney1977; Campbell and Madden 1990).
GH height: The ratio of the average height of the disease mimic plants divided by the average height of the wild-type plants within eachRp1-D21-H95 heterozygote3IBM line F1 family grown in the greenhouse at 44 days after planting. IN necrosis: This is the average of the two scores for each
Rp1-D21-H95 heterozygote3IBM lines F1family grown in West Lafayette, Indiana, scored on the 1–5 scale described. In this case a single replication was assessed.
IN height: The ratio of the average height of the disease mimic plants divided by the average height of the wild-type plants within eachRp1-D21-H95 heterozygote3IBM line F1family grown in West Lafayette, Indiana, in 2007, measured at the end of the season. By using the mutant:wild type height ratio rather than just the average height of the mutants, we could account for the variable levels of heterosis seen in each F1 family.
NC ‘07 necrosis and NC ’08 necrosis: The average sAUDPC score for eachRp1-D21-H95 heterozygote3 IBM lines F1 family grown in Clayton, North Carolina, in 2007 and 2008. Two replications were grown in complete randomized blocks. The sAUDPC was calculated for each F1family for each replication and the average of the two sAUDPC scores for each F1family was used.
NC height ‘07 and NC height ’08: The ratio of the average height of the disease mimic plants divided by the average height of the wild-type plants within each Rp1-D21-H95
heterozygote3IBM lines F1family grown in Clayton, North Carolina, 2007 and in 2008. Two replications were grown in complete randomized blocks. The height ratio was calcu-lated for each F1family in each replication and the average of the ratios for each F1family was used.
NC anthesis 07: The average difference in days to anthesis of the disease mimic plants compared to the time to anthesis of the wild-type plants within eachRp1-D21-H95 heterozygote3 IBM lines F1family grown in Clayton, North Carolina. Two replications were grown in complete randomized blocks and the average of the anthesis differentials for each F1 family was used.
Overall necrosis: The least-squares means sAUDPC score for each F1family over the three environments, NC ‘07, NC ’08, and IN.
Overall height: The least-squares means height ratio for each F1 family over the three environments, NC ‘07, NC ’08, and IN.
RESULTS
Rp1-D21 lesions form spontaneously in a
develop-mentally programmed fashion: Like many disease
lesion mimic mutations, the HR lesions on Rp1-D21 mutants followed a developmental progression for ini-tiation and expansion and were significantly affected by the environmental conditions. In the H95 background, cell death lesions first initiated on the oldest leaf at around week 2 after planting in the field (the three-leaf stage) but around week 3 in the glasshouse (the four-leaf stage). These lesions enlarged slightly and the new ones formed down the leaf blade in a basipetal fashion
(i.e.,progressing from the tip of the leaf to the base)
(Figure 1). By the time they covered most of the leaf, new HR lesions initiated near the tip of the second leaf. This pattern of lesion initiation and expansion was re-peated progressively as the plant grew and all the leaves were covered withRp1-D21lesions by anthesis with the lowermost leaves becoming entirely necrotic (Figure 1). The lesion initiation/formation was uniform either in a GH or field setting and their progression up the plant was gradual, suggesting that the lesions form spontane-ously and did not need a stimulus for initiation.
The growth and vigor of the Rp1-D21 mutants was significantly curtailed compared to their wild-type sib-lings. In the H95 background,Rp1-D21 mutants were about half the size of wild-type siblings.Rp1-D21-H95 plants were able to produce a small tassel that shed pollen normally, but they were never able to sustain a viable ear. As a result, the Rp1-D21-H95 line was maintained as heterozygotes by fertilizing H95 females with pollen from
aRp1-D21-H95 plant heterozygous for theRp1-D21gene.
The Rp1-D21 disease lesion phenotype has typical
hallmarks of the hypersensitive response:Genetic and
molecular studies have clearly demonstrated that the
Rp1-D21 gene is a structurally aberrant allele of
func-tional R genes at the complex Rp1 disease-resistance locus (Collinset al.1999; Sunet al.2001). However, the question remained whether lesions associated with the
Rp1-D21mutation truly represented cell death typical of
the HR response induced in response to pathogen attack. To determine this, we looked for two key hallmarks diagnostic of the bona fide HR response in mutants expressing theRp1-D21lesions in the Rp1-D21-H95 line. The first was the accumulation of reactive oxygen species superoxide (O2 ) and hydrogen
perox-ide (H2O2), both of which have been shown to be
causally involved in the HR response (Levine et al. 1994). We examined the in situ formation of these biochemical markers at developing Rp1-D21 lesions using the reagent NBT for O2 and DAB for H
2O2. Both
of these reactive oxygen species were detected uniquely around Rp1-D21 lesions (Figure 2), indicating their similarity to the HR cell death response.
The second hallmark tested was the induction of defense response genes. In maize, the induction of four genes,PR1,PR5,PRms, andWip1,has been associated
with the HR defense response (Casacubertaet al.1992; Rohrmeier and Lehle 1993; Morris et al. 1998; Simmonset al.2002). We examined their expression in relation to developingRp1-D21lesions by RT–PCR. All four of the genes were markedly induced in plants exhibiting the Rp1-D21 phenotype compared to the wild-type siblings (Figure 3). These results support the conclusion that the cell death lesions that form on Rp1-D21mutants arebona fideHR lesions and that the Rp1-D21phenotype represents a spontaneous induction of the HR response.
The phenotype conferred by Rp1-D21 is variable
depending on the genetic background: The
Rp1-D21-H95 heterozygote line was crossed to a diverse set of 26 inbred lines comprising most of the founders of the maize nested association mapping (NAM) population
(Yuet al.2008). The resulting F1families, segregating
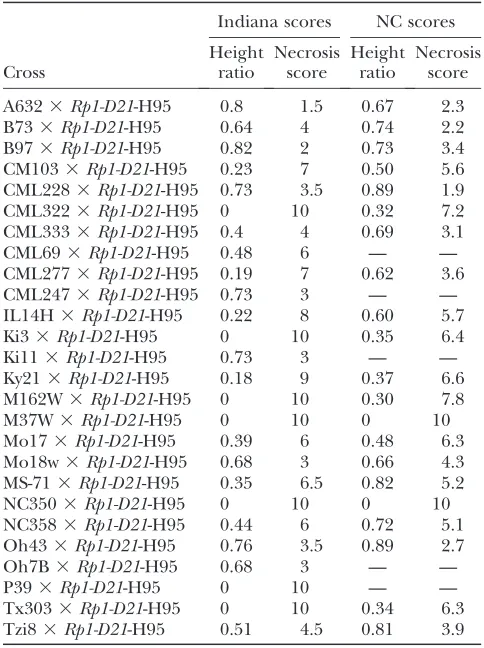
1:1 for the mutant phenotype, were grown in the field in Indiana and North Carolina. A high degree of variation was observed in theRp1-D21phenotype, depending on the genetic background in both quantitative (Table 1 and Figure 4) and qualitative (Figure 5) terms. The HR phenotype conferred byRp1-D21was so strong in some F1families that all the mutant plants died within 4 or 5
weeks after germination. In other F1 families the HR
phenotype was extremely mild (Table 1 and Figure 4). It was noted that F1 families derived from crosses with
Mo17 and B73, the two parents of the IBM population, differed substantially for the HR phenotype, the B73 cross being relatively mild and the Mo17 cross, relatively severe. Not surprisingly, the severity of the HR pheno-type was well correlated with the degree of stunting observed when comparing the wild-type to the mutant individuals within each F1family (Table 1). It should be
noted that since different crosses produce different levels of heterosis, the appropriate measure of stunting is the ratio between wild-type and mutant individuals within a family rather than an absolute measure of Figure2.—In situstaining of developingRp1-D21lesions
with nitroblue tetrazolium (A) and di-amino benzadine (B), show-ing the production of superoxide and H2O2,respectively.
height or yield. It was also evident that while the scores recorded in Indiana and North Carolina were highly correlated (.0.8 Person correlation coefficient for both traits), the phenotype was generally more severe in Indiana. This is likely due to the lower temperatures in the field in Indiana; theRp1-D21phenotype is temper-ature sensitive (Huet al.1996).
Identification of a QTL for suppression of the
Rp1-D21 phenotype: F1 families derived from the cross
between the Rp1-D21-H95 heterozygote line and 233 IBM lines were assessed and scored as detailed in materials and methods. The correlations between the average sAUDPC scores for the two replications in NC ’07 and NC ’08 were 0.75 and 0.80, respectively. The correlations between all traits for all environments were
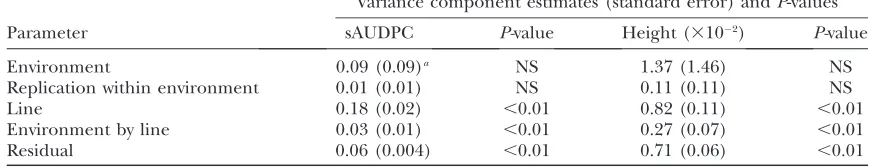
moderate to high and all were highly significant (P, 0.0001; see Table 2). In the field tests, line and line-by-environment interactions were the main significant contributors to phenotypic variance for sAUDPC and height (Table 3). Environmental effects were large for both the phenotypes but they were not significant due to their large standard errors (Table 3).
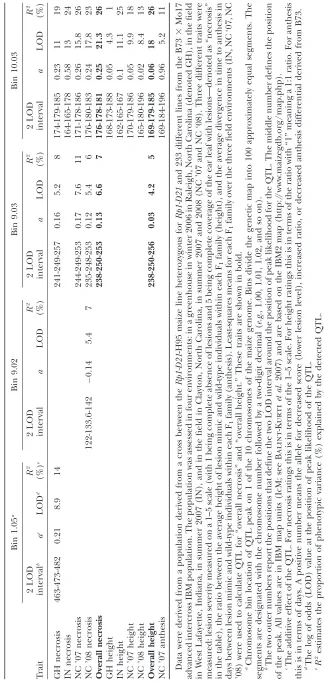
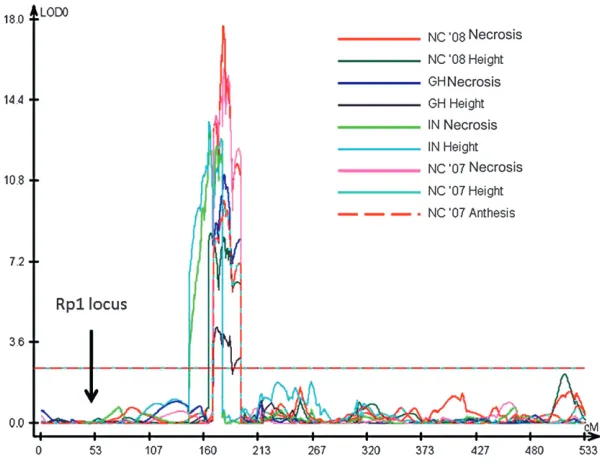
The strongest QTL identified for each trait and for each environment was on chromosome 10 in bin 10.03 (see Table 4). Although the detected QTL did not completely overlap in every case, they were so close that it is likely that they were all caused by the same under-lying gene or genes (Figure 6). This QTL accounted for between 10 and 26% of the total variation, depend-ing on the trait and the environment. For 6 of the 11 trait/environment combinations analyzed, the bin 10.03 QTL was the only significant QTL detected. We have termed this QTLHrml1 for HR-modulating locus 1. A smaller effect QTL for GH Necrosis and NC Necrosis was also detected in bin 9.03 for 5 trait/ environments including overall necrosis and overall height. A QTL of modest effect was identified in bin 9.02 for NC ’08 necrosis. Effects were also detected at this locus in bin 9.02 for most of the necrosis traits, but they did not rise to the level of significance as defined by permutation analysis.
A QTL for GH Necrosis was detected in bin 1.05. There was no effect at this locus for any other trait. Since the GH traits were measured on young plants using scores taken between 17 days after planting to 44 days after planting, we thought this might be a juvenile-plant-specific QTL. To test this hypothesis we analyzed alone the earliest scores taken in NC ’07 and NC ’08 (which were taken at 24 and 37 days after planting respectively). We did not find an effect on these traits in bin 1.05 (data not shown).
The Hrml1 locus effects the RP1-D21 phenotype in
other crosses: To check if theHrml1 locus modulated
the effect ofRp1-D21in other crosses, we analyzed the genetic basis for suppression of theRp1-D21 HR phe-notype in another inbred line A632, which, in crosses
withRp1-D21-H95, suppressed theRp1-D21 phenotype
even more strongly than B73. To accomplish this, a ‘‘pseudo-F2population’’ was generated by crossing A632
andRp1-D21-H95 to generate an F1population
segre-gating 1:1 for wild-type to mutant plants. Wild-type F1
plants were then crossed as females to their mutant siblings. The key reason for using this approach to gen-erate an F2mapping population was to keep the copy
number of the Rp1-D21 allele constant in all mutant plants so that variation in the mutant phenotype was not due to different numbers of copies (onevs.two) of the
Rp1-D21 allele. BecauseRp1-D21 behaves in a partially
dominant manner, plants containing two copies of the mutant allele (homozygous forRp1-D21) would be more severe than plants carrying a singleRp1-D21allele ( Rp1-D21 heterozygotes). As expected, a range of variation
TABLE 1
The diversity of theRp1-D21-mediated HR in maize
Indiana scores NC scores
Cross
Height ratio
Necrosis score
Height ratio
Necrosis score
A6323Rp1-D21-H95 0.8 1.5 0.67 2.3
B733Rp1-D21-H95 0.64 4 0.74 2.2
B973Rp1-D21-H95 0.82 2 0.73 3.4
CM1033Rp1-D21-H95 0.23 7 0.50 5.6 CML2283Rp1-D21-H95 0.73 3.5 0.89 1.9 CML3223Rp1-D21-H95 0 10 0.32 7.2 CML3333Rp1-D21-H95 0.4 4 0.69 3.1
CML693Rp1-D21-H95 0.48 6 — —
CML2773Rp1-D21-H95 0.19 7 0.62 3.6
CML2473Rp1-D21-H95 0.73 3 — —
IL14H3Rp1-D21-H95 0.22 8 0.60 5.7
Ki33Rp1-D21-H95 0 10 0.35 6.4
Ki113Rp1-D21-H95 0.73 3 — —
Ky213Rp1-D21-H95 0.18 9 0.37 6.6 M162W3Rp1-D21-H95 0 10 0.30 7.8
M37W3Rp1-D21-H95 0 10 0 10
Mo173Rp1-D21-H95 0.39 6 0.48 6.3 Mo18w3Rp1-D21-H95 0.68 3 0.66 4.3 MS-713Rp1-D21-H95 0.35 6.5 0.82 5.2
NC3503Rp1-D21-H95 0 10 0 10
NC3583Rp1-D21-H95 0.44 6 0.72 5.1 Oh433Rp1-D21-H95 0.76 3.5 0.89 2.7
Oh7B3Rp1-D21-H95 0.68 3 — —
P393Rp1-D21-H95 0 10 — —
Tx3033Rp1-D21-H95 0 10 0.34 6.3 Tzi83Rp1-D21-H95 0.51 4.5 0.81 3.9
of theRp1-D21 phenotype was detected in the F2
pop-ulation, including many plants that exhibited a highly suppressedRp1-D21phenotype. DNA was extracted from 35 of the most highly suppressed plants as well as from another 23 mutants randomly selected from a popula-tion of about 250 plants. These samples were evaluated for the segregation pattern of an Hrml1-linked SSR marker (umc1962), which was found to be polymorphic
between A632 and H95. This marker exhibited no significant segregation distortion at the marker locus in the randomly selectedRp1-D21plants (5 homozygous H95, 13 heterozygotes, 5 homozygous A632). However, all 35 Rp1-D21 plants having a highly suppressed phe-notype were homozygous for the A632 allele atumc1962, suggesting that these suppressed plants were homozy-gous for the A632Hrml1 allele and that the suppressive Figure 4.—The progression of the Rp1-D21 phenotype in crosses between the Rp1-D21-H95 line and the lines indicated.
effect of the A632Hrml1 allele was either recessive or partially dominant.
DISCUSSION
One standard way to identify components comprising genetic networks controlling biological processes is to do second-site mutagenesis (SSM) in lines that already possess mutations in genes affecting the phenotype of interest to reveal other genes that suppress or enhance the effect of the mutation (Page and Grossniklaus 2002). For instance, many of the genes known to be involved in the plant defense response were identified by this method (e.g., Li et al. 2001). Mutant-Assisted Gene Identification and Characterization provides a complimentary approach that allows one to tap into an
additional, vast resource of genetic variation—natural variation, produced over millions of years of evolution
( Johalet al. 2008). Results presented here show that
Mutant-Assisted Gene Identification and Characteriza-tion is a viable approach for discovering natural varia-tion underlying the HR response. Just as breeders have for many years exploited the high level of diversity in R genes produced by diversifying selection during evolu-tion, so now Mutant-Assisted Gene Identification and Characterization provides a way in which diversity in the downstream components of the HR can be systemati-cally identified. Mutant-Assisted Gene Identification and Characterization is conceptually similar to the SSM approach; however, instead of using induced variation, it relies on variation that is present naturally. For each locus, each different allele has presumably been selected
TABLE 2
Pearson correlation coefficients between different measured parameters affecting lesion mimic severity conferred by theRp1-D21gene
GH necrosis
GH height
IN necrosis
IN height
NC ‘07 necrosis
NC ’08 necrosis
NC ‘07 height
NC ‘08 height
GH height 0.58
IN necrosis 0.54 0.52
IN height 0.60 0.60 0.85
NC ’07 necrosis 0.69 0.50 0.73 0.72
NC ’08 necrosis 0.63 0.47 0.72 0.72 0.77
NC ’07 height 0.52 0.43 0.68 0.66 0.71 0.71
NC ’08 height 0.46 0.34 0.58 0.55 0.54 0.77 0.57
NC ’07 anthesis 0.39 0.46 0.56 0.54 0.56 0.48 0.61 0.28
Data were derived from a population from a cross between theRp1-D21-H95 maize line heterozygous forRp1-D21and 233 dif-ferent lines from the B733Mo17 advanced intercross IBM population. The population was assessed in four environments: in a greenhouse in winter 2006 in Raleigh, North Carolina (denoted GH), in the field in West Lafayette, Indiana, in summer 2007 (IN), and in the field in Clayton, North Carolina, in summer 2007 and 2008 (NC ’07 and NC ‘08). Three different traits were measured: lesion severity measured on a 1–5 scale (with 1 being complete absence of lesions and 5 being complete coverage of the ear leaf with lesions—denoted as ‘‘necrosis’’ in the table), the ratio between the average height of lesion mimic and wild-type individuals within each F1family (height), and the average divergence in time to anthesis in days between lesion mimic and wild-type individuals within each F1family (anthesis). This last trait was measured only in Clayton, North Carolina, on 2007.
TABLE 3
Variance component estimates and standard errors for standardized area under disease progress curve (sAUDPC) for theRp1-D21lesion phenotype and the mutant:wild type height ratio (Height) for a
population consisting of F1families from a cross betweenRp1-D21-H95 heterozygote and 233 lines from the IBM population
Variance component estimates (standard error) andP-values
Parameter sAUDPC P-value Height (310 2) P-value
Environment 0.09 (0.09)a NS 1.37 (1.46) NS
Replication within environment 0.01 (0.01) NS 0.11 (0.11) NS
Line 0.18 (0.02) ,0.01 0.82 (0.11) ,0.01
Environment by line 0.03 (0.01) ,0.01 0.27 (0.07) ,0.01
Residual 0.06 (0.004) ,0.01 0.71 (0.06) ,0.01
The populations were scored in the field in Clayton, North Carolina, in the summers of 2007 and 2008 (two replications each) and in West Lafayette, Indiana, in 2007 (one replication). NS, not significant.
for under specific environmental conditions and it is therefore likely that the natural variation unearthed by Mutant-Assisted Gene Identification and Characteriza-tion represents variaCharacteriza-tion that could be adaptive and immediately valuable.
For the HR response conferred byRp1-D21, which is a partially dominant mutant, another significant advan-tage of this approach is that it provides a highly quan-titative and easy to measure parameter for the HR trait, which in the past could only be scored subjectively. We show that the severity of the HR response is positively correlated with the degree of stunting experienced by
anRp1-D21 mutant, such that the more severe the HR
response, the more severe was stunting of theRp1-D21 mutant. Thus using an Rp1-D21 mutant in heterozy-gous condition is beneficial, in that it allows the height ratio to be used as a highly sensitive and easy to record parameter of the HR response. This measure also mit-igates against any bias that might arise as a result of different levels of heterotic vigor in different crosses. Height ratio obviously cannot be used with segregating population such as an F2 population in which every
individual plant is genetically distinct. The remarkable genetic background-dependant variation in the pheno-type conferred byRp1-D21is illustrated in Table1 and Figure 4. The fact that these comparisons were made between F1hybrids, which shared 50% of their genome
in common, makes the variation all the more noteworthy. A major QTL, termed Hrml1, was detected in bin 10.03 in every trait and every environment assessed.
Hrml1represents a major modifier of theRp1-D21lesion
mimic phenotype, with the B73 allele at this locus suppressing the phenotype and the Mo17 allele en-hancing it. A recent review of the architecture of disease resistance in maize (Wisseret al.2006), despite
report-ing coverage of 89% of the genome with disease resistance QTL, did not report a single major resistance gene or resistance QTL in bin 10.03, with the possible exception of a single QTL for gray leaf spot resistance, which had been mapped with poor precision.
Further work is required to identify the gene or genes underlying Hrml1. It is likely though that this locus is involved in the pathway controlling the elicitation or local spread of HR. We are currently performing de-tailed image analysis experiments designed to deter-mine whether the B73 Hrml1 allele suppresses lesion initiation or lesion spread (or both). We are also cur-rently working to construct B73 near isogenic lines differing forHrml1We will further cross them to lines carrying otherRp1alleles to confirm that this locus also modifies the wild-type Rp1-mediated response. It also remains to be determined whether Hrml1 modulates cell-death phenotypes conferred by other major, HR-conferring, maize disease-resistance genes such as Rxo
(Zhao et al. 2004), other Rp genes (e.g., Webb et al.
2002), and Rpp genes (Storey and Howland 1957; Futrellet al.1975; Chenet al.2004) and possibly also by non-HR causes of programmed cell death (Buckner
et al.2000).
It should be noted that, since we were assessing the effect of these genes in F1hybrids between IBM lines and
the Rp1-D21-H95 rather than in inbred lines, for a
effects when present in homozygous form could have been missed by this approach. This class of modifiers could in theory be identified by generating additional segregating populations, such as a backcross or an F2
population such as the population used in this article to show thatRp1-D21-suppressing alleles ofHrml1also exits in A632. Conversely, the A632Hrml1allele identified here cannot be completely dominant as otherwise a mixture of A632 heterozygotes and homozygotes at theHrml1locus would have been identified among the most repressed individuals in the F2 population, rather than them all
being A632 homozygotes. It is therefore quite likely that theHrml1 suppressive allele is partially dominant in both cases. Further work using near-isogenic lines will clarify the allelic relationships at this locus.
It should also be noted that, in addition toHrml1, the Rp1locus itself is present on chromosome 10. However it is more than 100 IBM map units (approximately equivalent to 25 cM) away from the main QTL peak and therefore cannot be responsible for the QTL. To confirm this we divided up the IBM population into two groups, one homozygous B73 across theRp1locus and the other homozygous Mo17 (there was also a sizable group that was recombinant across the Rp1 locus—this group was ignored for this analysis). A highly significant effect at Hrml1 was detected by analysis of each group separately (data not shown). In other words,
an Hrml1 effect could be detected in populations in
whichRp1was not segregating. Further evidence for the fact that Hrml1 is not an Rp1 allele comes from the analysis of the A6323 Rp1-D21-H95 F2population. In
this case, all the F2plants that show aRp1-D21
pheno-type must be heterozygous at theRp1locus, with one copy of Rp1-D21 and one copy of either the wild-type A632 Rp1 allele or the wild-type H95 allele. In this population the profound effect of Hrml1 can still be detected as all the most suppressed plants are A632 homozygotes at theHrml1locus.
Although Mutant-Assisted Gene Identification and Characterization was conceived during genetic dissec-tion of genetic background effects onles23, a recessive lesion mimic mutant of maize (Penninget al.2004), use of an aberrant phenotype to identify genes involved in specifying specific phenotypes, one of the ideas un-derlying Mutant-Assisted Gene Identification and Char-acterization, has been used in the past in both plants and animals. Indeed, most restorers of fertility genes in all crops have been identified essentially by genetic schemes akin to Mutant-Assisted Gene Identification and Characterization (Duvick 1956). In Drosophila, many components of the sevens pathway that executes eye formation were identified using a genetically hyper-sensitive background generated by the ectopic expres-sion of a component of the pathway (Gibson and Dworkin2004). With Mutant-Assisted Gene Identifica-tion and CharacterizaIdentifica-tion we are able to addiIdentifica-tionally harness both the large amount of genetic diversity in
maize (Liu et al.2003) and the excellent genetic and genomic resources available for the crop such as RILs and NILs for the discovery of natural genes or gene variants. A key advantage here is that, in many cases, one must do the phenotyping only, the genotyping data of the resource being already available. The IBM mapping population used to uncover Hrml1 is an AIL maize population derived from a cross between the maize inbreds B73 and Mo17 with four generations of random mating following the formation of the F2generation and
prior to the development of inbred lines (Lee et al. 2002). The increased opportunity for recombination has had the effect of expanding the genetic map approximately fourfold compared to nonintermated, conventional RIL populations (Leeet al.2002). The IBM population consists of a relatively large number of lines (302), which have been densely genotyped with more than 2000 molecular markers (Coeet al.2002). Another advantage of using RILs for gene discovery is that the scores are derived from families and not individual segregants, as in an F2 population. So the same
pop-ulation can be evaluated for multiple traits, multiple times, and at multiple locations.
The maize nested association mapping (NAM) pop-ulation (Yuet al.2008) is a recently established 5200-line mapping population that consists of 26 RIL subpopula-tions, each of which was derived from a cross between B73 and 1 of 25 other diverse lines. AdditionalHrmlloci can almost certainly be identified using the NAM population with an approach identical to that used here. We demonstrate in this work that a great deal of diversity capable of modulating the HR response exists in the NAM founders (Table 1). A study is underway in our labs to conduct a Mutant-Assisted Gene Identifica-tion and CharacterizaIdentifica-tion screen on the NAM RILs.
One concern could be whether Rp1-D21 triggers a
bona fide HR rather than causing cell death by some
other mechanism. There are many reasons to suggest that it does. First, we know thatRp1-D21is an autoactive allele of Rp1, a known disease resistance gene that confers an HR in response to specificP. sorghiisolates. In addition, Figures 2 and 3 show that the Rp1-D21 phenotype is associated with the production of super-oxide and H2O2, together with the induction of the
genesPR1,PR5,PRms, and WIP1, all hallmarks of abona fideHR. It should be noted that these genes can also be induced by a defense response not including HR and by various other stresses including wounding (Casacuberta
et al.1991, 1992; Rohrmeierand Lehle1993; Morris
et al. 1998; Dunkle and Levy 2000). Even so, the
preponderance of evidence suggests that Rp1-D21 triggers an exaggerated form of the normal maize hypersensitive response.
this study we have used this approach in conjunction with the Mutant-Assisted Gene Identification and Char-acterization concept and with modern mapping resour-ces such as the IBM population. We have identified
Hrml1 as a naturally occurring suppressor allele on
chromosome 10 and have demonstrated that many more naturally occurring alleles likely effect the defense response and can be identified in a straightforward way. Most important, we have demonstrated the utility of the Mutant-Assisted Gene Identification and Characteriza-tion approach. Many mutants that could be exploited for Mutant-Assisted Gene Identification and Character-ization already exist in maize and many other plant systems. For example, mutants that confer aluminum sensitivity (Pascholati et al.1986; Sibovet al. 1999), alterations in starch accumulation (Braunet al.2006), or sensitivity to drought (Postlethwaitand Nelson 1957) are available and could be used in a conceptually very similar way to that demonstrated here to identify useful variation in the traits that they affect. In other cases, mutagenesis screens could be designed to specif-ically identify mutants for use in Mutant-Assisted Gene Identification and Characterization. Ultimately Mutant-Assisted Gene Identification and Characterization is an approach that could be harnessed to identify naturally occurring, useful alleles important for a large number of traits in many systems.
We are grateful to the following for assistance and valuable advice: Cliff Weil, Randy Wisser, Rebecca Nelson, Donna Stephens, Kristen Kump, Rahul Dhawan, and Hugh Young. This work was funded by USDA–ARS, Purdue University, and a National Science Foundation (NSF) Grant 0822495.
LITERATURE CITED
Balint-Kurti, P. J., J. C. Zwonitzer, R. J. Wisser, M. L. Carson, M. Oropeza-Rosas et al., 2007 Precise mapping of quantitative trait loci for resistance to southern leaf blight, caused by Cochlio-bolus heterostrophusrace O, and flowering time using advanced in-tercross maize lines. Genetics176:645–657.
Bent, A. F., and D. Mackey, 2007 Elicitors, effectors, and R Genes: the new paradigm and a lifetime supply of questions. Ann. Rev. Phytopath.45:399–436.
Braun, D. M., Y. Ma, N. Inada, M. G. Muszynskiand R. F. Baker, 2006 Tie-dyed1 regulates carbohydrate accumulation in maize leaves. Plant Physiol.142:1511–1522.
Buckner, B., G. S. Johaland D. Janick-Buckner, 2000 Cell death in maize. Physiol. Plantarum108:231–239.
Campbell, C. L., and L. V. Madden, 1990 Introduction to Plant Disease
Epidemiology, pp. 192–194. John Wiley & Sons, New York. Casacuberta, J. M., P. Puigdomenech and B. San Segundo,
1991 A gene coding for a basic pathogenesis-related pr-like pro-tein fromZea maysmolecular cloning and induction by a fungus
Fusarium moniliformein germinating maize Seeds. Plant Mol. Biol. 16:527–536.
Casacuberta, J. M., D. Raventos, P. Puigdomenechand B. San Segundo, 1992 Expression of the gene encoding the Pr-like protein Prms in germinating maize embryos. Mol. Gen. Genet. 234:97–104.
Chen, C. X., Z. L. Wang, D. E. Yang, C. J. Ye, Y. B. Zhaoet al., 2004 Molecular tagging and genetic mapping of the disease re-sistance geneRppQto southern corn rust. Theor. Appl. Genet. 108:945–950.
Coe, E., K. Cone, M. McMullen, S.-S. Chen, G. Davis et al., 2002 Access to the maize genome: an integrated physical and genetic map. Plant Physiol.128:9–12.
Collins, N., J. Drake, M. Ayliffe, Q. Sun, J. Ellis et al., 1999 Molecular characterization of the maizeRp1-Drust resis-tance haplotype and its mutants. Plant Cell11:1365–1376. Dodds, P. N., G. J. Lawrence, A. M. Catanzariti, T. Teh, C. I. Wang
et al., 2006 Direct protein interaction underlies gene-for-gene specificity and coevolution of the flax resistance gene-for-genes and flax rust avirulence genes. Proc. Natl. Acad. Sci. USA103: 8888–8893.
Dunkle, L. D., and M. Levy, 2000 Genetic relatedness of African and United States populations ofCercospora zeae-maydis. Phyto-path.90:486–490.
Duvick, D. N., 1956 Allelism and comparative genetics of fertility restoration of cytoplasmically pollen sterile maize. Genetics41: 544–565.
Futrell, M. C., A. L. Hookerand G. E. Scott, 1975 Resistance in maize to corn rust, controlled by a single dominant gene. Crop Sci.15:597–599.
Gibson, G., and I. Dworkin, 2004 Uncovering cryptic genetic var-iation. Nature Rev. Genet.5:681–690.
Goritschnig, S., Y. Zhangand X. Li, 2007 The ubiquitin pathway is required for innate immunity in Arabidopsis. Plant J.49:540– 551.
Holub, E. B., 2007 Natural variation in innate immunity of a pio-neer species. Curr. Op. Plant Biol.10:415–424.
Hu, G., T. E. Richter, S. H. Hulbertand T. Pryor, 1996 Disease lesion mimicry caused by mutations in the rust resistance gene Rp1. Plant Cell8:1367–1376.
Johal, G. S., P. Balint-Kurtiand C. F. Weil, 2008 Mining and har-nessing natural variation: a little MAGIC. Crop Sci.48:2066–2073. Jones, J. D. G., and J. L. Dangl, 2006 The plant immune system.
Nature444:323–329.
Lee, M., N. Sharopova, W. D. Beavis, D. Grant, M. Kattet al., 2002 Expanding the genetic map of maize with the intermated B73 X Mo17 (IBM) population. Plant Mol. Biol.48:453–461. Levine, A., R. Tenhaken, R. Dixonand C. Lamb, 1994 H2O2from
the oxidative burst orchestrates the plant hypersensitive disease resistance response. Cell79:583–593.
Li, X., J. D. Clarke, Y. Zhangand X. Dong, 2001 Activation of an EDS1-mediated R-gene pathway in thesnc1mutant leads to con-stitutive, NPR1-independent pathogen resistance. Mol. Plant-Microbe Interact.14:1131–1139.
Liu, K., M. Goodman, S. Muse, J.-S. Smith, E. Buckler et al., 2003 Genetic structure and diversity among maize inbred lines as inferred from DNA microsatellites. Genetics165:2117–2128. Mackey, D., Y. Belkhadir, J.-M. Alonso, J.-R. Eckerand J.-L. Dangl, 2003 Arabidopsis RIN4 is a target of the type III virulence effec-tor AvrRpt2 and modulates RPS2-mediated resistance. Cell112: 379–389.
Morris, S. W., B. Vernooij, S. Titatarn, M. Starrett, S. Thomas
et al., 1998 Induced resistance responses in maize. Mol. Plant Microbe Interact.11:643–658.
Mur, L. A., P. Kenton, A. J. Lloyd, H. Oughamand E. Prats, 2007 The hypersensitive response: The centenary is upon us but how much do we know? J. Exp. Bot.59:501–520.
Page, D. R., and U. Grossniklaus, 2002 The art and design of genetic screens: Arabidopsis thaliana. Nat. Rev. Genet. 3: 124–136.
Palma, K., Y. Zhangand X. Li, 2005 An importin alpha homolog, MOS6, plays an important role in plant innate immunity. Curr. Biol.15:1129–1135.
Pascholati, S. F., R. L. Nicholson and L. G. Butler, 1986 Phenylalanine ammonia-lyase activity and anthocyanin accumulation in wounded maize Zea–Mays mesocotyls. Phyto-pathol. Z.
Penning, B. W., G. S. Johaland M. M. McMullen, 2004 A major suppressor of cell death, slm1, modifies the expression of the maize (Zea maysL.) lesion mimic mutation les23. Genome47: 961–969.
Postlethwait, S. N., and O. E. Nelson, 1957 A chronically wilted mutant of maize. Am. J. Bot.44:628–633.
Microbe Interactions, edited by E. Nesterand D. Verma. Kluwer Academic, Dordrecht, The Netherlands.
Rohrmeier, T., and L. Lehle, 1993 WIP1, a wound-inducible gene from maize with homology to Bowman–Birk proteinase inhibi-tors. Plant Mol. Biol.22:783–792.
Shaner, G., and P. E. Finney, 1977 The effect of nitrogen fertilizer on expression of slow mildewing resistance in Knox wheat. Phy-topath.67:1051–1056.
Sibov, S. T., M. Gaspar, M. J. Silva, L. M. M. Ottoboni, P. Arrudaet al., 1999 Two genes control aluminum tolerance in maize: ge-netic and molecular mapping analyses. Genome42:475–482. Simmons, C. R., J. T. Tossberg, G. A. Sandahl, W. A. Marsh, P. F. Dowdet al., 2002 Maize pathogen defenses activated by aviru-lence gene avrRxv. Maize Genet. Coop. Newsl.76:40–41. Storey, H. H., and A. K. Howland, 1957 Resistance in maize to the
tropical American rust fungus,Puccinia polysoraUnderw. I. Genes Rpp1 and Rpp2. Heredity11:289–301.
Sun, Q., N. Collins, M. Ayliffe, S. M. Smith, J. Drake et al., 2001 Recombination between paralogues at theRp1rust resis-tance locus in maize. Genetics158:423–438.
Thordal-Christensen, H., Z. G. Zhang, Y. D. Weiand D. B. Collinge, 1997 Subcellular localization of H2O2in plants: H2O2
accumula-tion in papillae and hypersensitive response during the barley-powdery mildew interaction. Plant J.11:1187–1194.
Walbot, V., D. Hoisingtonand M. G. Neuffer, 1983 Disease le-sion mimic mutations, pp. 431–432 in Genetic Engineering of Plants, edited by T. Kosuge, C. P. Meredithand A. Hollaender. Plenum Press, New York.
Webb, C. A., T. E. Richter, N. C. Collins, M. Nicolas, H. N. Trick
et al., 2002 Genetic and molecular characterization of the maize
Rp3rust resistance locus. Genetics162:381–394.
Wisser, R. J., P. J. Balint-Kurtiand R. J. Nelson, 2006 The genetic architecture of disease resistance in maize: a synthesis of pub-lished studies. Phytopath.96:120–129.
Xin, Z., J. P. Velten, M. J. Oliverand J. J. Burke, 2003 High-throughput DNA extraction method suitable for PCR. BioTech-niques34:820–826.
Yu, J., J. B. Holland, M. D. McMullen and E. S. Buckler, 2008 Genetic design and statistical power of nested association mapping in maize. Genetics178:539–551.
Zhang, Y., S. Goritschnig, X. Dongand X. Li, 2003 A gain-of-function mutation in a plant disease resistance gene leads to constitutive activation of downstream signal transduction pathways in sup-pressor of npr1–1, constitutive 1. Plant Cell15:2636–2646. Zhang, Y., and X. Li, 2005 A putative nucleoporin 96 Is required for
both basal defense and constitutive resistance responses medi-ated by suppressor of Npr1–1, constitutive 1. Plant Cell 17: 1306–1316.
Zhao, B. Y., E. Ardales, E. Brasset, L. E. Claflin, J. E. Leachet al., 2004 The Rxo1/ Rba1 locus of maize controls resistance reac-tions to pathogenic and non-host bacteria. Theor. Appl. Genet. 109:71–79.