ISSN(Online): 2319-8753 ISSN (Print): 2347-6710
International Journal of Innovative Research in Science,
Engineering and Technology
(An ISO 3297: 2007 Certified Organization)
Website: www.ijirset.com
Vol. 6, Issue 8, August 2017
Dietary Assessment Methods Based On Image
Processing: A Review
Akshada Gade1, Dr. Arati Vyavahare2
P.G. Student, Department of Electronics and Telecommunication Engineering, P. E. S. Modern College of Engineering,
Pune, Maharashtra, India1
Professor, Department of Electronics and Telecommunication Engineering, P. E. S. Modern College of Engineering,
Pune, Maharashtra India2
ABSTRACT: Nutritional intake is the procedure to find out what somebody consumes throughout the route of a day
time offers treasured nearby for arranging intrusion programs for anticipation of several unrelieved diseases. Quantifying correct dietary consumption is deliberated to be an exposed research obstruction in the food and health fields. It is an important step in the success of a healthy diet. This paper gives a brief review of different methods designed for dietary assessment to mechanically recognize and discover the type of food from large quantity of images and volume estimation is made for calorie and food intake. PDA, TADA, DDRS, IMG 2 calorie, DLW, FFQ and FRS all these systems propose an efficient manner to quantify and manage every day food intake for dieticians. The objective is to describe the different methods used in dietary assessment approach for segmentation and classification. The system will capture food images before and after eating events. Then pre-processes, segmented and classified for the detection of the food type and amount, making use of look-up table every food item is corresponds to a pre-defined quantity of calories, derived from numerous parameters for instance food shape, color or texture. From all these methods few methods developed especially for children or for standard food stuff and some of them needed assumptions to proceed.
KEYWORDS: Image Analysis, Image segmentation, Feature Extraction, Dietary Assessment.
I.INTRODUCTION
Dietetic epidemiology is anxious by computing dietary exposures as well as the direct relation of these exposures with possibility of illness and disease. Diet signifies one of the largest parts of general biological exposures; therefore the perfect evaluation of foodstuff and drink ingestion is challenging. The increase fear with sense to unrelieved diseases or different health problems interrelated to eating habits together with cancer and obesity. Single way to deal with this trouble is to inspire every individual to care for health and wonderful way of life by participating in the management of long-time phase fitness selections. Regular nutritional assessment process is constituted of on paper or verbally declared approach which might be time consuming and repetitive, also require a nutrition expert to conclude, and impossible for daily examining. The assessment of food ingestion has been assessed in the earlier period by a food record (FR), the 24-hour dietary recall (24HR), and a food frequency questionnaire (FFQ) with external validation by doubly-labeled water (DLW) and urinary nitrogen [4].
ISSN(Online): 2319-8753 ISSN (Print): 2347-6710
International Journal of Innovative Research in Science,
Engineering and Technology
(An ISO 3297: 2007 Certified Organization)
Website: www.ijirset.com
Vol. 6, Issue 8, August 2017
TABLE I
Name of Method
Description Advantages Disadvantages
Traditional Dietary Assessment Methods DLW (Doubly Labeled Water)
Standard method for measuring total energy expenditure.
It measures the concentration of few elements from urine samples when a dose of heavy oxygen, Hydrogen is given to the patient.
1)It is helpful in case of long time in measurement issue related to dietary intake.
1)Most expensive due
to need of costly
equipment to estimate concentration
2)Need several weeks to get the results. 3)It is not possible to measure quantity and category of food.
Traditional Dietary Assessment Methods 24-Hour Dietary Recall
It requires a trained dietician or interviewer.
The patient needs to remember type of food consumed, after which treatment or diet plan is made accordingly.
1)Requires only
short term memory.
2)No need of
literate population
1)Possibility of delay
and inaccurate
information of eaten food.
2)Self monitoring and lack of communication with interviewer. Food Record
Method
Following consumer food dairy list containing type and quantity of food. Lists are sending to a group.
Nutrition specialist analyses,
evaluates and compares the
received data to reduce error.
1)It does not need to rely on memory.
2)Food intake
weight is
measured.
1)It does not measure the eating behaviour of patient.
2)Cannot used over
short time periods.
FFQ
(Food Frequency Questionnaire)
Developed to do nutritional
surveys in large groups. Contain record of food items and an assortment of selection links to the regularity of intake. Every region has their questionnaire with the popular food in that area.
1)Designed to
evaluate eating
habits.
2)Does not require
a highly
experienced interviewer.
1) It does not consider the food intake amount. 2) Presence of
incomplete data
Portion Size Estimation
Motive is to train people to improve their intake assumptions.
1)It is a contributor to under reporting problem.
2)Training can
improve portion
size estimation.
1)Amorphous foods
gives less accuracy
ISSN(Online): 2319-8753 ISSN (Print): 2347-6710
International Journal of Innovative Research in Science,
Engineering and Technology
(An ISO 3297: 2007 Certified Organization)
Website: www.ijirset.com
Vol. 6, Issue 8, August 2017
TABLE II
Name of Method
Description Advantages Disadvantages
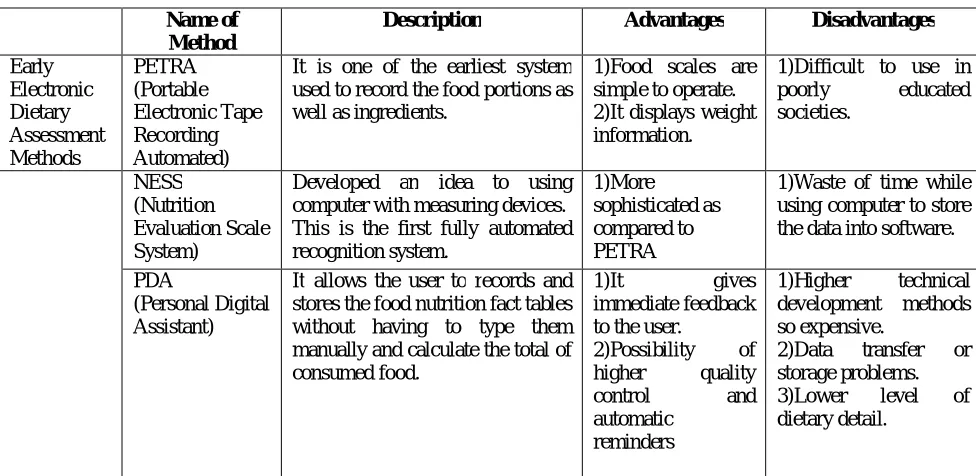
Early Electronic Dietary Assessment Methods PETRA (Portable Electronic Tape Recording Automated)
It is one of the earliest system used to record the food portions as well as ingredients.
1)Food scales are simple to operate. 2)It displays weight information.
1)Difficult to use in
poorly educated
societies.
NESS (Nutrition Evaluation Scale System)
Developed an idea to using computer with measuring devices. This is the first fully automated recognition system.
1)More sophisticated as compared to PETRA
1)Waste of time while using computer to store the data into software.
PDA
(Personal Digital Assistant)
It allows the user to records and stores the food nutrition fact tables without having to type them manually and calculate the total of consumed food.
1)It gives
immediate feedback to the user.
2)Possibility of
higher quality
control and
automatic reminders
1)Higher technical
development methods so expensive.
2)Data transfer or
storage problems.
3)Lower level of
dietary detail.
In case of recent electronic dietary assessment approach technical devices are use to collect information rather than food intake or energy expenditure, such as heart rate, duration of sleep, medication taken, pain, physical activities etc. Few methods are based on sensors, neural network, and intelligent system.
TABLE III Name of
Method
Description Advantages Disadvantages
Recent Electronic Dietary Assessment Methods ADM (Automatic Dietary Monitoring)
It uses sensors to monitor the weight
of user’s bite and placed a
microphone in the external ear to record chewing sounds which will help to find out type of food eaten.
1)It reduce the
burden from the user mind to report about type of food consumed. 2)Gives continuous
information from
chewing sound
sensor.
1)User is slightly
uncomfortable to wear
microphone and
sensors.
2)Different type of
food gives same
chewing sounds. 3)Less accurate.
Dietary
-aware dining table
It uses surface sensor (RFID) to determine category of food eaten and integrate scale on a table to compute mass of food.
1)Allows multiple dining participants.
2)Possible multi
sensor approach.
1)Difficult to use in several locations.
2)Complexity to
attached RFID tag to served food.
II.IMAGE BASED DIETARY ASSESSMENT APPROACH
ISSN(Online): 2319-8753 ISSN (Print): 2347-6710
International Journal of Innovative Research in Science,
Engineering and Technology
(An ISO 3297: 2007 Certified Organization)
Website: www.ijirset.com
Vol. 6, Issue 8, August 2017
Food images are captured with the help of smart phone or camera. Reduction of noise and blur is done at the initial stage as the pre-processing of the image. Segmentation detaches the food items from background area of the image. Segmentation deals with the image recognition, recording and databases retrieval. The intensity characteristics, color and structure features are extracted. Computed features are arranged into vectors those are functional space. Use classifier to categorize feature channels. Correct food object identification will results the classifiers accurateness. Labelled image with each pixel label indicates class and procedure completed by taking reference of database images. For calculating area of the food portion a superimpose grid of squares approach is used on the image segments, where each square consists an identical number of pixels as a result equal area. The grid will simply match up with asymmetrical form. By using predefine amount of calories result will be displayed.
III.IMAGE BASED DIETARY ASSESSMENT METHODS
ISSN(Online): 2319-8753 ISSN (Print): 2347-6710
International Journal of Innovative Research in Science,
Engineering and Technology
(An ISO 3297: 2007 Certified Organization)
Website: www.ijirset.com
Vol. 6, Issue 8, August 2017
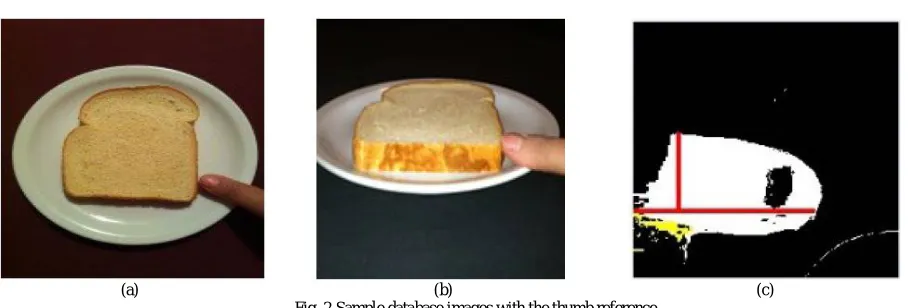
(a) (b) (c) Fig. 2.Sample database images with the thumb reference
Figure 2 (a), (b) shows sample database images with the thumb reference, (c) shows computation of thumb dimensions. Thumb uses for the size reference to compute real size of food portion. For users with thumb disability one can use another finger or coin. The reference source must be flexible, reliable and controllable.
There are four main steps for image based dietary assessment are as follows:
1) Pre-processing-
This involves operations like resizing/cropping, denoising, normalization or thresholding. When an image is resizes it changes information about its pixels. If any system is dealing with large size image it needs to work on large number of pixels and possibility that normal image processing techniques can be breakdown. So image will be resized as 500 × 500 pixels it will be easy for processing and does not looses important information in it Denoising algorithms or filtering methods helps to achieve noise reduction and feature preservation. Normalization needed to obtain consistency in dynamic range to avoid fatigue in image. To create binary images having exact range of pixels thresholding method is required. All these operations are used in pre-processing as per the requirements.
2) Segmentation-
ISSN(Online): 2319-8753 ISSN (Print): 2347-6710
International Journal of Innovative Research in Science,
Engineering and Technology
(An ISO 3297: 2007 Certified Organization)
Website: www.ijirset.com
Vol. 6, Issue 8, August 2017
(a) (b) Fig. 3. (a) Example of s-t graph (b) Graph cut for image segmentation
Figure 3 (a) shows example of s-t graph. In the graph pixels in the image relates with the neighbor nodes. N-links indicated by solid lines and t-links indicated by dotted lines. Pixel labelling is the most significant task achieve by minimizing energy function. While labelling any object s-node is set to 1 and for background t-node is set to 0. Figure 3.1 (b) shows graph cut of 3× 3image segmentation where widths of edges denote magnitude or weights [5].
(a) (b) (c) Fig. 4. Food Image Segmentation using graph cut
Figure 4 shows (a) Original image, (b) Image of the graph, (c) Region based triangulation of graph. It shows by using graph cut segmentation it is easy to found contour of food objects is helpful to extract correct and descriptive features. Texture segmentation- Gabor filters are used to determine local texture properties in the frequency domain [5]. It measures texture features by applying Gabor filter bank which contains Gabor filters along with Gaussian kernel functions moderated by sine wave in unlike orientations. Where need to focus on every single picture to a Gabor filter operation in window about all pixels. From the filter image estimated mean, standard deviation of energy also used as a feature. In this segmentation block size is proportional to the segment size. For functioning image is separated into 4×4 blocks and all those blocks are convolved with Gabor filter. By using factors such as orientations and scales, mean, variances of Gabor sizes calculated for every block. Gabor filters are useful to detect various texture types such as wavy, smooth, soft, porous and rough.
ISSN(Online): 2319-8753 ISSN (Print): 2347-6710
International Journal of Innovative Research in Science,
Engineering and Technology
(An ISO 3297: 2007 Certified Organization)
Website: www.ijirset.com
Vol. 6, Issue 8, August 2017
are good as they contain spatial information and consist of color correlogram, local color histogram and color difference histogram. As histogram is an easy operation but it is not robust to image size variances, rotation, size and displacement. Chromaticity distribution moment technique is tough beside noise and their magnitude is invariant in flipping and rotation [6]. It is an efficient method in case of image retrieval time.
3) Food Recognition -
Classification of distantly collected data is allocated to consequent levels regarding group with identical characters with objective of selecting several objects from each other in images. These levels are called as class. The operation of classification will be performed on the basis of defined features. Those features are in the feature space such as color, shape, texture or density. Classification separates feature space in classes depending on decision rule. Following steps shows the general classification procedure:
1) Defining classification classes based on the objective and characteristics of image information.
2) Selecting features to distinguish among the classes must be recognized via multi-spectral and multi-temporal
characteristics.
3) Sampling of training data with the aim to find out correct decision rules.
4) Various classification systems are used to compare with the training data to select the decision rule for successive classification.
5) Based on the decision rule pixels are classified into particular class. In reference with segmented area pixel by pixel classification or per-field classification is done.
6) Classifier results are checked and verified for reliability and accuracy.
Different types of classification methods are used for food image classification. Following table shows few methods with their advantages and disadvantages [7].
TABLE IV Classification
Method
Description Advantages Disadvantages
ANN (Artificial Neural Network)
Type of artificial intelligence which emulates actions of individual brain. Has a ability to store experiential information.
Uses Nonparametric approach. Presentation, correctness based on the network structure and quantity of inputs.
1) Able to present OR, AND, NOT functions. 2) A data driven self adaptive technique. 3) Capably deal with noisy inputs
4) Calculation rate is high.
1) Semantically poor. 2) Training is time consuming.
3) Difficulty of over fitting. 4) Tricky to decide category of the network architecture.
Decision Tree Analyse class membership by
frequently partitioning dataset into
identical subsets. Hierarchical
classifier allows the acceptations and denial of class labels at every intermediary step [5].
1) Use non-parametric approach.
2) No need of extensive design and training 3) Simple method 4) Computational efficiency is good
1) Becomes difficult for computation as different values are unsure when outcomes are correlated.
SVM (Support Vector Machine)
Construct hyper plane or set of hyper planes in a high- or infinite dimensional space, for classification. Larger the functional margin lower the generality fault.
1) Consist non linear transformation. 2) Computational complexity is reduced. 3) It eliminates the problem of over fitting
ISSN(Online): 2319-8753 ISSN (Print): 2347-6710
International Journal of Innovative Research in Science,
Engineering and Technology
(An ISO 3297: 2007 Certified Organization)
Website: www.ijirset.com
Vol. 6, Issue 8, August 2017
Fuzzy Measure It uses stochastic approach.
Different types of stochastic are combined where members of set of properties are fuzzy in nature. Execution and precision based on the fuzzy integral and threshold selection.
1) Effectively deal with uncertainty.
2) Properties are illustrated
by identifying stochastic relation.
1) Precise solution is depends upon direction of decision. 2) If prior knowledge is not available output is not efficient.
4) Calorie Measurement-
The objective is to measure the nutrition and calories from food image by using already stored nutrition fact tables and by evaluating the inputs from food image. It is final stage of the system.
Volume Measurement by Utilizing Area Size-
For calculating the area of a food used a superimpose grid of squares approach on the segments of image where all square consist an identical amount of pixels so the equivalent area. In this approach grid will simply match up with asymmetrical forms as most of the food type is available in irregular shapes. There is a possibility of estimation error but it will be decreased by making the grid finer. Based on processing ability and response time of the system one can regulate the granularity of the grid to balance among the two factors [8].
Food mass measurement-
Measuring the mass of food is important step which will direct the system to find the amount of calories. If an orange’s weight is 140 grams then approximate amount of calories will be 70. But if weight is 80 grams then calories will be 30. So the information of food dimension inside the image and nutrition table is essential which will give ability to the system to compute mass of the food in the image and measuring unit will be in grams.
IV.RESULTS
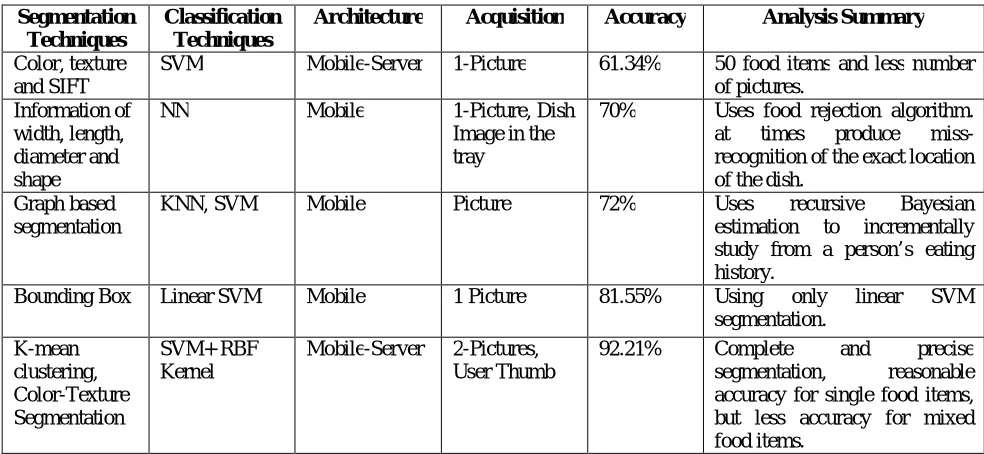
A multiple hypothesis dietary assessment systems use combination of segmentation and classification techniques to get more accurate results. Image processing is done through mobile and server or by mobile. The smart phone systems which are not using servers require long processing time. Table V shows results and analysis of comparison of different smart phone based food recognition methods.
TABLE V Segmentation
Techniques
Classification Techniques
Architecture Acquisition Accuracy Analysis Summary
Color, texture and SIFT
SVM Mobile-Server 1-Picture 61.34% 50 food items and less number
of pictures. Information of
width, length, diameter and shape
NN Mobile 1-Picture, Dish
Image in the tray
70% Uses food rejection algorithm.
at times produce
miss-recognition of the exact location of the dish.
Graph based segmentation
KNN, SVM Mobile Picture 72% Uses recursive Bayesian
estimation to incrementally
study from a person’s eating history.
Bounding Box Linear SVM Mobile 1 Picture 81.55% Using only linear SVM
segmentation. K-mean
clustering, Color-Texture Segmentation
SVM+ RBF Kernel
Mobile-Server 2-Pictures,
User Thumb
92.21% Complete and precise
segmentation, reasonable
ISSN(Online): 2319-8753 ISSN (Print): 2347-6710
International Journal of Innovative Research in Science,
Engineering and Technology
(An ISO 3297: 2007 Certified Organization)
Website: www.ijirset.com
Vol. 6, Issue 8, August 2017
V.CONCLUSION AND FUTURE SCOPE
Paper gives details of traditional dietary assessment methods and observed poor acceptance of these methods. Different smart phone based dietary assessment application methods with various segmentation and classification techniques for calorie measurement described in this paper. As food recognition is gaining more significance in health related application so to achieve this objective algorithms are developed, refined and varied with dataset of single and mixed food images. An electronic device such as Smartphone provides exclusive medium for gathering dietary information which reduces the burden on record keepers and recognize food type within 5 seconds. From their review took different approaches and solutions dealing with different architectures. Still there is scope to develop the system that is user friendly and appealing to all ages with different background. Also need to develop solutions for mixed food recognition in complex meal and computing resource with large amount of data analysis to achieve high accuracy and less processing time.
REFERENCES
[1] Fengqing Zhu, Marc Bosch,”Multiple Hypotheses Image Segmentation and Classification with Application to Dietary Assessment”, IEEE Journal of Biomedical and Health Informatics, Vol. 19, No. 1, January 2015.
[2] R.Surya, S.Saru Priya, ”Food Image Recognition Using Svm Classifier for Measuring Calorie and Nutrition Values”, International Journal of Scientific & Engineering Research, Volume 6, Issue 4, April-2015.
[3] Austin Myers, Nick Johnston, “Im2Calories: towards an automated mobile vision food diary”, IEEE International Conference on Computer Vision, 2015.
[4] Faliu Yi, Inkyu Moon, “Image Segmentation: A Survey of Graph-cut Methods”, IEEE, International Conference on Systems and Informatics, 2012.
[5] Parisa Pouladzadeh, Shervin Shirmohammadi,“Using graph cut segmentation for food calorie measurement”, IEEE, International Conference, June 2014.
[6] Divya Srivastava, Rajesh Wadhvani, “A Review: Color Feature Extraction Methods for Content Based Image Retrieval”, IJCEM International Journal of Computational Engineering & Management, Vol. 18 Issue 3, May 2015.
[7] Pooja Kamavisdar1, Sonam Saluja, “A Survey on Image Classification Approaches and Techniques”, International Journal of Advanced Research in Computer and Communication Engineering, Vol. 2, Issue 1, January 2013.