THOMAS, ALEXANDER DAVID. Modeling Multiple Effect Evaporation in Conjuncture with Small Modular Nuclear Reactors to Generate Power, Fresh Water, and Chilled Water. (Under the direction of Dr. Stephen Terry and Joseph Doster).
The Water-Energy Nexus (WEN) that surrounds power generation and freshwater supplies around the world needs to be considered heavily as the world population continues to rise. Water stressed areas (places with less than 2,000 m3 per person annually) across the globe already struggle to generate fresh water to meet the needs of the population. The increasing population will continue to place stress on water resources; there are already 16,000 desalination plants in the world that generate 19.8 billion gallons of water per day. One potential solution to the strain placed on the WEN is utilizing Small Modular Reactors (SMRs) in areas of shallow watersheds in order to help desalinate brackish groundwater. This study investigates the potential for using SMRs paired with a multiple effect evaporator train in order to generate electricity, freshwater, and chilled water.
Previous studies have shown that reverse osmosis (RO) produces the most amount of freshwater per unit input power, so utilizing RO would be an important part of any desalination system. Other aspects that were added to the study were utilizing an absorption chiller and stratified chilled water tank to help offset cooling loads, similar to the system suggested by Frick et al. Peak production of renewable sources like solar occurs when daily electric demands are low, but as the solar production wanes, the electric demand increases, creating the need for other sources to increase electricity production at rapid rates. This creates thermal strain on sources like nuclear power, and negatively affects the overall lifecycle of those plants. This phenomenon, known as the “Duck Curve,” is becoming a more significant issue as renewable sources increase grid
Generate Power, Fresh Water, and Chilled Water
by
Alexander David Thomas
A thesis submitted to the Graduate Faculty of North Carolina State University
in partial fulfillment of the requirements for the degree of
Master of Science
Mechanical Engineering
Raleigh, North Carolina 2019
APPROVED BY:
_______________________________ _______________________________ Dr. Stephen D. Terry Dr. J. Michael Doster
Committee Chair
ii DEDICATION
iii BIOGRAPHY
Alexander Thomas was born in Charlotte, North Carolina in late 1994. He is the middle of three children. He attended elementary, middle, and high school in the Matthews area of North Carolina. From a young age, he was interested in building, creative thinking, and mathematics. For almost his entire life, people have told him that he thought like an engineer. Alex discovered in high school that math and science were, by far, his most adept subjects, and decided that taking engineering-based electives would help him prepare for the coursework he would face in college. Alex selected North Carolina State University as his undergraduate degree because of the proximity to home and the level of education he would acquire there.
At NC State, Alex initially thought that Chemical Engineering would be the right fit; however, freshman chemistry quickly changed that. Alex selected Mechanical Engineering as his major due to his love of physics. It was definitely the best decision of his undergraduate career. Alex enjoyed the critical thinking aspects and how he could apply the knowledge he obtained from classes to the world surrounding him. After four years filled with hard work, he graduated Magna Cum Laude in May of 2017.
iv ACKNOWLEDGMENTS
I would like to acknowledge Elizabeth Worsham for all of her help with this project. She helped with many things such as the curve fit approximation for the heat capacity of saltwater as a function of both salinity and temperature. It reduced a potential source for error in the model and I sincerely appreciate her work with it. She also helped with ideas behind the diurnal curve load following operational method. She mentioned that water usage changes throughout the day, in a similar manner to electricity, and that load following in accordance with that water demand would make an interesting study.
I would like to acknowledge Kalene Hanson for reading and editing all of my work to make sure that the material was presented in a coherent and professional manner. Her support on this project meant the world to me, and it would not have come to fruition without her.
v TABLE OF CONTENTS
LIST OF TABLES ... viii
LIST OF FIGURES ... ix
Chapter 1: Background Information ... 1
1.1. Rising Need of Energy ... 1
1.2. Nuclear Energy and the SMR ... 1
1.3. Co-Dependence of Water and Energy ... 5
1.4. Target Areas ... 7
1.5. Proposed System ... 11
Chapter 2: Literature Review ... 14
2.1. NuScale Small Modular Reactor for Co-generation of Electricity and Water ... 14
2.2. Cogeneration: An Option to Facilitate Load Following in Small Modular Reactors... 15
2.3. Thermal Energy Storage Configurations for Small Modular Reactor Load Shedding ... 17
2.4. Dynamic Performance Analysis of a High-Temperature Steam Electrolysis Plant Integrated within Nuclear-Renewable Hybrid Energy Systems ... 21
2.5. Small Modular Reactors: A Comprehensive Overview of their Economics and Strategic Aspects ... 25
Chapter 3: Heat Exchanger Theory ... 30
3.1. Heat Exchanger History ... 30
3.2. The Overall Heat Transfer Coefficient ... 31
vi
3.4. The Effectiveness-NTU Method ... 39
3.5. Multiple Effect Evaporator Theory ... 42
Chapter 4: Fortran Model Methodology ... 47
4.1. Governing Equations ... 47
4.2. Thermodynamic Property Evaluation ... 49
4.2.1. Enthalpy of Saturated Liquid Water ... 49
4.2.2. Enthalpy of Saturated Vapor Water ... 52
4.2.3. Isentropic Enthalpy ... 54
4.2.4. Saturation Pressure and Temperature ... 56
4.2.5. Specific Heat of Saltwater ... 58
4.3. Iterative Nature of the Code ... 61
4.3.1. Newton’s Method... 61
4.5. Heat Exchanger Considerations ... 63
Chapter 5: Results of Studies ... 64
5.1. Studies Conducted ... 64
5.2. Pressure-Based Study... 64
5.3. Ratio-Based Study ... 70
5.4. Saltwater Inlet Temperature Study ... 80
5.5. Summary ... 88
Chapter 6: Conclusions and Future Work ... 90
6.1. Potential System Setups ... 90
6.2. Day-Night Loading ... 91
viii LIST OF TABLES
Table 1. LMTD Temperatures ... 38
Table 2. Antoine Equation Constants for Water [17] ... 57
Table 3. Specific Heat Capacity Function Coefficients and Values ... 59
Table 4. Model Input Parameters ... 64
Table 5. Model Input Values for Pressure Study ... 65
Table 6. Model Input Values for Ratio Study ... 71
Table 7. Maximum Ratio for Examined Effect 6 Pressures ... 75
Table 8. Model Input Values for Temperature Difference Study ... 80
ix LIST OF FIGURES
Figure 1. Standard NuScale Reactor Module [2] ... 3
Figure 2. Department of Energy and Idaho National Labs Nuclear-Hybrid Roadmap [3] ... 5
Figure 3. Map of Saline Groundwater [5] ... 7
Figure 4. Four Corners States Population, 2007-2016 ... 8
Figure 5. Total Electric Sales for the Four Corners States ... 9
Figure 6. Summer and Winter Demand Profiles ... 10
Figure 7. Full Proposed System ... 13
Figure 8. Relationship between Electric and Water Output [4] ... 15
Figure 9. Duck Curve Depiction [12] ... 22
Figure 10. Nuclear-Renewable HES Flowchart [3] ... 23
Figure 11. Counter-flow Shell and Tube Heat Exchanger Diagram ... 31
Figure 12. Differential Tube Element ... 32
Figure 13. Equivalent Thermal Circuit ... 33
Figure 14. Differential Fluid Element ... 35
Figure 15. Multiple Effect Evaporator Diagram ... 42
Figure 16. Single Effect Diagram ... 43
Figure 17. Solubility of NaCl in Water vs. Temperature ... 46
Figure 18. Saturated Liquid Enthalpy vs. Pressure (15 psia to 3,000 psia) ... 51
Figure 19. Saturated Liquid Enthalpy vs. Pressure (0 to 50 psia) ... 52
Figure 20. Enthalpy of Saturated Vapor Water vs. Pressure ... 54
Figure 21. Isentropic Enthalpy vs. Pressure ... 56
x
Figure 23. Newton's Method Graphical Representation [19] ... 62
Figure 24. Limitations of Newton's Method [19] ... 63
Figure 25. Required Supply Pressure vs. Effect 6 Pressure ... 66
Figure 26. Chilled Water Production vs. Effect 6 Pressure ... 67
Figure 27. Freshwater Generation vs. Effect 6 Pressure ... 68
Figure 28. Annual Revenue vs. Effect 6 Pressure ... 69
Figure 29. Required Supply Pressure vs. Ratio ... 72
Figure 30. Required Supply Pressure vs. Ratio within Limits ... 73
Figure 31. Supply Pressure vs. Ratio and Effect 6 Pressure ... 74
Figure 32. Chilled Water Production vs. Ratio ... 76
Figure 33. Freshwater Generation vs. Ratio ... 77
Figure 34. Annual Revenue vs. Ratio ... 78
Figure 35. Annual Revenue at Low Pressure vs. Ratio ... 79
Figure 36. Required Supply Pressure vs. Temperature Difference ... 81
Figure 37. Vapor Flow Rate out of Effect 6 vs. Temperature Difference ... 82
Figure 38. Chilling Capacity vs. Temperature Difference ... 83
Figure 39. Multiple Effect Evaporator Water Generation vs. Temperature Difference ... 84
Figure 40. Reverse Osmosis Water Generation vs. Temperature Difference ... 85
Figure 41. Total Water Generation vs. Temperature Difference ... 86
Figure 42. Annual Revenue vs. Temperature Difference ... 87
Figure 43. Annual Revenue vs. Temperature Difference (Enhanced) ... 88
Figure 44. Percentage Based Diurnal Curve ... 93
xi
Figure 46. Scaled Demand Profile ... 95
Figure 47. Steam Flow Rate through MEE System ... 96
Figure 48. Summer RO Water Production ... 97
Figure 49. Winter RO Water Production ... 98
Figure 50. Summer MEE Water Production ... 99
Figure 51. Winter MEE Water Production ... 100
Figure 52. Summer Chilled Water Production ... 101
Figure 53. Winter Chilled Water Production ... 102
1 CHAPTER 1: Background Information
1.1. Rising Need of Energy
Energy production is an essential factor in furthering economic development. Industrialized countries use more energy than developing and pre-industrial countries on both per capita and per unit economic output basis [1]. Energy consumption per unit economic output declines towards the advanced stages of industrialization, due to the increased importance of energy efficiency to keep costs lower than the competition. Despite this decrease is energy consumption per unit economic output, energy use per capita increases in the advanced stages of industrialization. As more countries become industrialized the need for energy will only increase [1].
There are three categories of energy production methods available today: fossil fuels, renewables, and nuclear energy. Fossil fuels are carbon-based fuels (i.e. oil, coal, natural gas, etc.). Renewables are energy sources that do not deplete during the process (i.e. hydroelectric, solar, wind, etc.), while nuclear energy is defined by its use of nuclear fission to produce energy [1].
1.2. Nuclear Energy and the SMR
While nuclear energy is capable of load-following, it is primarily used to generate electricity at a base load because base loading helps the core avoid thermal cycling, which can damage the mechanical fasteners and piping. Nuclear energy is the only carbon-free energy source that can reliably contribute to energy production on a large scale. Roughly 11% of the world energy production in 2015 and 2016 came from nuclear energy. In 2016, there were 447 operating nuclear plants in 31 countries for a total capacity of 389,051 MWe (Megawatts of electricity) [1].
2 less per unit. SMRs do not require the massive amount of initial capital that is required by large scale reactors, so the SMRs are more economically competitive with natural gas and other power generation methods. The characteristic benefit of SMRs is that they are able to be pre-constructed in “modules” which expedite construction and reduce the initial capital requirement tremendously.
Essentially, SMRs become standardized nuclear reactors for the world [1]. Standardization of the nuclear reactor would help reduce the amount of time spent in the permitting process with the Nuclear Regulatory Commission and allow them to be mass produced.
After the Fukushima incident in Japan, SMR designs have incorporated major safety improvements. First, SMRs can be deployed underground yielding better containment of radiation and a higher resistance to terrorist threats. The designs reduce the need for emergency generators by depending entirely upon battery power to sustain safety operations. Additionally, the designs surround the containment and reactor vessels with a pool of underground water to dampen the effects of seismic activity. Lastly, the designs have a large underground storage area for the spent fuel to reduce the possibility of uncovering the spent fuel [1].
SMRs offer a flexibility not offered by conventional reactors. Historically, nuclear reactors are placed near bodies of water for cooling, but there are a variety of SMR designs that are cooled by a gas or a molten salt, which allows them to be located in areas away from bodies of water. It follows that SMRs can then be placed in areas that were previously inaccessible to nuclear power, such as desert regions [1]. It is important to note that there must still be some form of heat sink for the SMRs. In the desert region, for example, the atmosphere could be used.
3 prefabricated and then transported to the construction site, which can reduce the construction period by roughly 36 months. The entire system is able to be shipped by rail reducing construction time. The independent modular design allows for each module to be refueled while the others continue to operate. The NuScale is a standard pressurized water reactor (PWR) using roughly 5% enriched Uranium fuel rods [1]. Figure 1 shows a model of a standard NuScale reactor module.
Figure 1. Standard NuScale Reactor Module [2]
5 Figure 2. Department of Energy and Idaho National Labs Nuclear-Hybrid Roadmap [3]
1.3. Co-Dependence of Water and Energy
6 One of the promising fresh water generation options is desalination of either sea water or brackish groundwater. Desalination of sea water is the most common option in place today, as it constitutes roughly 60% of the desalination market [4]. However, there are some areas in the world that are landlocked and have little access to clean ground water, making desalination of brackish groundwater their primary option. There are approximately 16,000 desalination plants in the world, and they produce an estimated 19.8 billion gallons of fresh water per day [4]. The growth of desalination plants is expected to continue to increase due to industrialization and urbanization of developing countries [4]. As more of the world becomes industrialized, the worldwide demand for electricity will increase. Thus, the amount of water used to cool thermoelectric power plants will increase, which drives up the need for water. As nations become more industrialized, more of the population will congregate in cities, which will create areas with highly concentrated needs for electricity and fresh water.
7 electricity or heat produced directly by a nuclear power plant; however, all United States nuclear powered military vessels use their nuclear power to desalinate water regularly [4].
1.4. Target Areas
The NuScale SMR can be placed almost anywhere, where supplemental electrical generation is needed. However, an SMR coupled with desalination technology should target areas that have access to some form of saltwater, either brackish groundwater or sea water, and need electrical generation. The area considered for this project is the four corners region of the United States, which is made up of Arizona, New Mexico, Utah, and Colorado. According to the U.S. Geological Survey, the depth to saline ground water in this region is less than 500 ft. on average [5]. New Mexico, in particular, has a large area with a saline water depth of less than 500 ft. Figure 3 shows a map from the U.S. Geological Survey National Brackish Groundwater Assessment.
8 Essentially, any well populated area that has access to shallow, brackish groundwater would benefit from an SMR-MEE combination to provide co-generation of electricity and water. The four corners states have had a steadily increasing population in the past ten years. According to the U.S. Energy Information Administration, the total population of the subject states increased by roughly two million people from 2007 to 2016 [6]. Figure 4 tracks the population of each of the states as well as the total.
Figure 4. Four Corners States Population, 2007-2016
9 Figure 5. Total Electric Sales for the Four Corners States
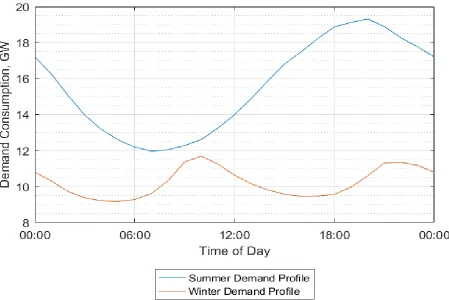
10 Figure 6. Summer and Winter Demand Profiles
It can be seen that the summer profile follows the work day somewhat closely. Around 7:00 am, the demand is at a daily low, but as people start to wake up, they will turn appliances on and start to consume electricity. The demand continues to climb during the day as it gets hotter and more people use air conditioning. Finally, the demand peaks around 7:00 pm at night as people start to turn appliances off before going to sleep. This profile is standard throughout the United States for summer time.
11 return home after the work day and begin to use appliances. Beyond that, the outside temperature falls, and people turn on their heating systems again.
This region is a prime target for the NuScale SMR because the patterns are so cyclical. The system can produce electricity during the on-peak hours, and produce fresh water during the off-peak hours.
1.5. Proposed System
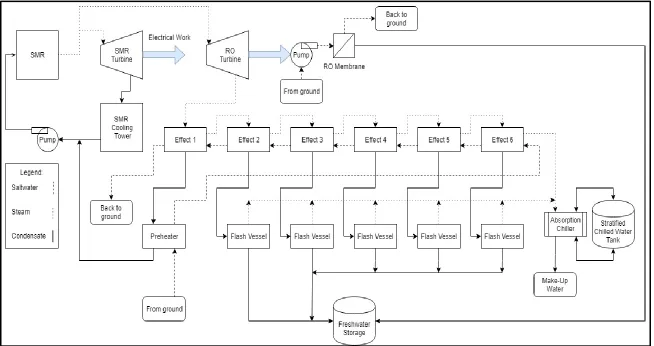
In order to analyze the potential for the co-generation of freshwater and electricity using SMRs, the system details must be determined. Initially, the system consisted of a multiple effect evaporator having six counter-flow effects for desalination. The steam would come from the main steam line of the SMR, condense in the first effect, and then go to a groundwater preheater before being sent back to the secondary loop on the SMR. Each subsequent effect would be at a lower pressure and temperature in order to ensure heat transfer. The ground water would progressively increase in salt concentration as water gets boiled off. The steam generated in the first effect would be condensed and then sent to a freshwater tank for storage. Eventually, the steam produced in every effect would be condensed and then sent to the same storage tank. Thus, the system would produce a certain amount of freshwater for a given amount of steam input and co-generate steam and electricity.
12 could be sent to the absorption chiller as well. And lastly, the condensate from the flash vessel would be sent to a freshwater storage tank for consumption.
The final addition to the system was a turbine to produce electricity and lower the pressure of the steam from the main steam line to the operating pressure of the first effect. The electricity produced by this turbine is devoted entirely to running a reverse osmosis pump to supplement the freshwater production of the overall system.
13 Figure 7. Full Proposed System
14 CHAPTER 2: Literature Review
The compatibility of small modular reactors and desalination technology has been studied since the debut of the small modular reactor, or SMR. While the primary focus of SMR research has been into the economics and the technological feasibility of using them solely for electricity generation, there has been some research into using them for desalination purposes.
2.1. NuScale Small Modular Reactor for Co-generation of Electricity and Water (2014) Ingersoll, Houghton, Bromm, and Desportes discussed the potential for the NuScale SMR to produce electricity and freshwater using the three primary desalination technologies. They compared the amount of freshwater and electricity that can be produced between RO, MEE, and MEFD. They used steam from a low pressure turbine stage for MEFD and main line steam for MEE, both of which cause a decrease in the electrical output of the plant [4]. Therefore, no current desalination technique can be linked to an SMR without causing some reduction in electrical output. RO consumes electricity directly, while MEE and MEFD use steam that would otherwise produce electricity in the turbine.
Ingersoll et al. also use a heat exchanger to separate the evaporator trains from the secondary loop of the SMR so that a thermal compressor can be used to help re-pressurize the steam going to the lower pressure effects in order to produce more freshwater. The measure of effectiveness used in the paper is the gain to output ratio (GOR), which is the ratio of clean water produced (gain) to steam consumed by the system. Using a thermal compressor increased the GOR of the MEE model from 12 to 17 [4].
15 However, the reactor would only produce freshwater; no electricity would be sent to the grid while operating this way. It is also speculated in the paper that a hybrid plant utilizing RO and MEE or MEFD could be used to maximize freshwater generation. However, a detailed investigation was not performed.
Finally, the results of each system were analyzed. Figure 8 shows the relationship between the electric and water output of each system examined by Ingersoll et al. The RO system produces the most freshwater at all electrical output levels. It is important to note that Ingersoll et al. label multiple effect flash distillation (MEFD) as multiple stage flash distillation (MSF) and multiple effect evaporation (MEE) as multiple effect distillation (MED).
Figure 8. Relationship between Electric and Water Output [4].
16 is not a surplus of electricity to the grid [8]. Due to the fact that renewable power plants are only available intermittently, other power plants have to reduce their power to avoid that surplus. The current control method for load following is using control rods to limit reactivity and lower the power in pressurized water reactors (PWRs), and changing coolant flow rates or using control blades to limit reactivity and lower the power in boiling water reactors (BWRs). Using these control schemes can introduce thermomechanical stresses on the fuel and core components as well as cause thermal cycling, which reduces their lifetime. This operating method presents a serious loss of revenue without a reduction in operating costs [8].
Locatelli et al. discuss the potential for using various cogeneration techniques to change the method of load following including desalination and district heating. The authors discuss the proven reliability of all three desalination techniques mentioned previously, and that coupling any desalination technique to a nuclear reactor is a “consolidated practice [8].” Locatelli et al. conclude that desalination can be an economically viable method to facilitate load following depending on the price of freshwater.
The authors also discuss the potential for using district heating as a means to help load following operation in reactors. The premise is that during the colder months of the year, steam is used to heat local buildings instead of being sent through the turbine to make electricity. One of the limitations of district heating are that the steam is usually in the temperature range of 175℉ to 300℉, so the reactor would have to be relatively close to the buildings using the district heating.
17 heating [8]. However, the authors did not consider using an absorption chiller to generate chilled water for air conditioning purposes in the summer, also called trigeneration.
2.3. Thermal Energy Storage Configurations for Small Modular Reactor Load Shedding Frick, Misenheimer, Doster, Terry, and Bragg-Sitton present two different methods for using Thermal Energy Storage (TES) as a means for SMRs to shed load when the need for nuclear electrical generation decreases. With concerns of climate change, the fossil fuel powered electric generation has become less sought-after; renewable sources, such as wind and solar, are becoming more desirable options for electrical generation as attributable to their smaller carbon footprint and decreasing costs [9]. There are, however, a few problems with these renewable sources; specifically, Frick et al. mention their intermittency. “Solar photovoltaic cannot produce electricity
at night and experiences plant capacity reductions during times of cloud cover, while wind farms are reliant on fluctuating airstreams [9].” According to the Department of Energy (DOE), in 2016 alone, the capacity of solar photovoltaic (PV) generation grew to 40,606 MW, while wind capacity grew to 82,143 MW [10]. Wind and solar PV will likely continue to increase in capacity because they are able to be installed in a wider variety of locations, compared to other renewable options like hydroelectric and geothermal sources. Frick et al. present their TES systems as a means to keep the SMR under steady state operation while being subjected to changing electric demand.
Frick et al. present a two-tiered TES system. The first tier is a Therminol®-66 storage system, and the second is a bank of absorption chillers connected to a stratified chilled water tank. The sensible heat system consists of two tanks for storing Therminol®-66. One is considered the “cold tank” and the other is the “hot tank.” When thermal storage is needed, the oil is pumped
18 and then back to the “cold tank” [9]. For the Therminol®-66 TES, it is best to have constant steam
conditions to maintain proper and consistent heat transfer because the pressure of the inlet steam and the exit temperature of the Therminol®-66 are directly related to one another [9]. Saturation temperature is based on the pressure of the inlet steam; lower inlet pressures result in lower saturation temperatures which decreases the temperature difference across the heat exchanger and thus decreases the overall amount of heat transfer. This concept of heat exchanger effectiveness was discussed in the previous chapter. The exit temperature of the Therminol®-66 is essentially the temperature of fluid stored in the sensible heat storage system. Frick et al. discuss that this particular oil was chosen because of its stability over a wide temperature range that encompasses the expected operating range of 203℃-260℃ (397℉-500℉) and also mention that
Therminol®-68 or Therminol®-75 could have used instead [9]. Consistent thermal properties are important in heat exchangers because the convective heat transfer coefficient of the thermal storage fluid is determined using the fluid’s Reynolds Number and Prandtl Number. Both of these properties are non-dimensional numbers determined by thermal properties such as viscosity, heat capacity, and thermal conductivity, all of which are functions of temperature for real fluids. The 66 is pumped at a rate that allows the heat exchanger to raise the temperature of the Therminol®-66 to some designated setpoint [9]. Assuming that there is no superheat, the mass flow of the Therminol®-66 can be approximated using a First Law of Thermodynamics analysis.
𝑄𝑠𝑡𝑒𝑎𝑚= 𝑄𝑇ℎ𝑒𝑟𝑚𝑖𝑛𝑜𝑙®−66 (2.1)
𝑚̇ ∆ℎ𝑠 𝑓𝑔,𝑠 = 𝑚̇ 𝑐𝑇 𝑝,𝑇(𝑇𝑠𝑒𝑡𝑝𝑜𝑖𝑛𝑡− 𝑇𝑐𝑜𝑙𝑑) (2.2)
𝑚̇ =𝑇
𝑚̇ ∆ℎ𝑠 𝑓𝑔,𝑠 𝑐𝑝,𝑇(𝑇𝑠𝑒𝑡𝑝𝑜𝑖𝑛𝑡− 𝑇𝑐𝑜𝑙𝑑)
19 The mass flow rate of Therminol®-66 is equal to the product of the steam flow rate and the enthalpy of condensation of steam at the saturation temperature divided by the heat capacity and the prescribed temperature change of the Therminol®-66. As the temperature setpoint increases, the amount of Therminol®-66 flow decreases. This creates a balancing act in which too high of a setpoint results in too little flow, while too low of a setpoint would cause the thermal storage system to be less useful. Frick et al. set an upper limit to the amount of steam flow (~45%) that the sensible heat storage system is able to handle [9]. This upper limit helps set the amount of time it takes to charge a tank of a given size and the total amount of thermal storage available to offset renewable penetration to the electric grid.
20 also be removed from the tank at the same time. This indicates that a fully charged tank would be filled with chilled water, and a fully discharged tank would be filled with warm water. Frick et al. examine using lithium-bromide absorption chillers as the source of chilled water because absorption chillers are capable of using waste heat to provide a chilling effect. Standard chillers use an electric-powered vapor compression cycle to provide the chilling effect [9]. It was determined that using steam from the low-pressure turbine of the SMR to run the absorption chiller was not optimal as absorption chillers are “highly dependent on flow rate and temperatures
21 2.4. Dynamic Performance Analysis of a High-Temperature Steam Electrolysis Plant Integrated within Nuclear-Renewable Hybrid Energy Systems
22 Figure 9. Duck Curve Depiction [12].
“During off-peak periods when electricity demand is low and/or excess renewable power
is available, these low-marginal cost generators often sell surplus electricity to the grid at low or negative prices in order to avoid shutdown and startup costs if they are not able to curtail power generation when requested by the electric grid operator [11].” Creating electricity and then selling it at negative prices is unsustainable. The more often the intermittencies occur, the more impact the price points have on the lifecycle costs of baseload generators. Balancing irregular renewable sources with other electrical generation sources produces market inefficiencies, mediocre use of electrical generation equipment, which increases costs and the likelihood of ineffective regulation.
Kim et al. define a hybrid energy system (HES) as “a single facility that integrates multiple
23 of reduced demand or increased renewable penetration which allows the nuclear reactor core to maintain baseload status that maximizes the economic potential while also sending low-carbon electricity to the grid [11]. Figure 10 below shows the traditional flowchart for an SMR Nuclear-Renewable HES.
Figure 10. Nuclear-Renewable HES Flowchart [3]
This approach utilizes initial costs more effectively by producing grid-scale electricity as well as a variety of other products, such as hydrogen gas, fresh water, or biofuels [11]. Kim et al. look at using an HTSE as a “flexible load resource” (FLR) in order to maintain the nuclear core at
24 three difference power cycles where an HTSE process was combined with a sodium cooled, fast spectrum reactor. The three power cycles considered were a subcritical system, a supercritical Rankine cycle, and a supercritical carbon dioxide Brayton cycle. It is mentioned that the limitations of that study are primarily that only steady-state analyses were conducted and that it did not evaluate the flexibility of using HTSE with regards to renewable penetration as an HES [11]. Kim et al. consider the NuScale SMR in their study because it “is considered to be the most mature and
has the lower technical risk [11].” The NuScale SMR acts as the steam generator for both the power conversion cycle as well as the HTSE system. The power conversion cycle and renewable energy sources provide electricity to the grid and to the HTSE system. The renewable energy source is introduced to the electric gird via a battery in order to reduce the variability associated with renewable energy sources [11].
The results from Kim et al.’s study show that their control methods maintain the controlled
25 2.5. Small Modular Reactors: A Comprehensive Overview of their Economics and Strategic Aspects
Locatelli, Bingham, and Mancini explore the economics of SMRs in order to provide insight into how they might play into the future needs for energy [13]. They mention that the world energy consumption will more than double from 1995 to 2035. For nuclear reactors, this means a large increase in the generation of electricity. Many reactors will be nearing the end of their lives, which means that the market could expand significantly [13]. There are numerous “new-comer” countries that are now considering nuclear reactors as a source because they create zero carbon-based emissions. The governments in these countries have certain requirements in order to develop a nuclear infrastructure. These requirements are: (1) a fitting environment of investment, (2) regulatory policies on the end-of-life aspects of reactors, namely decommissioning and waste management, (3) participation in international nuclear non-proliferation measures, and (4) third-party damage insurance [13]. These four requirements ensure international safety for both citizens and investing companies.
26 is less than the rate of increase of the electrical power produced, so the specific costs are lower. Due to the economy of scale, nuclear reactors have increased in power from a few hundred Megawatts to over 1,500 Megawatts in capacity [13]. Locatelli et al. go on to say that “the economies of scale only apply if and only if the comparison is 1 Large vs. 1 Small and the reactors are of similar design.” This is an important assumption when discussing the economy of scale of
nuclear reactors.
27 The nuclear industry uses four different costs to estimate the total life-cycle costs of a nuclear power plant (NPP). These four different costs are: initial costs, yearly operating costs, fuel costs, and decommissioning costs. The two measures of profitability that are used to assess NPP economics are the net present value (NPV) and internal rate of return (IRR). The NPV of a project measures the absolute profitability. It is heavily dependent on the discount rate, or the weighting of present cost to future revenue. The discount value is similar to the weighted average cost of capital (WACC), so it is used in place of the discount value sometimes. A low WACC favors capital intensive projects, while a high WACC favors low capital intensive projects. The IRR reflects the interest rate at which it is neutrally beneficial to invest in the project or a theoretical investment with that interest rate. Higher IRRs are typically favored for projects.
28 subsequent reactors can be purchased through the profits of the first investment [13]. The new design strategy is the integral model, which allows simplification of the reactor plant itself and reduces the number of required safety systems [13].
Another economic issue that reactors face is the construction schedule that affects costs drastically. There are fixed daily costs associated with all of the workers and equipment, and longer construction periods delays revenue generated by the plant. While the plant is not producing revenue, it can be accruing interest on debts. According to Locatelli et al., some claim that the life of the reactor is the same regardless of the construction schedule so the schedule should not be an economic factor. Locatelli et al. dispute this and say that the income at the end of the life of the reactor is negligible when converted into the present, thus “each year of delay the revenue has to
be considered as lost [13].” Modularization of the SMR can potentially cut down the production time and reduce that amount of lost revenue by reducing the on-site construction schedule.
Locatelli et al. reference the Energy Policy Institute and their investigation into three possible co-generation options: desalination, hydrogen production, and process heat for industrial uses and district heating. SMRs can be placed closer to the consumers so the losses associated with distribution of freshwater or district heat can be diminished [13]. Locatelli et al. believe that SMRs “should not be considered an alternative to [large reactors], but a solution for niche markets that are normally not suitable for [large reactors].” These niche markets are when power requirement
29 safer and require less prior knowledge than large reactors. The SMR is also capable of replacing power plants that have been decommissioned. The scenario in which SMRs are economically viable in these areas is when there is a high carbon-tax or strict environmental legislation, which caused the plant to be decommissioned in the first place.
30 CHAPTER 3: Heat Exchanger Theory
3.1. Heat Exchanger History
Heat exchangers have existed as a means to move heat from one medium to another for centuries. One of the earliest heat exchangers was a simple rock, placed in a fire, and then moved to a hut. The stone would absorb the heat in the fire, and then slowly release it into the house without the risk of burning it down [14]. Romans used a more refined version of household heating called the “hypocaust.” They would dig basements below the main floor with air spaces in the
flooring for smoke and hot air to flow through and let heat travel upward through the floor without having an open fire in the house. The Romans also used hypocausts to heat public baths [14].
31 Figure 11. Counter-flow Shell and Tube Heat Exchanger Diagram
3.2. The Overall Heat Transfer Coefficient
The analysis of a heat exchanger first begins with the examination of the overall heat transfer coefficient. It is a critical property of heat exchangers that is often unknown. The overall heat transfer coefficient, U, is a combination of conduction and convection terms. The most general heat transfer equation can be seen by Equation 3.1 below.
𝑄 = 𝑈𝐴∆𝑇 (3.1)
32 Figure 12. Differential Tube Element
Examining the tube element, it can be seen that there are three primary modes of heat transfer. In this example, the shell side fluid is heating up the tube side fluid. Initially, heat is transferred via convection from the shell side fluid to the outer surface of the tube. Then heat is transferred via conduction the outer surface of the tube to the inner surface of the tube, then heat is transferred from the inner surface to the tube side fluid by convection. This heat transfer could be broken down into a thermal circuit to determine the overall heat transfer coefficient. The thermal circuit is shown in Figure 13.
The analysis of a thermal circuit is similar to that of an electrical circuit. Consider Ohm’s Law for electrical circuits: “The voltage drop across a resistive element is equal to the product of the current through the resistive element and its resistance.” A similar statement can be made of thermal circuits: “The temperature drop through a medium is equal to the product of the heat
33 Figure 13. Equivalent Thermal Circuit
𝑉 = 𝐼 × 𝑅 (3.2)
∆𝑇 = 𝑄 × 𝑅𝑡ℎ𝑒𝑟𝑚𝑎𝑙 (3.3)
Solving Equation 3.3 for the heat transfer, Q, results in Equation 3.4. Then, Equation 3.1 can be substituted into Equation 3.4 to result in Equation 3.5.
𝑄 = ∆𝑇
𝑅𝑡ℎ𝑒𝑟𝑚𝑎𝑙
(3.4)
∆𝑇
𝑅𝑡ℎ𝑒𝑟𝑚𝑎𝑙 = 𝑈𝐴∆𝑇 (3.5)
34
𝑅𝑡ℎ𝑒𝑟𝑚𝑎𝑙 = 1
𝑈𝐴 (3.6)
The thermal resistance is additive in series, like an electrical resistance. Therefore, the total thermal resistance is the sum of all individual thermal resistances. Equations 3.7 and 3.8a show the total sum of the thermal resistances of the heat exchanger.
𝑅𝑡𝑜𝑡𝑎𝑙 = 𝑅𝑐𝑜𝑛𝑣𝑒𝑐𝑡𝑖𝑜𝑛,𝑠ℎ𝑒𝑙𝑙+ 𝑅𝑐𝑜𝑛𝑑𝑢𝑐𝑡𝑖𝑜𝑛,𝑡𝑢𝑏𝑒+ 𝑅𝑐𝑜𝑛𝑣𝑒𝑐𝑡𝑖𝑜𝑛,𝑡𝑢𝑏𝑒 (3.7)
1 𝑈𝐴=
1
ℎ𝑠ℎ𝑒𝑙𝑙𝐴𝑜𝑢𝑡𝑒𝑟+
ln (𝐷𝐷𝑜
𝑖)
2𝜋𝑘𝑡𝑢𝑏𝑒𝐿𝑡𝑢𝑏𝑒+
1 ℎ𝑡𝑢𝑏𝑒𝐴𝑖𝑛𝑛𝑒𝑟
(3.8a)
The shell and tube heat exchanger is a radial heat transfer system, meaning that the area of heat transfer through the tube is not constant because the tube has some thickness associated with it. Some heat exchangers have a constant area, which would change Equation 3.8a to 3.8b, below.
1 𝑈 = 1 ℎ𝑠ℎ𝑒𝑙𝑙+ 𝑡𝑤𝑎𝑙𝑙 𝑘𝑤𝑎𝑙𝑙+ 1
ℎ𝑡𝑢𝑏𝑒 (3.8b)
It is important to note that Equations 3.8a and 3.8b are only valid for clean, fin-less, flat plate heat exchangers in cartesian coordinates. Fins can increase overall heat transfer coefficients and fouling can decrease the overall heat transfer area. Fouling is the buildup of a film on both the inner and outer surfaces of the tubes. It is caused by impurities in the fluids, rust, or biologicals, like algae. As fouling is increased, the overall heat transfer coefficient decreases because the fouled surfaces increase thermal resistance. The addition of the fouling terms into Equation 3.8a and the converting for cartesian coordinates to account for round tubes results in Equation 3.9.
1 𝑈𝐴= 1 ℎ𝑠ℎ𝑒𝑙𝑙𝐴𝑜𝑢𝑡𝑒𝑟 + 𝑅𝑓,𝑜𝑢𝑡𝑒𝑟′′ 𝐴𝑜𝑢𝑡𝑒𝑟 +
ln (𝐷𝐷𝑜
𝑖)
2𝜋𝑘𝑡𝑢𝑏𝑒𝐿𝑡𝑢𝑏𝑒+
𝑅𝑓,𝑖𝑛𝑛𝑒𝑟′′ 𝐴𝑖𝑛𝑛𝑒𝑟 +
1 ℎ𝑡𝑢𝑏𝑒𝐴𝑖𝑛𝑛𝑒𝑟
(3.9)
35 Fundamentals of Heat and Mass Transfer by Incropera and Dewitt [15]. In general, liquid to liquid heat exchangers have higher U-values than liquid to gas or gas to gas heat exchangers because liquids have higher densities allowing for better convection coefficients. Additionally, phase changes heat exchangers have the highest U-values due to the exceptionally high convection coefficients associated with phase changes.
3.3. The Log Mean Temperature Difference Method
An important consideration when using Equation 3.1 is the temperature difference used in the calculation because the temperature difference changes as a function of location in the heat exchanger. In a parallel flow heat exchanger, the temperature difference at the inlet is much greater than the temperature difference at the exit. In order to determine an accurate temperature difference over the entire heat exchanger, a different fluid element needs to be examined. Figure 14 shows a diagram of the differential fluid element.
Figure 14. Differential Fluid Element The first step is to apply an energy balance to each fluid element.
𝑑𝑞 = −𝑚̇ℎ𝑐𝑝,ℎ𝑑𝑇ℎ (3.10a)
𝑑𝑞 = 𝑚̇ 𝑐𝑐 𝑝,𝑐𝑑𝑇𝑐 (3.10b)
36
𝑑𝑞 = 𝑈∆𝑇𝑥𝑑𝐴 (3.11)
Where ΔTx is the local temperature difference. The differential difference can be defined
as:
𝑑(∆𝑇𝑥) = 𝑑𝑇ℎ− 𝑑𝑇𝑐 (3.12)
Substituting Equations 3.10a and 3.10b into Equation 3.12 results in:
𝑑(∆𝑇𝑥) = −𝑑𝑞 ( 1 𝑚̇ℎ𝑐𝑝,ℎ+
1
𝑚̇ 𝑐𝑐 𝑝,𝑐) (3.13)
Next, Equation 3.11 is substituted into Equation 3.13 and integrated from the inlet to the exit. ∫ 𝑑(∆𝑇𝑥) ∆𝑇𝑥 = −𝑈 2 1 ( 1 𝑚̇ℎ𝑐𝑝,ℎ + 1 𝑚̇ 𝑐𝑐 𝑝,𝑐 ) ∫ 𝑑𝐴 2 1 (3.14)
Integrating from the inlet, 1, to the exit, 2, yields the relationship:
ln (∆𝑇2
∆𝑇1) = −𝑈𝐴 ( 1 𝑚̇ℎ𝑐𝑝,ℎ+
1
𝑚̇ 𝑐𝑐 𝑝,𝑐) (3.15)
Using the definition of sensible heat transfer, Equation 3.15 becomes:
ln (∆𝑇2
∆𝑇1) = −𝑈𝐴 (
𝑇ℎ,1− 𝑇ℎ,2
𝑞 +
𝑇𝑐,2− 𝑇𝑐,1
𝑞 ) =
𝑈𝐴
𝑞 (𝑇ℎ,2− 𝑇𝑐,2+ 𝑇𝑐,1− 𝑇ℎ,1) (3.16)
Thus, the relationship can be defined by:
𝑞 = 𝑈𝐴 (∆𝑇2− ∆𝑇1 ln (∆𝑇∆𝑇2
1)
) (3.17a)
Where ΔT2 is the temperature difference at the exit, and ΔT1 is the temperature difference
at the inlet. The term in the parenthesis is known as the log mean temperature difference, or LMTD. Equation 3.17a is often written as:
37 For a counter-flow heat exchanger, ΔT1 is the temperature difference at one end of the heat exchanger, and ΔT2 is the temperature difference at the other end of the heat exchanger. As an
38 Table 1. LMTD Temperatures
Variable Temperature Value Cold Fluid, Inlet 40°F
Cold Fluid, Exit 60°F Hot Fluid, Inlet 100°F Hot Fluid, Exit 70°F
Recall Equation 3.17a:
𝑞 = 𝑈𝐴 (∆𝑇2− ∆𝑇1 ln (∆𝑇∆𝑇2
1)
) 3.17a
The term in the parenthesis is known as the log mean temperature difference. It will be calculated for both a parallel flow and counter-flow heat exchanger. For a parallel flow heat exchanger, ΔT1 is the difference of the inlet temperatures, and ΔT2 is the difference of the exit temperatures. In this case, ΔT1 = 60°F and ΔT2 = 10°F.
𝐿𝑀𝑇𝐷 = (10 − 60 ln (1060)
) = 29.7℉
Thus, the LMTD can be calculated to be 29.7°F. For a counter-flow heat exchanger, ΔT1 is the difference between the inlet of the cold fluid and the exit of the hot fluid, and ΔT2 is the difference between the exit of the cold fluid and the inlet of the hot fluid. For the counter-flow case, ΔT1 = 30°F and ΔT2 = 40°F.
𝐿𝑀𝑇𝐷 = (40 − 30 ln (4030)
39 The LMTD can be calculated to be roughly 34.8°F. It is very important to note that for any set of inlet and exit temperatures, the LMTD of a counter-flow heat exchanger will always be greater than that of a parallel flow heat exchanger.
3.4. The Effectiveness-NTU Method
There are some special cases for which using Equation 3.1 is not recommended. These cases are when one fluid has a much higher heat capacity rate. The heat capacity rates are defined as:
𝐶ℎ ≡ 𝑚ℎ̇ 𝑐𝑝,ℎ and 𝐶𝑐 ≡ 𝑚̇ 𝑐𝑐 𝑝,𝑐, where the subscripts h and c represent the hot and cold fluids
respectively. If the heat capacity of one fluid is much greater that the other, then its temperature will not change by very much and can be approximated as constant, but the temperature of the other fluid will change. It is possible to have both condensing and evaporative heat exchangers; in these cases, the heat capacities of the phase change fluid approach infinity, meaning that the temperature remains constant through the process. Conversely, if the heat capacity rates of the two fluids are equal, then the magnitude of the temperature changes will be equal (i.e. if the temperature of the hot fluid decreases by ten degrees, then the temperature of the cold fluid will increase by ten degrees).
40 temperature of the cold fluid. The reverse is also true if Cc < Ch; the cold fluid would experience the greater temperature change and be heated such that its exit temperature would be equal to the inlet temperature of the hot fluid. Thus, the maximum heat transfer rate is depend on the smaller heat rate and the inlet temperatures of the two fluids. Equation 3.18 shows the relationship.
𝑄𝑚𝑎𝑥 = 𝐶𝑚𝑖𝑛(𝑇ℎ,𝑖𝑛− 𝑇𝑐,𝑖𝑛) (3.18)
With the definition of the maximum heat transfer in place, it is now possible to define the effectiveness of a heat exchanger, ε. The definition is given in Equation 3.19.
𝜀 ≡𝑄𝑎𝑐𝑡𝑢𝑎𝑙 𝑄𝑚𝑎𝑥 =
𝐶ℎ∆𝑇ℎ
𝐶𝑚𝑖𝑛(𝑇ℎ,𝑖𝑛− 𝑇𝑐,𝑖𝑛)=
𝐶𝑐∆𝑇𝑐
𝐶𝑚𝑖𝑛(𝑇ℎ,𝑖𝑛− 𝑇𝑐,𝑖𝑛) (3.19)
For any kind of heat exchanger, it can be said that the effectiveness can be calculated by some specific function of the number of transfer units (NTU) and Cr, which is the ratio of Cmin to Cmax. NTU is a dimensionless parameter used in heat exchanger calculations. It is defined as:
𝑁𝑇𝑈 ≡ 𝑈𝐴
𝐶𝑚𝑖𝑛
(3.20)
For heat exchangers that either evaporate or condense a fluid, the Cmax approaches infinity, which means that the Cr for a phase change is zero; therefore, the effectiveness is a function of NTU only.
41
𝜀 =(𝑇𝑐,𝑜𝑢𝑡− 𝑇𝑐,𝑖𝑛)
(𝑇ℎ,𝑖𝑛− 𝑇𝑐,𝑖𝑛) (3.21)
The next step is to return to Equation 3.15 and substitute the heat capacity rates into the Equation.
ln (∆𝑇2 ∆𝑇1
) = −𝑈𝐴 (1 𝐶ℎ
+ 1 𝐶𝑐
) (3.22)
Given that one of the heat capacities will always be Cmin and the other will be Cmax, Equation 3.22 can be written as:
ln (∆𝑇2
∆𝑇1) = −𝑈𝐴 ( 1 𝐶𝑚𝑖𝑛+
1
𝐶𝑚𝑎𝑥) (3.23)
Because Cmax is infinity in the case of a phase change, the reciprocal of the heat capacity is zero. Expanding the LMTD term and using the definition of NTU yields Equation 3.24.
ln (𝑇ℎ,𝑜𝑢𝑡− 𝑇𝑐,𝑜𝑢𝑡
𝑇ℎ,𝑖𝑛− 𝑇𝑐,𝑖𝑛 ) = −𝑁𝑇𝑈 (3.24)
Eliminating the natural log and doing some algebra results in the following.
𝑇ℎ,𝑖𝑛− 𝑇𝑐,𝑖𝑛 𝑇ℎ,𝑖𝑛− 𝑇𝑐,𝑖𝑛−
𝑇ℎ,𝑜𝑢𝑡− 𝑇𝑐,𝑜𝑢𝑡
𝑇ℎ,𝑖𝑛− 𝑇𝑐,𝑖𝑛 = 1 − 𝑒
−𝑁𝑇𝑈
(3.25)
Simplifying the left-hand side of the Equation results in Equation 3.26 and the final relationship between effectiveness and NTU for a phase change heat exchanger.
𝑇ℎ,𝑖𝑛− 𝑇𝑐,𝑖𝑛− 𝑇ℎ,𝑜𝑢𝑡+ 𝑇𝑐,𝑜𝑢𝑡 𝑇ℎ,𝑖𝑛− 𝑇𝑐,𝑖𝑛
= 𝑇ℎ,𝑖𝑛− 𝑇ℎ,𝑜𝑢𝑡 + 𝑇𝑐,𝑜𝑢𝑡− 𝑇𝑐,𝑖𝑛 𝑇ℎ,𝑖𝑛− 𝑇𝑐,𝑖𝑛
= 1 − 𝑒−𝑁𝑇𝑈 (3.26)
𝑇𝑐,𝑜𝑢𝑡− 𝑇𝑐,𝑖𝑛
𝑇ℎ,𝑖𝑛− 𝑇𝑐,𝑖𝑛 = 𝜀 = 1 − 𝑒
−𝑁𝑇𝑈 (3.27)
42 3.5. Multiple Effect Evaporator Theory
Multiple effect evaporators are heat exchanger trains that cascade in pressure as the working fluid moves through the system. Evaporators are used to increase the concentration of feed by boiling off the excess water. The most common type of multiple effect evaporator is the backward feed arrangement. Feed is introduced in the last effect while steam is introduced in the first effect. The first effect is at the highest pressure and the last effect is at the lowest pressure so a pump is required to move feed fluid through the evaporator train. Steam condenses within tubes and heats up the feed flow to its boiling temperature and then boils off some of the water in the feed, turning it to steam. That steam is then used in the next effect to heat up the feed and boil off some of the water. This process is repeated for each effect. Figure 15 shows a diagram of a three-effect evaporator and Figure 16 shows a diagram of a single three-effect.
43 Figure 16. Single Effect Diagram
Steam enters the effect on the tube side and leaves as condensate. The layout shown has feed sprays to help spread the feed fluid across the entirety of the tube surface and aid with heat transfer and boiling. In general, the governing equations of any given effect are conservations of mass and energy of the water as well as the conservation of the dissolved solids. These conservation equations can be seen below.
Conservation of mass for the Inlet Steam:
𝑚̇𝑠𝑡𝑒𝑎𝑚,𝑖𝑛 = 𝑚̇𝑐𝑜𝑛𝑑𝑒𝑛𝑠𝑎𝑡𝑒,𝑜𝑢𝑡 (3.28)
Conservation of mass for the Inlet Feed:
𝑚̇𝑓𝑒𝑒𝑑,𝑖𝑛= 𝑚̇𝑓𝑒𝑒𝑑,𝑜𝑢𝑡+ 𝑚̇𝑣𝑎𝑝𝑜𝑟,𝑜𝑢𝑡 (3.29)
Conservation of mass for the Dissolved Solids:
44 Conservation of energy for the Steam and Water:
𝑚̇𝑓,𝑖𝑛ℎ𝑓,𝑖𝑛+ 𝑚̇𝑣,𝑖𝑛(ℎ𝑓𝑔@𝑃𝑣,𝑖𝑛) = 𝑚̇𝑣,𝑜𝑢𝑡ℎ𝑔@𝑃,𝑒𝑓𝑓𝑒𝑐𝑡+ 𝑚̇𝑓,𝑜𝑢𝑡ℎ𝑓,𝑜𝑢𝑡 (3.31)
These are the governing mass and energy equations of a single effect in the multiple effect evaporator. The evaporator uses a non-pure feed consisting of a solvent and a solute. The solvent is typically water. In a saltwater evaporator, the solute is salt. Since the feed exists as a solution and not a pure substance, the boiling point varies as a function of the solute concentration. As concentration is increased, the boiling point is also increased. This phenomenon is known as the boiling point rise. Equation 3.32 shows the relationship of boiling point rise (BPR) and concentration of solute.
𝐵𝑃𝑅 = 𝑘𝑏∗ 𝑏𝑠𝑜𝑙𝑢𝑡𝑒∗ 𝑖 (3.32)
Where, kb is the ebullioscopic constant [temperature times mass solvent per moles solute]; bsolute is the molality of the solute [moles solute per mass solvent], and i is the van ‘t Hoff factor [unitless]. The van ‘t Hoff factor is a measure of the increased number of particles in the solvent
due to dissolution of the solute into independent ions. A modified version of the boiling point rise equation can be seen in Equation 3.33.
𝐵𝑃𝑅 = (𝑘𝑏∗ 𝑖 𝑀 ) (
𝑥
1 − 𝑥) (3.33)
Where M is the molecular mass of the solute [mass solute per moles solute] and x is the mass fraction of the solute [mass solute per mass solution]. With sodium chloride dissolved in water, the constants result to roughly 30 ℉∙lbm,solution / lbm,solute. Thus, the equation becomes:
𝐵𝑃𝑅 = 30 ( 𝑥
45 The feed becomes more concentrated as it moves through the evaporator train because some of the solvent boils off. As the feed becomes concentrated, the mass fraction of the solute, x, increases. This causes the boiling point rise to increase as well.
46 Figure 17. Solubility of NaCl in Water vs. Temperature
47 CHAPTER 4: Fortran Model Methodology
4.1. Governing Equations
Determining the governing equations of the multiple effect evaporator was the first step in creating the computer model. The primary equations used were conservation of mass and energy for steam, salt, and condensate for each effect. These primary equations were discussed previously in Chapter 3.
For each effect, the consumed steam is condensed inside of tubes and does not get mixed with any other flows; thus, the mass flow rate of steam into each effect is equal to the mass flow rate of the condensate out of each effect. Equation 4.1 shows this relationship below.
𝑚̇𝑠𝑡𝑒𝑎𝑚,𝑖𝑛 = 𝑚̇𝑐𝑜𝑛𝑑𝑒𝑛𝑠𝑎𝑡𝑒,𝑜𝑢𝑡 (4.1)
The steam that is condensed is used to boil some of the water out of the saltwater mixture. By boiling off some of the water, the concentration of the saltwater mixture must increase. The steam that exits the effect originates from the saltwater and again, does not mix. There are mass flows of saltwater (feed) in and out and steam out. By Conservation of Mass, any mass that goes into the effect must equal mass that comes out for each unmixed flow since there is no accumulation of steam or saltwater in any of the effects.
𝑚̇𝑓𝑒𝑒𝑑,𝑖𝑛= 𝑚̇𝑓𝑒𝑒𝑑,𝑜𝑢𝑡+ 𝑚̇𝑣𝑎𝑝𝑜𝑟,𝑜𝑢𝑡 (4.2)
48
𝑥𝑓𝑒𝑒𝑑,𝑖𝑛∗ 𝑚̇𝑓𝑒𝑒𝑑,𝑖𝑛= 𝑥𝑓𝑒𝑒𝑑,𝑜𝑢𝑡∗ 𝑚̇𝑓𝑒𝑒𝑑,𝑜𝑢𝑡 (4.3)
The final conservation equation considered is the conservation of energy within each effect. The energy into the effect must be equal to the energy out of the effect. In this case, the energy transfers from the steam to the saltwater so all flow streams must be considered in one equation.
𝑚̇𝑓,𝑖𝑛ℎ𝑓,𝑖𝑛+ 𝑚̇𝑣,𝑖𝑛(ℎ𝑓𝑔@𝑇𝑣) = 𝑚̇𝑣,𝑜𝑢𝑡ℎ𝑔@𝑇,𝑒𝑓𝑓𝑒𝑐𝑡+ 𝑚̇𝑓,𝑜𝑢𝑡ℎ𝑓,𝑜𝑢𝑡 (4.4)
Conservation of Mass and Energy are crucial equations in any thermodynamic system and are the first things considered in any model of a thermal system.
The next equations considered were the heat exchanger equations. In the presence of a phase change, the best method to use is the Epsilon-NTU Method.
𝑁𝑇𝑈 ≡ 𝑈𝐴
𝐶𝑚𝑖𝑛
(4.5)
𝜀 = 1 − 𝑒−𝑁𝑇𝑈 (4.6)
𝑄𝑎𝑐𝑡 = 𝜀𝑄𝑚𝑎𝑥 (4.7)
In this case, the actual heat transfer is the sum of the sensible heat transfer to the salt water and the latent heat of the phase change to generate steam from the saltwater.
The chemistry of the saltwater affects both the cp of the saltwater and the boiling-point-rise (BPR) of the solution. Higher proportions of salt dissolved in the water will result in a higher boiling temperature, which means heat must be supplied in order to raise the temperature to the boiling point in each effect. The boiling-point-rise as a function of mass fraction can be found in Equation 4.8. This equation was derived in Chapter 3 through equations 3.32 through 3.34.
𝐵𝑃𝑅 = 30 ( 𝑥
1 − 𝑥) (4.8)
49 4.2. Thermodynamic Property Evaluation
In order to use the governing equations, different property relationships must first be determined. The primary property used in the equations is enthalpy. Two independent, intensive properties must be known about a state to fully define it and determine other properties associated with that state. An assumption was made at the beginning of the coding process to assume that the steam into and out of each effect was going to be saturated, which yields one property about the state. With the saturation assumption in effect, it is possible to create approximations of enthalpy as a function of a single variable. Pressure was chosen as the independent variable in those approximations because the pressure of the effect remains constant, unlike temperature.
4.2.1. Enthalpy of Saturated Liquid Water
50 distorted any equation. Even with seven significant digits, errors were above 9%. It is estimated that at least 10 significant digits would be needed to reduce the error below a 5% level.
ℎ𝑓{1 < 𝑃 < 5} = 0.558344(𝑃)3− 7.44737(𝑃)2+ 42.4841(𝑃) + 34.1813 (4.9)
ℎ𝑓{5 < 𝑃 < 15} = 80.65(𝑃)0.299961 (4.10)
ℎ𝑓{15 < 𝑃 < 700} = 91.7007(𝑃)0.255873 (4.11)
ℎ𝑓{700 < 𝑃 < 3,000} = (1.31916 ∗ 10−8)(𝑃)3− (7.91134 ∗ 10−5)(𝑃)2+
0.273988(𝑃) + 334.361
(4.12)
52 Figure 19. Saturated Liquid Enthalpy vs. Pressure (0 to 50 psia)
4.2.2. Enthalpy of Saturated Vapor Water
53 over 60 BTU/lbm from 1 to 50 psia. The enthalpy changes by less than 20 BTU/lbm over the medium pressure band of 50 psia to 150 psia. The average error for the following approximations is 0.64% and the maximum error is less than 1.5%.
ℎ𝑔{1 < 𝑃 < 50} = (1.10241 ∗ 103)(𝑃)0.0159793 (4.13)
ℎ𝑔{50 < 𝑃 < 150} = (8.14061 ∗ 10−6)(𝑃)3− (3.66741 ∗ 10−3)(𝑃)2+
0.670838(𝑃) + 1,148.97
(4.14)
ℎ𝑔{150 < 𝑃 < 700} = (−2.73195 ∗ 10−10)(𝑃)4+ (6.05597 ∗ 10−7)(𝑃)3−
(5.46781 ∗ 10−4)(𝑃)2+ 0.222825(𝑃) + 1,171.6
(4.15)
ℎ𝑔{700 < 𝑃 < 3,000} = (−9.01054 ∗ 10−9)(𝑃)3+ (2.32633 ∗ 10−5)(𝑃)2−
(6.10435 ∗ 10−2)(𝑃) + 1,238.59
(4.16)
54 Figure 20. Enthalpy of Saturated Vapor Water vs. Pressure
4.2.3. Isentropic Enthalpy
The steam from the SMR steam generator enters the proposed system at an estimated 500 psia and 575℉, which is a superheated state for steam. The steam is first sent through a turbine
that is devoted to producing water via reverse osmosis. The RO turbine is assumed to have an isentropic efficiency of 60% in order to yield a conservative estimate. In order to determine the exit enthalpy and the exit state, the isentropic enthalpy is needed. Equation 4.12 shows this relationship.
𝜂𝑠 = ℎ𝑖𝑛− ℎ𝑜𝑢𝑡,𝑎𝑐𝑡𝑢𝑎𝑙
55 At first, X-steam was the planned tool, but it was determined that the isentropic relationships within X-steam were faulty when checked against steam tables. Using the superheated state at 500 psia and 575℉, the entropy was calculated to be 1.5437 BTU/lbm-R using steam tables. Then, using those same steam tables, the isentropic enthalpy out of the RO turbine was determined for each pressure up to 500 psia. The resulting data points required another piecewise function to keep relative error below 1%. The pressure split chosen was at 150 psia because the enthalpies change minimally above that pressure. Equations 4.18 and 4.19 show the correlating functions used.
56 Figure 21. Isentropic Enthalpy vs. Pressure
4.2.4. Saturation Pressure and Temperature
During a phase change, temperature and pressure remain constant. There exists an empirical relationship between the saturation temperature and pressure of a phase change – the Clausius-Clapeyron Equation. It can be seen in Equation 4.20 below.
𝑑𝑃 𝑑𝑇 =
ℎ𝑓𝑔
𝑇𝑑𝑣 (4.20)
57
log10𝑃 = 𝐴 − 𝐵
𝐶 + 𝑇 (4.21)
Pressure, P, is given in an absolute pressure, but the temperature does not have to be in absolute measure. The units chosen simply affect the value of the constants: A, B, and C. Table 2 shows the values for A, B, and C in the Antoine Equation for liquid-vapor water. These constants use temperature in degrees Celsius and output pressure in millimeters of Mercury and required conversion to be used in the program that uses Rankine for temperature and psia for pressure.
Table 2. Antoine Equation Constants for Water [17]
Temperature Range A B C
1℃ - 100℃ 8.07131 1730.63 233.426
99℃ - 374℃ 8.14019 1810.94 244.485
In the lower temperature range, the maximum deviation from X-steam saturation pressures was 0.88%, and in the upper temperature range, the maximum deviation from X-steam was 1.22%. These maximum values occur near the end points of the range. The average deviations for the lower and upper ranges are 0.38% and 0.6% respectively.
The Antoine Equation solves for saturation pressure for a given temperature, but the model also requires saturation temperature for a given pressure, so the Antoine Equation had to be solved for temperature, T.
𝑇 = 𝐵
𝐴 − log10𝑃− 𝐶 (4.22)
58 4.2.5. Specific Heat of Saltwater
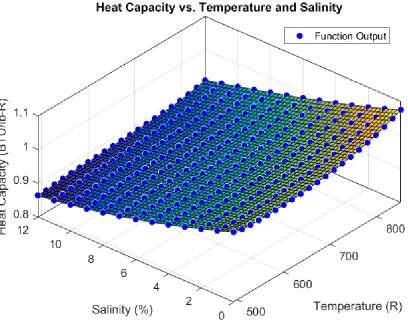
The specific heat of saltwater is dependent upon two factors: temperature and salt content. In order to generate a usable function for the specific heat of saltwater, a two-factor correlation was needed. Bromley, Diamond, Salami, and Wilkins published a study of the specific heats of sea water at varying concentrations and temperatures [18]. Using their data, Elizabeth Worsham was able to create a function of those same two variables that could be used in the Fortran model. Equation 4.23 shows the relationship of the function, and Table 3 shows the coefficients of the equation.
𝑐𝑝(𝑇, 𝑥) = 𝑝0,0+ 𝑝1,0𝑇 + 𝑝0,1𝑥 + 𝑝2,0𝑇2+ 𝑝1,1𝑇𝑥 + 𝑝0,2𝑥2+ 𝑝2,1𝑇2𝑥 + 𝑝1,2𝑇𝑥2+ 𝑝0,3𝑥3 (4.23) The temperature, T, is given in units of Rankine, and the salinity, x, is given as a percent salt content by mass. The resulting specific heat has units of BTU/lbm-R, which are standard English units.
Table 3. Specific Heat Capacity Function Coefficients and Values
𝑝0,0 1.279
𝑝1,0 -0.0009868
𝑝0,1 -0.04003
𝑝2,0 8.682e-07
𝑝1,1 8.391e-05
𝑝0,2 0.0003691
𝑝2,1 -6.536e-08
𝑝1,2 -1.608e-07
59 Figure 22. Heat Capacity vs. Temperature and Salinity
Figure 22 above shows the mesh of data points collected by Bromley et al. as well as the values of the function output at each of those data points. The output of the approximating function in Equation 4.19 is represented in the figure by the blue dots. The value of the mesh represents the data collected by Bromley et al. This approximating function has an average relative error of 0.2% and a maximum relative error of 0.8%.
4.3. Iterative Nature of the Code
60 SMR as well as the mass and energy flows from each effect. The model uses Newton’s Method as
an iterative approach to solve for a steam mass flow out of Effect 6.
4.3.1. Newton’s Method
Newton’s Method is an iterative method used to solve for the x-intercepts of functions. In
the model, it is used to find an operating point for the multiple effect evaporator where the difference between the desired steam flow from the SMR and the calculated steam flow from the SMR is zero. Newton’s Method uses the current iteration point to determine the value of the next
guess. The method can be seen in Equation 4.20.
𝑥𝑖+1= 𝑥𝑖− 𝑓(𝑥𝑖)
𝑓′(𝑥𝑖) (4.24)
Newton’s Method starts with some initial guess value, and the proceeds to trace the tangent
61 Figure 23. Newton's Method Graphical Representation [19]
Newton’s Method is useful in a number of applications, but it has a few severe limitations.
The first occurs when the derivative of the function is close to zero or is zero. When the derivative is zero, the tangent line is parallel to the x-axis and will therefore never intersect to yield the next point. Mathematically, it creates a divide-by-zero error. The second occurs when there is no convergence because the second point’s tangent line yields the first point as the third point, creating
![Figure 1. Standard NuScale Reactor Module [2]](https://thumb-us.123doks.com/thumbv2/123dok_us/1583219.1195007/17.612.195.415.215.530/figure-standard-nuscale-reactor-module.webp)
![Figure 2. Department of Energy and Idaho National Labs Nuclear-Hybrid Roadmap [3]](https://thumb-us.123doks.com/thumbv2/123dok_us/1583219.1195007/19.612.86.541.77.336/figure-department-energy-idaho-national-nuclear-hybrid-roadmap.webp)
![Figure 8. Relationship between Electric and Water Output [4].](https://thumb-us.123doks.com/thumbv2/123dok_us/1583219.1195007/29.612.118.495.319.527/figure-relationship-electric-water-output.webp)
![Figure 9. Duck Curve Depiction [12].](https://thumb-us.123doks.com/thumbv2/123dok_us/1583219.1195007/36.612.140.466.85.305/figure-duck-curve-depiction.webp)
![Figure 10. Nuclear-Renewable HES Flowchart [3]](https://thumb-us.123doks.com/thumbv2/123dok_us/1583219.1195007/37.612.99.532.184.483/figure-nuclear-renewable-hes-flowchart.webp)