DOI: 10.1534/genetics.105.054106
Contrasting Patterns of Introgression at X-Linked Loci Across
the Hybrid Zone Between Subspecies of the European
Rabbit (
Oryctolagus cuniculus
)
Armando Geraldes,*
,†,‡,1Nuno Ferrand*
,†and Michael W. Nachman
‡*CIBIO, Centro de Investigacxa˜o em Biodiversidade e Recursos Gene´ticos, Campus Agra´rio de Vaira˜o, 4485-661 Vaira˜o, Portugal,†Departamento de Zoologia e Antropologia, Faculdade de Cieˆncias da Universidade do Porto, 4099-002 Porto, Portugal and‡Department
of Ecology and Evolutionary Biology, University of Arizona, Tucson, Arizona 85721 Manuscript received November 30, 2005
Accepted for publication March 20, 2006
ABSTRACT
Hybrid zones provide an excellent opportunity for studying the consequences of genetic changes between closely related taxa. Here we investigate patterns of genetic variability and gene flow at four X-linked loci within and between the two subspecies of European rabbit (Oryctolagus cuniculus cuniculus and O. c. algirus). Two of these genes are located near the centromere and two are located near the telomeres. We observed a deep split in the genealogy of each gene with the root located along the deepest branch in each case, consistent with the evolution of these subspecies in allopatry. The two centromeric loci showed low levels of variability, high levels of linkage disequilibrium, and little introgression between subspecies. In contrast, the two telomeric loci showed high levels of variability, low levels of linkage dis-equilibrium, and considerable introgression between subspecies. These data are consistent with suppres-sion of recombination near the centromere of the rabbit X chromosome. These observations support a view of speciation where genomic incompatibilities at different loci in the genome create localized differences in levels of gene flow between nascent species.
A
key problem in evolutionary genetics concerns the origin of reproductive isolation between incipient species (Coyneand Orr2004). Two important conclu-sions come from previous studies of the genetics of reproductive isolation. First, barriers to gene flow often derive from incompatibilities between allelic variants at two or more loci,i.e., epistasis (Bateson1909; Dobzhansky 1936; Muller1940, 1942). Empirical support for epis-tasis comes from a large body of work in Drosophila, beginning with Dobzhansky (1936). More recently, specific genes underlying reproductive isolation have been identified, and all involve epistatic interactions(Malitscheket al. 1995; Tinget al. 1998; Barbashet al.
2003; Presgraveset al. 2003). Second, loci contribut-ing to reproductive isolation tend to be overrepre-sented on the X chromosome in groups in which males are heterogametic (Coyne and Orr 1989). Evidence for the ‘‘large X effect’’ comes from mapping studies of hybrid sterility and hybrid inviability (e.g., Dobzhansky 1936; Grula and Taylor 1980; True et al. 1996;
Presgraves 2003; Presgraves et al. 2003; Tao et al.
2003). Moreover, Haldane’s (1922) rule (the sterility
or inviability of heterogametic hybrids) seems to be due largely to incompatibilities involving recessive X-linked mutations (Turelliand Orr 1995, 2000). Finally, in a number of cases where sister species hybridize in nature, X-linked loci introgress less than autosomal loci (e.g., Hagen1990; Sperlingand Spence1991; Tucker et al. 1992).
The genetic basis of reproductive isolation has been studied both with laboratory crosses and in natural hybrid zones, and both approaches have advantages and disadvantages. For example, laboratory crosses make it possible to control the genetic background as well as the environment, and they are repeatable. Hybrid zones offer the advantage of many generations of recombi-nation, making fine-scale mapping more feasible. In hybrid zones, it is possible to identify genes contributing to isolation simply from patterns of gene flow without prior knowledge of the phenotype. Hybrid zones also allow us to study species that cannot be crossed in the laboratory. Finally, hybrid zones provide a picture of the fitness of hybrid genotypes under natural conditions.
The European rabbit (Oryctolagus cuniculus) provides an opportunity to study the genetic basis of reproductive isolation between recently evolved taxa. This species consists of two subspecies, O. cuniculus algirus in the southwestern portion of the Iberian Peninsula and O. cuniculus cuniculusin the northeast of the Iberian Penin-sula and France. These two groups diverged in allopatry Sequence data from this article have been deposited with the EMBL/
GenBank Data Libraries under accession nos. DQ306315–DQ306490.
1Corresponding author:Department of Ecology and Evolutionary Biology,
Biosciences West Bldg., University of Arizona, P.O. Box 210088, Tucson,
AZ 85721. E-mail: [email protected]
during the early Pleistocene and have subsequently come into secondary contact in central Iberia, forming a con-tact zone that runs in a NW–SE direction (Figure 1)
(Brancoet al. 2000, 2002). The two subspecies are well
differentiated with respect to mtDNA (Branco et al. 2000), the Y chromosome (Geraldeset al. 2005), and some allozyme loci (Ferrandand Branco2006).
Motivated by the large X-effect documented in other species, here we focus on four X-linked loci to un-derstand the nature of reproductive isolation in rabbits. Two of these loci are near the centromere and two are near the telomeres. We address three main questions. First, what are the levels and patterns of genetic varia-tion at genes on the rabbit X chromosome? Second, are patterns of variation and introgression heterogeneous among loci, and if so, do the differences correlate with the physical location of genes on the X chromosome? Third, are the data compatible with a model of diver-gence without gene flow? We surveyed nucleotide var-iability at four X-linked loci in a sample of 43 male rabbits representing both subspecies and the area of contact. All four loci showed two divergent lineages. Despite this deep divergence, there is still evidence of gene flow between subspecies. Patterns of gene flow and nucleotide variability were heterogeneous among loci,
being low at the centromeric loci and high at the telo-meric loci. We hypothesize that the centrotelo-meric region of the X chromosome of the European rabbit may be involved in reproductive isolation between these two subspecies.
MATERIALS AND METHODS
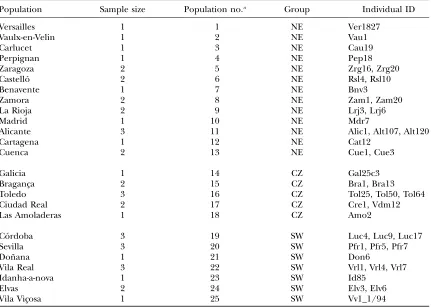
Samples: Forty-three male European rabbits were sampled (Table 1). The samples were divided into three groups: 20 from the northeastern region of the Iberian Peninsula and from France, corresponding toO. c. cuniculus(NE), 14 from the southwestern region of the Iberian Peninsula, correspond-ing toO. c. algirus(SW), and 9 from the contact zone (CZ) as defined by mtDNA variation (Brancoet al. 2000). The geo-graphic locations of the populations sampled are shown in Figure 1, and collecting localities are given in Table 1. Ad-ditionally, one maleLepus granatensiswas used as an outgroup.
rat. Nested primers were then designed specifically for the rabbit on the basis of the first sequences obtained. Amplifica-tions were carried out in 50-ml volumes using PlatinumTaq High Fidelity DNA Polymerase (Invitrogen, San Diego) following manufacturer recommendations. Cycling temper-atures were as follows: an initial denaturation step at 94°for 1 min and 20 sec followed by 35 cycles of 94°for 20 sec, an-nealing for 20 sec, and extension at 68°for 4 min. Annealing temperatures for each PCR are specified in supplemental Table 1 at http://www.genetics.org/supplemental/. PCR prod-ucts were purified using the QIAquick PCR purification kit (QIAGEN, Chatsworth, CA) prior to sequencing. Sequencing was carried out using an ABI 3700 automated sequencer. All sequences have been deposited in GenBank under accession nos. DQ306315–DQ306490.
Data analyses:Sequences were inspected and concatenated using the computer program Sequencher (Gene Codes, Ann Arbor, MI) and then aligned manually using the BioEdit soft-ware (Hall1999). By sequencing the X chromosome in males we were able to recover haplotypes directly. The analyses below were based on single nucleotide polymorphisms in introns only.
Basic population genetic parameters, including the number of segregating sites, number of haplotypes, levels of nucleotide diversity, p (Nei and Li 1979), and the proportion of seg-regating sites,u(Watterson1975), were estimated using the program DnaSP 4.00 (Rozaset al. 2003) for the entire data set and also for the NE, CZ, and SW groups (Figure 1). Phy-logenetic relationships among alleles were estimated using the median-joining algorithm (Bandelt et al. 1999) as
imple-mented in Network v4.1.0.8 (http://www.fluxus-technology. com/).
We estimated divergence three ways. First, divergence be-tween allO. cuniculusalleles andL. granatensiswas calculated as the average pairwise distance per nucleotide site, Dxy (Nei 1987), and as the number of net nucleotide substitutions per site,Da(Nei1987).Dais defined asDxy0.5 (Dx1Dy), where Dxyis the average pairwise distance between groups andDxand Dyare the average pairwise distances within groups. Second, DxyandDawere calculated between the NE and SW groups of O. cuniculus. Finally, to estimate the divergence time of the two subspecies ofO. cuniculus, maximum-likelihood net nu-cleotide distances betweenL. granatensisandO. cuniculus, and between the two main lineages found in O. cuniculus (see results), were calculated using PAUP v 4.0 (Swofford2002). Divergence time between subspecies of O. cuniculuswas cal-culated assuming a divergence time betweenL. granatensisand O. cuniculusof 11.8 million years (MY) (Mattheeet al. 2004). The population recombination parameter,R(R¼3Ncfor X-linked loci, wherecis the recombination rate per generation andNis the population size) between adjacent sites (Hudson 1987), the minimum number of recombination events, Rm (Hudsonand Kaplan1985), and the number of pairs of sites showing four gametic types were calculated using DnaSP 4.00 (Rozaset al. 2003). Another estimator of the population re-combination parameter,g(Heyand Wakeley1997), was cal-culated using the software SITES. While Hudson’sRis based on the variance of the number of base-pair differences be-tween DNA sequences,gis a maximum-likelihood estimator developed using a coalescent model for a sample of four DNA
TABLE 1
Individuals sampled and their geographic locations
Population Sample size Population no.a Group Individual ID
Versailles 1 1 NE Ver1827
Vaulx-en-Velin 1 2 NE Vau1
Carlucet 1 3 NE Cau19
Perpignan 1 4 NE Pep18
Zaragoza 2 5 NE Zrg16, Zrg20
Castello´ 2 6 NE Rsl4, Rsl10
Benavente 1 7 NE Bnv3
Zamora 2 8 NE Zam1, Zam20
La Rioja 2 9 NE Lrj3, Lrj6
Madrid 1 10 NE Mdr7
Alicante 3 11 NE Alic1, Alt107, Alt120
Cartagena 1 12 NE Cat12
Cuenca 2 13 NE Cue1, Cue3
Galicia 1 14 CZ Gal25c3
Bragancxa 2 15 CZ Bra1, Bra13
Toledo 3 16 CZ Tol25, Tol50, Tol64
Ciudad Real 2 17 CZ Cre1, Vdm12
Las Amoladeras 1 18 CZ Amo2
Co´rdoba 3 19 SW Luc4, Luc9, Luc17
Sevilla 3 20 SW Pfr1, Pfr5, Pfr7
Don˜ana 1 21 SW Don6
Vila Real 3 22 SW Vrl1, Vrl4, Vrl7
Idanha-a-nova 1 23 SW Id85
Elvas 2 24 SW Elv3, Elv6
Vila Vicxosa 1 25 SW Vv1_1/94
sequences with recombination. Linkage disequilibrium (LD) between pairs of polymorphic sites present at a frequency of at least 10% was calculated within and between all loci, using the statisticsD9(Lewontin1964) andr2(Hilland Robertson 1968) as implemented in DnaSP 4.00 (Rozaset al. 2003).
Tajima’s D(Tajima1989) and Fu and Li’s D(Fu and Li 1993) were calculated to test for deviations from a neutral equilibrium frequency distribution using DnaSP 4.00 (Rozas et al. 2003). Ratios of polymorphism within O. cuniculusto divergence betweenO. cuniculusandL. granatensiswere com-pared with the expectations under a neutral model using the Hudson–Kreitman–Aguade´ (HKA) test (Hudsonet al. 1987). We performed one four-locus test and six pairwise compar-isons between loci using the HKA software (Heyand Kliman 1993).
At each of the four loci we detected a deep split in the genealogy (seeresults). We asked if the observed pattern of nucleotide polymorphism is compatible with a single panmitic population, as opposed to some form of population sub-division. If two populations have evolved in allopatry, the basal branch of a gene genealogy may be longer than in a panmitic population. Furthermore, mutations arising in an isolated subpopulation are unable to recombine with mutations in a different subpopulation, resulting in higher levels of LD. Wall(2000) suggested two measures based on LD that could be powerful indicators of population subdivision. The first,lb, is the number of congruent sites, defined as the number of mutations that, on a pairwise basis, result in only two hap-lotypes. The second,gd, is the maximum physical distance be-tween congruent sites. Coalescent simulations of panmixia were performed with the computer program ms (Hudson 2002). For each locus, 50,000 genealogies of 43 individuals were simulated conditioned on the estimated values ofuandg. Additionally, for each locus, coalescent simulations were per-formed using two different values of the population recombi-nation parameter (3Nc ¼0.0015 and 3Nc ¼0.015 per site),
chosen to reflect the range of recombination rates known for other mammals (e.g., Dietrichet al. 1994; Konget al. 2002; Jensen-Seamanet al. 2004). A computer program (Garrigan et al. 2005) was used to calculatelbandgdfrom the simulated data sets, and the distributions of the two statistics for each set of conditions were plotted against each other. The probability of obtaining the observed values oflbandgdwas calculated as the proportion of simulated genealogies for which the values ofldandgdwere greater than the observed values.
FSTandNmwere calculated using the method of Hudson
et al. (1992a) implemented in DnaSP 4.00 (Rozaset al. 2003). Genetic differentiation was also calculated using the test statistic Ks* (Hudson et al. 1992b), and significance was as-sessed by performing 1000 permutations. To test for signifi-cant population structure among populations and among groups of populations, analyses of molecular variance (AMOVA; Excoffieret al. 1992) between the SW and NE groups were performed using ARLEQUIN (Schneideret al. 2000).
One simple model of divergence is an isolation model in which two populations become separated with no subsequent gene exchange. The HKA model (Hudsonet al. 1987) takes this form and further assumes that the ancestral species has a population size that is the average of the two descendant species. More recent models relax this assumption. For ex-ample, Wakeleyand Hey(1997) proposed a model that is similar to the HKA model but includes an additional param-eter,uA, the population mutation parameter for the ancestral species. While the HKA test uses only the number of poly-morphic sites and divergence, this model also incorporates the total number of polymorphic positions in the two groups (S), the number of polymorphisms exclusive to one group (SxNE andSxSW), the number of shared polymorphisms (Ss), and the number of fixed differences (Sf). We tested the fit of our data to these two models in two different ways. First, we performed pairwise comparisons among all loci, and second, we per-formed tests with all four loci together. The fit of our data to the Wakeley and Hey model of divergence without gene flow was tested using the program WH (Wanget al. 1997).
These models assume that there has been no gene flow between the two populations since the initial split. In many cases this is an unrealistic assumption. Hey and Nielsen (2004) developed a model of population divergence that al-lows for genetic drift (increasing population divergence) and gene flow (preventing population divergence) to act together, which they call the isolation with migration model. The com-puter program IM is an implementation of the Markov chain Monte Carlo method for the analyses of genetic data under this model. We used IM to estimate the effective population size ofO. c. cuniculusand ofO. c. algirusand to estimate migra-tion rates for each locus between subspecies in each direcmigra-tion. IM assumes that there is no recombination within loci. For Phka2andHprt1, we used the largest region showing no evi-dence of recombination, following Wonand Hey(2005). For Phka2, a portion of 687 bp containing 23 polymorphic sites was used, and for Hprt1, a region of 501 bp with 20 poly-morphic sites was used. ForSmcx, all 20 NE and 14 SW in-dividuals were used since the data are free of recombination. ForMsn, we removed three recombinant individuals (Vau1, Rsl4, and Rsl10) from the NE group. We assigned wide prior distributions of the parameters on the basis of preliminary trial runs. We ran the program under Metropolis Coupled Monte Carlo Markov Chains, using 10 chains with linear heating. We used a burn-in period of 1,000,000 steps and recorded results every 40 steps. To test whether the chains were mixing well, we ran the program with different random seed numbers and the results were similar. We ran the program for 25,625,601 steps after the burn-in period and recorded the results of 625,014 steps.
RESULTS
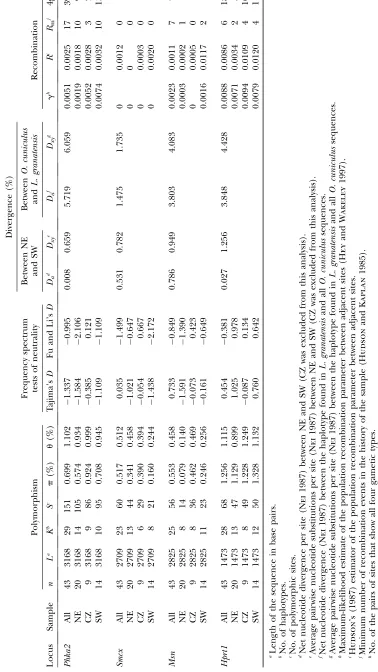
Levels and patterns of variation: We observed con-siderable variation at all four genes. Polymorphic sites for each gene are shown in Figure 3, and summaries of variation are given in Table 2. The number of poly-morphic sites varied from 56 atMsnto 151 atPhka2, but the number of haplotypes observed at each gene was much more constant (from 23 atSmcxto 29 atPhka2). Levels of polymorphism were high, both in the total sample and within each subspecies. However, nucleo-tide diversity (p) at the two centromeric loci was con-siderably lower (0.52% atSmcxand 0.55% atMsn) than at the two telomeric loci (0.70% at Phka2 and 1.26% atHprt1). This contrast was even more striking in the proportion of segregating sites, whereuat the centro-meric loci was roughly half the value seen at the telomeric loci.
We assessed the amount of LD in our sample in several ways, and all were consistent in revealing more recombination (less LD) at the telomeric loci than at the centromeric loci (Table 2), consistent with suppres-sion of recombination near the centromere. The
num-ber of pairs of sites showing all four gametic types was zero atSmcx, 77 atMsn,390 atPhka2, and 180 atHprt1. Rm, the minimum number of recombination events in the history of the sample (Hudsonand Kaplan1985), was zero atSmcx, intermediate atMsnandHprt1(7 and 6, respectively), and highest atPhka2(17). Similarly,R
(Hudson 1987) between adjacent sites was low at the
two centromeric loci (SmcxandMsn) and much higher at the telomeric loci (Phka2andHprt1). The values forg
Figure3.—Continued.
between sites atPhka2, and 130 between sites atHprt1. Interlocus LD was detected only betweenSmcxandMsn
where there were 341 pairs of sites that showed sig-nificant LD.
The distribution of allele frequencies as measured by Tajima’s D and Fu and Li’sDgenerally conformed to expectations under a neutral model of molecular evolu-tion (Table 2). For example, in the total sample, Tajima’s
D was positive (Msn and Hprt1), very close to zero (Smcx), or negative (Phka2), but not significantly dif-ferent from zero. When the population groups were analyzed separately, Tajima’s D was negative (except for Hprt1 in the NE and SW groups), but not signifi-cantly so (P.0.05 for all tests). We also tested a neutral model of molecular evolution by comparing ratios of polymorphism withinO. cuniculus(in the total sample) to divergence between O. cuniculus and L. granatensis, using the HKA test. We performed one four-locus com-parison as well as six pairwise comcom-parisons among loci, and none of these were significant (P.0.05 for each).
Divergence and gene flow between subspecies: FST
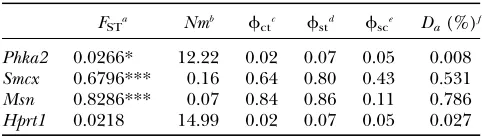
estimates between O. c. cuniculusand O. c. algirusare shown in Table 3.FSTwas very high at the centromeric loci,Smcx (0.680) andMsn(0.829), and one order of magnitude lower at the telomeric loci, Phka2(0.027) andHprt1(0.022). The two subspecies were significantly differentiated, using theKs* test statistic, at all loci but
that at the two centromeric loci, Smcxand Msn, most of the genetic variation is partitioned among the two subspecies (64 and 84%, respectively) while at the tel-omeric loci,Phka2andHprt1, most of the observed var-iation was partitioned among populations within each subspecies (93% at both loci), and only a marginal proportion (2%) of the variation segregated between subspecies.
This differentiation can also be seen in the phylogeny of alleles for each gene (Figure 4). At each locus there were two divergent groups of haplotypes, and in each case the root fell along the deep branch separating these two groups. In this analysis, onlySmcxwas free of homoplasy. The locus with the most homoplasy was
Phka2. This homoplasy may be due to recombination or recurrent mutation. Evidence for recurrent mutation comes from the observation that atHprt1three different positions have three nucleotides segregating (Figure 3d). Other evidence of recurrent mutation is the fact that the amount of homoplasy is slightly reduced if CpG sites, which are known to be hypermutable, are ex-cluded. For example, forPhka2, the consistency index (CI) increased from 0.778 to 0.803 when CpG sites were removed. However, much of the homoplasy is probably
due to recombination, as evidenced by the fact that the CI was 1.0 for Smcx, 0.889 at Msn, but was 0.778 and 0.717 at Phka2 and Hprt1, respectively. Moreover, at
Phka2andHprt1, 1 and 16 individuals, respectively, were identified as recombinants between the two divergent lineages on the basis of their position on the haplotype network and by visual inspection of the table of poly-morphism (Figure 3, a and d).
The degree of introgression between subspecies can also be seen by the concordance (or lack thereof) be-tween geography and phylogeny. For the two centro-meric loci (SmcxandMsn), there was good concordance between phylogeny and geography;i.e., the two major lineages correspond well with each subspecies (Figure 4). AtMsnwe did not detect any introgressed haplotypes and atSmcxwe observed only three NE individuals with haplotypes from the lineage that is otherwise restricted to the SW and CZ groups. At the two telomeric genes (Phka2andHprt1), in contrast, there seems to be little or no concordance between phylogeny and geography. At all four genes, individuals from the CZ group are scattered throughout the haplotype networks.
The proportion of congruent sites,lb, is greater at the two centromeric loci (representing 30 and 32% of all polymorphic sites atSmcxand atMsn, respectively) than at the telomeric loci (11% atPhka2and 16% atHprt1). Similarly, the maximum distance between congruent sites,gd, is greater atSmcx(85% of the total locus length) and at Msn (95%) than at Phka2 (65%) and Hprt1
(16%). We calculated the probability of observing these values oflbandgdusing coalescent simulations of 50,000 genealogies of 43 individuals evolving neutrally under panmixia with mutation (u) and recombination (g) pa-rameters estimated from the data. Results are shown in Table 4. Under these conditions, the null model was rejected for Msn(P ¼0.00214). This test is quite conservative using g estimated from the data since population subdivision will increase LD and thus un-derestimate the true value of recombination. Therefore, we also conducted simulations with a population size of 105and per-site recombination rates of 0.53108and
53 108, reflecting the range of recombination rates
seen in other mammals (e.g., Dietrichet al. 1994; Kong et al. 2002; Jensen-Seamanet al. 2004). At the two cen-tromeric loci,MsnandSmcx, the null model was rejected using either value of recombination. For Phka2, the null hypothesis was rejected only with the higher re-combination rate, andHprt1was marginally significant (P ¼ 0.066) only for the higher recombination rate (Table 4).
Another way of looking at divergence is to quantify the amount of shared and fixed variation between the two groups (Table 5). The number of shared polymor-phisms was low at the centromeric loci (16 and 6% of all polymorphisms at Smcxand Msn, respectively) and high at the telomeric loci (42 and 64% at Phka2 and
Hprt1, respectively). OnlyMsnshowed fixed differences
TABLE 3
Genetic differentiation between NE and SW groups at four X-linked loci
FSTa Nmb fctc fstd fsce Da(%)f
Phka2 0.0266* 12.22 0.02 0.07 0.05 0.008
Smcx 0.6796*** 0.16 0.64 0.80 0.43 0.531
Msn 0.8286*** 0.07 0.84 0.86 0.11 0.786
Hprt1 0.0218 14.99 0.02 0.07 0.05 0.027
*P,0.05, **P,0.01, ***P,0.005. a
FSTwas calculated using the method proposed by Hudson et al. (1992). Statistical significance for the estimation ofFST between the two groups was obtained with the Kst* statistic (Hudsonet al. 1992).
b
Nm was calculated according to Wright’s (1951) island model of population structure, using the expressionFST ¼ 1/(113Nm) for X-linked loci.
cf
ctis the fixation index for the amount of variation seg-regating between NE and SW groups, calculated using the AMOVA framework (Excoffieret al. 1992). For the NE group, the 13 populations studied were pooled into seven subgroups (NE1: populations 1, 2, 3, and 4; NE2: population 5; NE3: pop-ulation 6; NE4: poppop-ulations 7 and 8; NE5: poppop-ulations 9 and 10; NE6: populations 11 and 12; and NE7: population 13). For the SW group, the 7 populations studied were pooled into four sub-groups (SW1: population 19; SW2: populations 20 and 21; SW3: population 22; and SW4: populations 23, 24, and 25).
d
fstis the fixation index for the amount of variation segre-gating within each subgroup, calculated using the AMOVA framework (Excoffieret al. 1992).
ef
scis the fixation index for the amount of variation segre-gating among subgroups within each group, calculated using the AMOVA framework (Excoffieret al. 1992).
f
between the two groups. These patterns of variation suggest that there has been gene flow between O. c. cuniculusandO. c. algirusat some, but not all, loci. To further test this, we performed an HKA test between NE and SW population groups. A multilocus test between
D ¼ 10.68). The isolation without migration model
(Wakeleyand Hey, 1997) shares most of the
assump-tions with the HKA model, but estimates the ancestral population size instead of assuming that it is the average of the population size of the extant populations. A four-locus test using this model also failed to reject the null hypothesis. We also tested the fit of the data using all pairwise comparisons toMsn. Only the comparisons to
Msnwere performed because in the other comparisons there are no fixed differences and the program is unable to simulate the distribution of the expected values. The comparison betweenSmcxandMsnfailed to reject the null model while the other two comparisons did reject the null model (Phka2/Msn:P(x2)¼0.032 and P(WH) ¼0.030;Msn/Hprt1:P(x2)¼0.024 and P(WH) ¼
0.009).
We used IM (Hey and Nielsen 2004) to obtain maximum likelihood estimates (MLE) of the effective population size for each subspecies. We also estimated migration rates for each locus in each direction. The average estimate of the effective population size was
882,000 forO. c. algirusand 422,000 forO. c. cuniculus
(Table 6). The probability distribution of the ancestral population parameter was flat (not shown), as expected if the ancestral population existed long ago (Wonand Hey 2005). Similarly, the probability distribution of t, the time since divergence, was flat, but nonzero (not shown). This suggests that the two subspecies were isolated in the past, but this analysis does not provide a reliable estimate of the time of isolation. Gene flow at the telomeric loci was higher from NE to SW than from SW to NE. For the centromeric loci, introgression of
Msnis quite low in both directions, while Smcx shows some unidirectional introgression from SW to NE. Thus it seems that levels and patterns of gene flow are very different between centromeric and telomeric loci.
We estimated divergence time between the two sub-species ofO. cuniculususing a phylogenetic approach. Assuming a divergence time of 11.8 MY (Matthee et al. 2004) betweenO. cuniculusandL. granatensis, diver-gence time betweenO. c. cuniculusandO. c. algiruswas estimated to be on the order of 2–5 MYA (Table 7). Figure4.—Continued.
TABLE 4
Probabilities of observing the number of congruent sites,lb, and maximum distance between congruent sites,gd, under a
single panmitic population
gestimated from dataa g¼0.0015b g¼0.015c
lb gd lbandgd lb gd lbandgd lb gd lbandgd
Phka 2 0.35364 0.96288 0.34002 0.76470 0.99352 0.76296 0.04484 0.89190 0.04032
Smcx 0.39566 0.79952 0.37298 0.09558 0.33292 0.04248 0.00010 0.10748 0.00004
Msn 0.03470 0.03466 0.00214 0.06722 0.04908 0.00638 0.00006 0.01082 0.00000
Hprt 1 0.17324 0.99916 0.17302 0.62354 0.99992 0.62354 0.06626 0.99742 0.06626
Probabilities were calculated as the proportion of simulated genealogies with values oflb,gd, or both, equal to or greater than those observed in our data.
a
ForPhka2,g¼0.0051 per site; forSmcx,g¼0 per site; forMsn,g¼0.0023 per site; and forHprt1,g¼0.0088 per site. b
g¼3Nc, whereN¼13105andc¼0.53108per site.
cg¼
DISCUSSION
We documented genetic variation at four X-linked loci in natural populations of the European rabbit,O. cuniculus. At each locus, we observed a deep split in the phylogeny with the root lying along the long internal branch. This pattern is consistent with the evolution of each subspecies in allopatry and subsequent second-ary contact. Despite this broad similarity among loci, we detected heterogeneity among loci in terms of levels of nucleotide polymorphism, recombination, and intro-gression between the two subspecies. This heterogeneity corresponds well with the physical location of the loci on the rabbit X chromosome. The two centromeric loci had lower levels of nucleotide polymorphism, higher levels of LD, and reduced introgression in comparison with the two telomeric loci. Although we do not have direct estimates of the frequency of crossing over in rabbits, these observations are consistent with suppres-sion of recombination near the centromere, as has been observed in other species (e.g., Konget al. 2002).
Levels and patterns of variation: Across the entire sample (i.e., including both subspecies), the average het-erozygosity among all loci (p¼0.76%) was high and roughly one order of magnitude higher than heterozy-gosity at X-linked loci in humans (p¼0.081%; Hammer et al. 2004) and mice (p ¼0.078%; Nachman 1997). Clearly, this high level of nucleotide variability reflects not only nucleotide polymorphism within each subspe-cies but also the divergence between subspesubspe-cies. One gene (Msn) showed no introgression between subspe-cies. Levels of nucleotide polymorphism at this gene were 0.14% forO. c. cuniculusand 0.26% forO. c. algirus, closer to values observed in humans (Hammer et al. 2004) and mice (Nachman1997).
We also observed variation in levels of polymorphism among loci. Interestingly, the two centromeric loci had lower levels of p and u than observed at the two
TABLE 5
Shared and fixed variation between NE and SW groups at four X-linked loci
Sa S
xNE
b S
xSW
c S
sd Sfe
Phka2 140 45 (64.6) 35 (56.5) 60 (41.1) 0 (10.9) Smcx 56 35 (16.9) 12 (14.7) 9 (10.7) 0 (2.8) Msn 53 11 (15.2) 20 (13.3) 3 (9.7) 19 (2.6)
Hprt1 59 9 (20.3) 15 (17.7) 38 (12.9) 0 (3.4)
The expected values under the population parameters esti-mated with WH software (Wakeleyand Hey1997) are shown in parentheses.
a
S, no. of polymorphic positions. b
SxNE, no. of exclusive polymorphisms in the NE group. c
SxSW, no. of exclusive polymorphisms in the SW group. d
Ss, no. of shared polymorphisms. e
Sf, no. of fixed differences.
telomeric loci, both for the entire data set and for each subspecies considered separately. Within each subspe-cies, this difference may be explained by different levels of introgression. In other words,SmcxandMsnmay be less variable within each subspecies because they con-tain relatively few introgressed haplotypes, compared to
Phka2andHprt1. However, we also observe less variation atSmcxandMsnin the total sample. This may be due in part to lower mutation rates at these genes. For ex-ample, divergence between Oryctolagus and Lepus is lower atSmcx(Dxy¼1.74%) andMsn(Dxy¼4.08%) than
atPhka2(Dxy¼6.06%) orHprt1(Dxy¼4.43%) (Table 2).
If recombination is suppressed near the centromere, these differences in mutation rate may reflect an as-sociation between mutation and recombination (e.g.,
Hellmannet al. 2003). It is also possible that reduced
variation atSmcxandMsnmay be due partly to the effect of either positive or negative selection at linked sites
(Maynard-Smith and Haigh 1974; Charlesworth
et al. 1993).
Indirect evidence that recombination is suppressed near the centromere comes from our observation of in-creased LD at Smcx and Msncompared to Phka2and
Hprt1. Patterns of LD are affected by many factors, in-cluding selection, mutation, recombination, and changes in population size (e.g., Ardlieet al. 2002). However, in humans, there is good evidence that levels of LD are inversely correlated with recombination rate over much of the genome (e.g., Reichet al. 2001; McVeanet al. 2004; Myerset al. 2005). Moreover, in many organisms, recom-bination is suppressed near the centromeres, particularly in metacentric chromosomes (e.g., Kong et al. 2002). Thus, our observation of increased LD atSmcxandMsn
relative toPhka2andHprt1is consistent with, but not proof of, reduced recombination near the rabbit X centromere.
Divergence and gene flow between subspecies:RFLP surveys of mtDNA polymorphism in the Iberian Penin-sula and France have shown that O. cuniculus is com-posed of two deeply divergent mtDNA lineages that are thought to have diverged 2 MYA (Biju-Duval et al. 1991; Branco et al. 2000). A survey of nucleotide var-iability atSryalso found evidence for the existence of two divergent lineages in the Y chromosome (Geraldes et al. 2005). These two lineages are associated with
O. c. algirusandO. c. cuniculus(Brancoet al. 2000) and are thought to have evolved in allopatry. Our X chromosome data confirm the existence of two di-vergent evolutionary units inO. cuniculus, and we show that in general the data reject the evolution of the two lineages under panmixia. The divergence time esti-mated from these loci is in good agreement with divergence time estimated from mitochondrial genes and places the origin of these two subspecies at the Pliocene/Pleistocene boundary. We observed high lev-els of population differentiation at the two centromeric loci, but not at the telomeric loci. At the centromeric loci the two divergent lineages correspond well with the described subspecies and are broadly concordant with the patterns of differentiation seen at the Y chromo-some and at the mtDNA. The same was not observed at the two telomeric loci, where geography and phylogeny are largely decoupled.
If two populations evolve in allopatry for a sufficiently long time and then come into secondary contact with little or no gene flow, a high percentage of fixed dif-ferences and a small number of shared polymorphisms are expected. In our data this is seen only atMsnwhere 36% of all polymorphisms correspond to fixed differ-ences between groups, and 6% correspond to shared polymorphisms. At all other loci, there are no fixed
TABLE 7
Uncorrected and corrected net nucleotide (Da) divergences betweenO. cuniculusandL. granatensisand between subspecies
ofO. cuniculus, and estimates of divergence time (MY) between subspecies ofO. cuniculus
O. cuniculus/L. granatensis O. c. cuniculus/O. c. algirus
Uncorrected Corrected Uncorrected Corrected
Da(%) Da(%) Da(%) Divergence time (MY) Da(%) Divergence time (MY)
Phka2 5.719 8.483a 1.153 2.38 1.263a 1.76
Smcx 1.475 1.529b 0.735 5.88 0.750b 5.79
Msn 3.803 4.634c 0.711 2.21 0.819c 2.08
Hprt1 3.848 5.313d 1.633 5.01 1.911d 4.24
Appropriate models of nucleotide substitution to correct for multiple hits were selected for each gene using MODELTEST 3.06 (Posadaand Crandall1998) with the Akaike Information Criterion (Posadaand Buckley2004). Pairwise distances (Dxy) per site were calculated using PAUP v 4.0 (Swofford2002) with locus-specific estimated models of substitution. Net nucleotide di-vergences (Da) per site were calculated asDxy0.5 (Dx1Dy). Recombinant haplotypes were excluded from this analysis.
a
Tamura–Nei(1993) model with proportion of invariable sites of 0.6578 and estimateda-parameter describing the gamma distribution of 1.0022.
b
Tamura–Nei(1993) model with proportion of invariable sites of 0.5536. c
Transversion model with estimateda-parameter describing the gamma distribution of 0.2204. d
differences between subspecies and the percentage of shared polymorphisms varies from 16% at Smcx (cen-tromeric) to 64% atHprt1 (telomeric). This heteroge-neity among loci is also reflected in the rejection of an isolation without gene flow model using the HKA test between Phka2andMsn and the rejection of the null model using the WH test betweenPhka2andMsnand betweenHprt1andMsn.
It is noteworthy that the patterns of reduced intro-gression seen atSmcxandMsn, which may experience reduced recombination, are similar to the patterns seen previously at the mtDNA (Brancoet al. 2000) and the Y chromosome (A. Geraldes, unpublished data), geno-mic regions with no recombination. In contrast, a survey of 14 allozyme loci revealed higher, but variable, levels of introgression (fctbetween subspecies ranged from
0 to 0.46), comparable to the patterns observed at X chromosome loci. Differences among loci in levels of introgression have also been documented in other or-ganisms. For example, genomic regions with suppressed recombination as a result of chromosomal rearrange-ments introgress less than colinear regions in compar-isons betweenDrosophila pseudoobscura andD. persimilis
(Nooret al. 2001; Machadoet al. 2002) and between hy-bridizing sunflowers of the genus Helianthus (Rieseberg et al. 1999). On the basis of such observations, Noor et al. (2001) and Rieseberg (2001) have argued that chromosomal rearrangements may promote speciation, not through underdominance directly as in traditional models (e.g., White1978), but by suppressing recom-bination and thereby extending the effects of isolation genes to linked sites. Our finding of low levels of intro-gression in an area of high LD near the X chromosome centromere of the rabbit is consistent with similar ob-servations in fruit flies and sunflowers. Similarly, in Anopheles mosquitoes, two (of three) areas of reduced introgression map to centromeres (Turneret al. 2005). Our observations also have some interesting parallels with studies of hybridization in the house mice, Mus musculusandM. domesticus. In the house mouse hybrid zone in Western Europe, the Y chromosome shows re-duced introgression (Vanlerbergheet al. 1986; Tucker et al. 1992; Dodet al. 1993), and the X chromosome shows lower levels of introgression than do the autosomes
(Tuckeret al. 1992; Dodet al. 1993; Munclingeret al.
2002), although there is also considerable variability in levels of introgression among loci on the X chromosome
(Payseur et al. 2004). In a similar fashion, we observe
some X-linked loci with much reduced introgression in rabbits, providing further support for the importance of the X chromosome in reproductive isolation. Interest-ingly, the differences among loci in migration estimates (Table 6) may provide some clues to the nature of in-compatibilities underlying reproductive isolation. In particular we note that estimates of the number of mi-grants from NE to SW for the centromeric loci are slightly lower than in the opposite direction. This is in
agreement with the expected asymmetric behavior of young Dobzhansky–Muller interactions (Orr1995) and suggests that incompatibilities may derive from inter-actions between the cuniculus X chromosome and an
algirusgenetic background.
One ultimate goal of speciation studies is to deter-mine the identity of genes involved in reproductive isolation between nascent species. With the completion of the sequence of the rabbit genome expected in the next few years, it may soon be possible to identify can-didate genes for reproductive isolation in this species. The results presented here suggest that some of these genes may lie near the centromere of the X chromosome.
We thank R. Villafuerte for help in collecting rabbit samples; J. Good and C. Pinho for valuable discussions; D. Garrigan, T. Salcedo, and M. Dean for help with ms simulations; and J. Hey for help with IM. We also thank two anonymous reviewers for suggestions on a previous version
of this manuscript. This work was supported by Fundacxa˜o para a
Cieˆncia e a Tecnologia (SFRH/BD/4621/2001) Ph.D. grant to A.G. and Research Project POCTI/BSE/40280/2001 and by a National Science Foundation grant to M.W.N.
LITERATURE CITED
Ardlie, K. G., L. Kruglyakand M. Seielstad, 2002 Patterns of linkage
disequilibrium in the human genome. Nat. Rev. Genet.3:299–309.
Bandelt, H. J., P. Forsterand A. Rohl, 1999 Median-joining
net-works for inferring intraspecific phylogenies. Mol. Biol. Evol.16:
37–48.
Barbash, D. A., D. F. Siino, A. M. Taroneand J. Roote, 2003 A rap-idly evolving MYB-related protein causes species isolation in
Drosophila. Proc. Natl. Acad. Sci. USA100:5302–5307. Bateson, W., 1909 Heredity and variation in modern lights, pp.
85–101 in Darwin and Modern Science, edited by A. C. Seward.
Cambridge University Press, Cambridge, UK.
Biju-Duval, C., H. Ennafaa, N. Dennebouy, M. Monnerot, F.
Mignotteet al., 1991 Mitochondrial DNA evolution in Lago-morphs: origin of systematic heteroplasmy and organization of
diversity in European rabbits. J. Mol. Evol.33:92–102.
Branco, M., N. Ferrandand M. Monnerot, 2000 Phylogeography
of the European rabbit (Oryctolagus cuniculus) in the Iberian
Pen-insula inferred from RFLP analyses of the cytochromebgene.
Heredity85:307–317.
Branco, M., M. Monnerot, N. Ferrand and A. R. Templeton,
2002 Postglacial dispersal of the European rabbit (Oryctolagus
cuniculus) on the Iberian Peninsula reconstructed from nested clade and mismatch analyses of mitochondrial DNA variation.
Evolution56:792–803.
Chantry-Darmon, C., C. Rogel-Gaillard, M. Bertaud, C. Urien, M. Perrocheau et al., 2003 133 new gene localizations on
the rabbit cytogenetic map. Cytogenet. Genome Res.103:192–
201.
Charlesworth, B., M. T. Morganand D. Charlesworth, 1993 The effect of deleterious mutations on neutral molecular variation.
Genetics134:1289–1303.
Coyne, J. A., and H. A. Orr, 1989 Two rules of speciation, pp. 180–
207 in Speciation and Its Consequences, edited by D. Otte and
J. Endler. Sinauer Associates, Sunderland, MA.
Coyne, J. A., and H. A. Orr, 2004 Speciation. Sinauer Associates,
Sunderland, MA.
Davidson, J. J., T. Ozcelik, C. Hamacher, P. J. Willems, U. Francke
et al., 1992 cDNA cloning of a liver isoform of the phosphorylase-kinase alpha-subunit and mapping of the gene to Xp22.2-p22.1, the region of human X-linked liver glycogenosis. Proc. Natl. Acad.
Sci. USA89:2096–2100.
Dietrich, W. F., J. C. Miller, R. G. Steen, M. Merchant, D. Damron
et al., 1994 A genetic map of the mouse with 4,006 single
Dobzhansky, T. H., 1936 Studies on hybrid sterility. II. Localization
of sterility factors inDrosophila pseudoobscurahybrids. Genetics21:
113–135.
Dod, B., L. S. Jermiin, P. Boursot, V. H. Chapman, J. Tonnes-Nielsen
et al., 1993 Counterselection on sex-chromosomes in theMus musculusEuropean hybrid zone. J. Evol. Biol.6:529–546. Excoffier, L., P. E. Smouseand J. M. Quattro, 1992 Analysis of
molecular variance inferred from metric distances among DNA haplotypes: application to human mitochondrial DNA restriction
data. Genetics131:479–491.
Ferrand, N., and M. Branco, 2006 The evolutionary history of the
European rabbit (Oryctolagus cuniculus): major patterns of
popu-lation differentiation and geographic expansion inferred from
protein polymorphism, pp. 207–235 inPhylogeography of European
Refugia, edited by S. Weiss and N. Ferrand. Springer, The Netherlands (in press).
Fu, Y. X., and W. H. Li, 1993 Statistical tests of neutrality of
muta-tions. Genetics133:696–709.
Garrigan, D., Z. Mobasher, S. B. Kingan, J. A. Wilderand M. F. Hammer, 2005 Deep haplotype divergence and long-range link-age disequilibrium at Xp21.1 provide evidence that humans descended from a structured ancestral population. Genetics
170:1849–1856.
Geraldes, A., C. Rogel-Gaillard and N. Ferrand, 2005 High
levels of nucleotide diversity in the European rabbit (Oryctolagus
cuniculus) SRY gene. Anim. Genet.36:349–351.
Grula, J. W., and O. R. Taylor, 1980 Some characteristics of
hy-brids derived from the sulphur butterflies, Colias eurytheme
and Colias philodice: phenotypic effects of the X chromosome.
Evolution34:673–687.
Hagen, R. H., 1990 Population structure and host use in
hybridiz-ing subspecies of Papilio glaucus (Lepidoptera: Papilionidae).
Evolution44:1914–1930.
Haldane, J. B. S., 1922 Sex-ratio and unisexual sterility in hybrid
animals. J. Genet.12:101–109.
Hall, T. A., 1999 BioEdit: a user friendly biological sequence
align-ment editor and analyses program for Windows 95/98/NT.
Nucleic Acids Symp. Ser.41:95–98.
Hammer, M. F., D. Garrigan, E. Wood, J. A. Wilder, Z. Mobasher
et al., 2004 Heterogeneous patterns of variation among multi-ple X-linked loci: the possible role of diversity-reducing selection
in non-Africans. Genetics167:1841–1853.
Hayes, H., C. Rogel-Gaillard, C. Zijlstra, N. A.deHaan, C. Urien
et al., 2002 Establishment of an R-banded rabbit karyotype no-menclature by FISH localization of 23 chromosome-specific genes on both G- and R-banded chromosomes. Cytogenet. Genome Res.
98:199–205.
Hellmann, I., I. Ebersberger, S. E. Ptak, S. Paaboand M. Przeworski,
2003 A neutral explanation for the correlation of diversity with
recombination rates in humans. Am. J. Hum. Genet. 72:1527–
1535.
Hey, J., and R. M. Kliman, 1993 Population genetics and
phyloge-netics of DNA sequence variation at multiple loci within the
Dro-sophila melanogasterspecies complex. Mol. Biol. Evol.10:804–822.
Hey, J., and R. Nielsen, 2004 Multilocus methods for estimating
population sizes, migration rates and divergence time, with
appli-cations to the divergence ofDrosophila pseudoobscuraandD.
persi-milis. Genetics167:747–760.
Hey, J., and J. Wakeley, 1997 A coalescent estimator of the
popu-lation recombination rate. Genetics145:833–846.
Hill, W. G., and A. Robertson, 1968 Linkage disequilibrium in
finite populations. Theor. Appl. Genet.38:226–231.
Hudson, R. R., 1987 Estimating the recombination parameter of
a finite population model without selection. Genet. Res. 50:
245–250.
Hudson, R. R., 2002 Generating samples under a Wright-Fisher
neutral model of genetic variation. Bioinformatics18:337–338.
Hudson, R. R., and N. L. Kaplan, 1985 Statistical properties of the number of recombination events in the history of a sample of
DNA sequences. Genetics111:147–164.
Hudson, R. R., M. Kreitmanand M. Aguade´, 1987 A test of neutral
molecular evolution based on nucleotide data. Genetics 116:
153–159.
Hudson, R. R., D. D. Boosand N. L. Kaplan, 1992 A statistical test
for detecting geographic subdivision. Mol. Biol. Evol.9:138–151.
Hudson, R. R., M. Slatkinand W. P. Maddison, 1992 Estimation of
levels of gene flow from DNA sequence data. Genetics132:583–
589.
Jensen-Seaman, M. I., T. S. Furey, B. A. Payseur, Y. Lu, K. M. Roskin
et al., 2004 Comparative recombination rates in the rat, mouse
and human genomes. Genome Res.14:528–538.
Kong, A., D. F. Gudbjartsson, J. Sainz, G. M. Jonsdottir, S. A.
Gudjonssonet al., 2002 A high-resolution recombination map
of the human genome. Nat. Genet.31:241–247.
Lewontin, R. C., 1964 Interaction of selection and linkage. I.
Gen-eral considerations: heterotic models. Genetics49:49–67.
Machado, C. A., R. M. Kliman, J. A. Markertand J. Hey, 2002 In-ferring the history of speciation from multilocus DNA sequence
data: the case ofDrosophila pseudoobscuraand close relatives. Mol.
Biol. Evol.19:472–488.
Malitschek, B., D. Fornzlerand M. Schartl, 1995 Melanoma
formation inXiphophorus: a model system for the role of receptor
tyrosine kinases in tumorigenesis. BioEssays17:1017–1023.
Matthee, C. A., B. J.vanVuuren, D. Bell and T. J. Robinson,
2004 A molecular supermatrix of the rabbits and hares
(Lepor-idae) allows for the identification of five intercontinental
ex-changes during the Miocene. Syst. Biol.53:433–447.
Maynard-Smith, J., and J. Haigh, 1974 The hitch-hiking effect of a
favorable gene. Genet. Res.23:23–35.
McVean, G. A. T., S. R. Myers, S. Hunt, P. Deloukas, D. R. Bentley
et al., 2004 The fine-scale structure of recombination rate
vari-ation in the human genome. Science304:581–584.
Muller, H. J., 1940 Bearing of the Drosophilawork on
systemat-ics, pp. 185–268 inThe New Systematics, edited by J. S. Huxley.
Clarendon Press, Oxford.
Muller, H. J., 1942 Isolating mechanisms, evolution and
tempera-ture. Biol. Symp.6:71–125.
Munclinger, P., E. Bozikova, M. Sugerkova, J. Pialek and M. Macholan, 2002 Genetic variation in house mice (Mus, Mur-idae, Rodentia) from the Czech and Slovak Republics. Folia Zool.
51:81–92.
Myers, S., L. Bottolo, C. Freeman, G. McVeanand P. Donnelly,
2005 A fine-scale map of recombination rates and hotspots
across the human genome. Science310:321–324.
Nachman, M. W., 1997 Patterns of DNA variability at X-linked loci inMus domesticus. Genetics147:1303–1316.
Nei, M., 1987 Molecular Evolutionary Genetics. Columbia University
Press, New York.
Nei, M., and W. H. Li, 1979 Mathematical model for studying
ge-netic variation in terms of restriction endonucleases. Proc. Natl.
Acad. Sci. USA76:5269–5273.
Noor, M. A. F., K. L. Grams, L. A. Bertucci and J. Reiland,
2001 Chromosomal inversions and the reproductive isolation
of species. Proc. Natl. Acad. Sci. USA98:12084–12088.
Orr, H. A., 1995 The population genetics of speciation: the
evolu-tion of hybrid incompatibilities. Genetics139:1805–1813.
Payseur, B. A., J. G. Krenzand M. W. Nachman, 2004 Differential patterns of introgression across the X chromosome in a
hy-brid zone between two species of house mice. Evolution58:2064–
2078.
Posada, D., and T. R. Buckley, 2004 Model selection and model averaging in phylogenetics: advantages of Akaike information cri-terion and Bayesian approaches over likelihood ratio tests. Syst.
Biol.53:793–808.
Posada, D., and K. A. Crandall, 1998 MODELTEST: testing the
model of DNA substitution. Bioinformatics14:817–818.
Presgraves, D. C., 2003 A fine-scale genetic analysis of hybrid
in-compatibilities in Drosophila. Genetics163:955–972.
Presgraves, D. C., L. Balagopalan, S. M. Abymayrand H. A. Orr,
2003 Adaptive evolution drives divergence of a hybrid
invi-ability gene between two species ofDrosophila. Nature423:715–
719.
Reich, D. E., M. Cargill, S. Bolk, J. Ireland, P. C. Sabetiet al.,
2001 Linkage disequilibrium in the human genome. Nature
411:199–204.
Rieseberg, L. H., 2001 Chromosomal rearrangements and
specia-tion. Trends Ecol. Evol.16:351–358.
Rieseberg, L. H., J. Whittonand K. Gardner, 1999 Hybrid zones and the genetic architecture of a barrier to gene flow between
Rozas, J., J. C. Sanchez-DelBarrio, X. Messeguerand R. Rozas,
2003 DnaSP, DNA polymorphism analyses by the coalescent
and other methods. Bioinformatics19:2496–2497.
Sambrook, J., and D. W. Russell, 2001 Molecular Cloning: A
Labora-tory Manual. Cold Spring Harbor Laboratory Press, Cold Spring Harbor, NY.
Schneider, S., D. Roessliand L. Excoffier, 2000 Arlequin: A
Soft-ware Program for Population Genetics Data Analysis. Genetics and Bi-ometry Lab, Department of Anthropology, University of Geneva, Geneva.
Sperling, F. A. H., and J. R. Spence, 1991 Structure of an asymmet-ric hybrid zone between two water strider species (Hemiptera:
Gerridae: Limnoporus). Evolution45:1370–1383.
Swofford, D. L., 2002 PAUP*: Phylogenetic Analysis Using Parsimony
and Other Methods, Version 2.0.b10. Sinauer Associates, Sunder-land, MA.
Tajima, F., 1989 Statistical methods for testing the neutral mutation
hypothesis by DNA polymorphism. Genetics123:585–595.
Tamura, K., and M. Nei, 1993 Estimation of the number of nucle-otide substitutions in the control region of mitochondrial DNA
in humans and chimpanzees. Mol. Biol. Evol.10:512–526.
Tao, Y., S. Chen, D. L. Hartland C. C. Laurie, 2003 Genetic
dis-section of hybrid incompatibilities betweenDrosophila simulans
andD. mauritiana. I. Differential accumulation of hybrid male
sterility effects on the X and autosomes. Genetics164: 1383–
1397.
Ting, C. T., S. C. Tsaur, M. L. Wuand C. I. Wu, 1998 A rapidly
evolv-ing homeobox at the site of a hybrid sterility gene. Science282:
1501–1504.
True, J. R., B. S. Weirand C. C. Laurie, 1996 A genome-wide survey
of hybrid incompatibility factors by the introgression of marked
segments ofDrosophila mauritianachromosomes intoDrosophila
simulans. Genetics142:819–837.
Tucker, P. K., R. D. Sage, J. Warner, A. C. Wilsonand E. M. Eicher,
1992 Abrupt cline for sex chromosomes in a hybrid zone
be-tween two species of mice. Evolution46:1146–1163.
Turelli, M., and H. A. Orr, 1995 The dominance theory of
Hal-dane’s rule. Genetics140:389–302.
Turelli, M., and H. A. Orr, 2000 Dominance, epistasis and the
genetics of postzygotic isolation. Genetics154:1663–1679.
Turner, T. L., M. W. Hahnand S. V. Nuzhdin, 2005 Genomic
islands of speciation inAnopheles gambiae. PLoS Biol.3:e285.
Vanlerberghe, F., B. Dod, P. Boursot, M. Bellisand F. Bonhomme,
1986 Absence of Y chromosome introgression across the hybrid
zone betweenMus musculus domesticusandMus musculus
muscu-lus. Genet. Res.48:191–197.
Wakeley, J., and J. Hey, 1997 Estimating ancestral population
parameters. Genetics145:847–855.
Wall, J. D., 2000 Detecting ancient admixture in humans using
sequence polymorphism data. Genetics154:1271–1279.
Wang, R. L., J. Wakeleyand J. Hey, 1997 Gene flow and natural
selection in the origin ofDrosophila pseudoobscuraand close
rela-tives. Genetics147:1091–1106.
Watterson, G. A., 1975 On the number of segregating sites in
ge-netical models without recombination. Theor. Popul. Biol. 7:
256–276.
White, M. J. D., 1978 Modes of Speciation. W. H. Freeman, San
Francisco.
Won, Y. J., and J. Hey, 2005 Divergence population genetics of
chim-panzees. Mol. Biol. Evol.22:297–307.
Wright, S., 1951 The genetical structure of populations. Ann.
Eugen.15:323–354.