©
DOI: 10.1534/genetics.103.025940
Copy Correction and Concerted Evolution in the Conservation of Yeast Genes
Saumyadipta Pyne,* Steven Skiena* and Bruce Futcher
†,1*Department of Computer Science and†Department of Microbiology and Molecular Genetics, Stony Brook University, Stony Brook, New York 11794
Manuscript received August 4, 2004 Accepted for publication April 6, 2005
ABSTRACT
The yeastSaccharomyces cerevisiaeand other members of the genus Saccharomyces are descendants of an ancient whole-genome duplication event. Although most of the duplicate genes have since been deleted, many remain, and so there are many pairs of related genes. We have found that poorly expressed genes diverge rapidly from their paralog, while highly expressed genes diverge little, if at all. This lack of divergence of highly expressed paralogous gene pairs seems to involve gene correction: one member of the pair “corrects” the sequence of its twin, and so the gene pair evolves as a unit. This correction presumably involves gene conversion and could occur via a reverse-transcribed cDNA intermediate. Such correction events may also occur in other organisms. These results support the idea that copies of poorly expressed genes are preserved when they diverge to take on new functions, while copies of highly expressed genes are preserved when they are needed to provide additional gene product for the original function.
I
T is generally believed that selection for preferred mRNA into cDNA using reverse transcriptase and a sub-sequent recombinational interaction between the cDNA codons (codon bias) increases the sequenceconser-vation of highly expressed genes relative to poorly ex- and the second copy of the chromosomal gene. In the pressed genes (the “selection hypothesis”) (Powelland second mechanism, correction is due to a direct
recom-Moriyama 1997). Both highly expressed and poorly binational interaction between the two genes of a dupli-expressed genes are selected for function, which means cate pair.
that many nonsynonymous codon changes are selected In the following sections, we first show that correction against; but in addition, for highly expressed genes, indeed plays a significant role in the conservation of many synonymous changes are also selected against to gene pairs in yeast and that correction is correlated with maintain codons preferred for translational efficiency the level of gene expression. Evidence for correction and accuracy. A corollary of this argument is that when is, first, that the conservation between the members of an organism has two similar copies of a highly expressed a highly expressed gene pair is too high to be explained gene, these copies should be preserved in evolution as by selection alone, and second, that the pattern of nucle-a gene pnucle-air shnucle-aring high homology, becnucle-ause selection otide substitution within and between species of Sac-for both function and codon bias prevents the members charomyces is much more compatible with the
correc-of the pair from drifting apart. tion hypothesis than with the selection hypothesis. We
In this study, we propose a parallel hypothesis for the examine some properties of correction and consider conservation of duplicated highly expressed genes and whether correction might play a role in other organisms. show that the new hypothesis not only plays a significant
role, at least in yeast, but also may be more important
than selection under certain conditions. MATERIALS AND METHODS
We call our hypothesis thecorrection hypothesis. It
con-Saccharomyces sequences were obtained from the Saccharo-sists of three proposals: first, that one copy of a gene
myces Genome Database (http://www.yeastgenome.org/), can correct the sequence of a second copy; second, from Washington University (http://www.genome.wustl.edu/ that correction depends on high sequence identity; and projects/yeast/ and http://www.genome.wustl.edu/blast/yeast_ third, that the probability of correction depends on client.cgi), and from the Massachusetts Institute of Technol-ogy (http://www-genome.wi.mit.edu/seq/Saccharomyces/). the level of gene expression. We propose two possible
ClustalW-based end-to-end fungal alignments of the
Saccharo-mechanisms of correction. In the first, correction
hap-myces cerevisiae genes and their analogous sequences in the pens through the occasional copying back of mature other Saccharomyces species were obtained from the Saccha-romyces Genome Database (SGD; http://www.yeastgenome. org) whenever available.
Genes and gene pairs from the ancient duplication were 1Corresponding author:Department of Microbiology and Molecular
selected using the “blocks menu” page of the website of Wolfe
Genetics, Stony Brook University, Stony Brook, NY 11794-5222.
E-mail: [email protected] and colleagues at http://acer.gen.tcd.ie/cgi-bin/khwolfe/
blocks.pl?block⫽ALL. All gene pairs from the above site whose coding sequences appear at SGD under the same systematic/ standard name were downloaded in an automated manner. Any gene, and thus its pair, with a name that led to confusion in its recognition, was discarded. Note especially that we have not analyzed all duplicated genes in S. cerevisiae. We have restricted our study to those genes thought to have been dupli-cated as part of a single, ancient, genome-wide duplication event. For example, many duplications near telomeres appear to be recent duplications. We have not included any of these recently duplicated, telomere-associated genes in our analysis. We used a modified version of the Jukes-Cantor model for measuring divergence between a pair of gene sequences. The conventional Jukes-Cantor model for computing evolutionary divergence between two sequences is extended to account for “internal” indels in the pairwise alignment of sequences. (An internal indel is not a part of the continuous batch of indels that might be present at either extremity of a pairwise align-ment, perhaps owing to the difference in the lengths of the two sequences.) The modified measure treats an indel as a substitution of weightcbetween 0 and 1, inclusive, whereas a substitution of any kind is, as in the conventional model, of weight 1. Upon making the usual approximations, the diver-gence is given by⫺d⫽ ⫺((3⫹c)/(4⫹c))⫻ln(1⫺(4⫹ c)⫻p/(3⫹c)), wherepis the proportion of substitutions, which, in our model, is a 1:cweighted proportion of both substitutions and internal indels. Clearly, a weight of c⫽0 reduces the new measure to the old one. Inheriting the
prop-erty of the old model, the new measure is also a partial func- Figure 1.—Divergence as a function of expression in S. tion;i.e., it is not defined for certain values of the valid inputp. cerevisiae. For each of 764 genes (the members of qualified The divergence-expression figures are plotted with the above gene pairs from the ancient duplication; seematerials and parametercset to 1. Varying the value ofcbetween 0 and 1 methods), the closest homolog is found. The modified Jukes-makes little difference to the plots. Cantor divergence score for the pair, if defined (materials
For computing the counts and ratio of synonymous and
and methods), is plotted on they-axis, on the basis of the nonsynonymous substitutions, we use the Synonymous Non- ClustalW pairwise alignment of the genes. The CAI of the synonymous Analysis Program (SNAP) available at the HIV chosen gene is plotted on the x-axis. CAI is a surrogate for Sequence Database (hiv-web.lanl.gov) (Nei and Gojobori the level of mRNA produced. Note that the divergence of 1986). Complete data are available at: http://www.cs.sunysb. each gene pair (g
1, g2) is plotted twice, once against the CAI
edu/ⵑcompbio/Correction/. of g
1and once against the CAI of g2. There is a strong negative
correlation between divergence and CAI (i.e., level of expres-sion), with correlation coefficientr⫽ ⫺0.72 (P⬍ 10⫺16for
the null hypothesis thatr⫽0). RESULTS
High expression, conservation, and correction: The
genus Saccharomyces arose from an ancient whole- (i.e., high expression) and low DNA sequence diver-genome duplication event, shortly after Saccharomyces gence.
diverged from Kluyveromyces (Wolfe and Shields The correction model:The correlation seen in Figure 1997;Kelliset al.2004). Subsequent to the duplication, 1 is not necessarily inconsistent with the “selection” many individual deletion events deleted one of the cop- model. However, the very strong correlation and the ies of most of the duplicate genes. Nevertheless, theS. very large differences in sequence identity were so
strik-cerevisiae of today has up to 450 gene pairs (16% of ing that we wondered whether there might be some the proteome) remaining from the ancient duplication other explanation. In particular, some highly expressed (SeoigheandWolfe1999). While studying a 382-pair gene pairs were⬎95% identical in DNA sequence de-subset of these duplicates, we found a remarkably strong spite apparently diverging many millions of years ago negative correlation between sequence divergence and (WolfeandShields1997). This striking conservation
the codon adaptation index (CAI; Figure 1). CAI might be explained if DNA sequence correction
oc-(Sharp and Li 1987) is used as a surrogate for gene curred between members of the pair. S. cerevisiae has expression (Futcher et al. 1999). That is, the highly a very active homologous recombination system, and expressed genes have diverged less from their duplicates recombination or gene conversion could account for than the poorly expressed genes. The Pearson correla- pairs with very high identity.
tion isr⫽ ⫺0.72 (P⬍10⫺16for the null hypothesis that In the most obvious model of sequence correction
Figure2.—The correction model. In DNA-DNA Correction (left), one gene interacts with a second gene and corrects it by gene conver-sion. In RNA-DNA Correction (right), one gene is transcribed and then copied into cDNA (or a cDNA/RNA hybrid), and this cDNA mol-ecule interacts with a second gene and corrects it by gene conversion.
dence that very highly transcribed genes are particularly members of a gene pair have drifted sufficiently far apart, they would no longer be able to correct each active in recombinational events, while repressed genes
are relatively inactive (Saxeet al.2000). other.
In either model, genes expressed at a high level cor-A second model of sequence correction (Figure 2,
“RNA-DNA Correction”) invokes an RNA intermediate. rect each other frequently because highly transcribed genes are recombinationally active (Saxeet al.2000), as This model depends upon the fact thatS. cerevisiae
con-tains a retrotransposon, Ty, which encodes a reverse in the DNA-DNA model, or because highly transcribed genes make more RNA, as in the RNA-DNA model, and transcriptase. Occasionally, this reverse transcriptase
makes cDNA copies of normal, cellular genes (Xuand so do not drift apart. Because they do not drift apart, they remain eligible for future correction events. Genes
Boeke 1990), and these cDNA copies can recombine
with their chromosomal homologs (Derr et al. 1991; expressed at a low level correct each other infrequently, and so sometimes drift far apart between correction
DerrandStrathern1993). It has been proposed that
reverse transcription followed by homologous recombi- events, greatly reducing the probability of future correc-tion. Thus, there would be two groups of gene pairs—a nation explains why so few genes in S. cerevisiae have
introns (Baltimore1985;Fink1987). In these propos- highly expressed, highly conserved group and a poorly expressed, poorly conserved group.
als, a gene with an intron produces a transcript; the
transcript is spliced; the spliced transcript is converted Correctionvs.selection:We wished to distinguish the selection model from the correction models and took to cDNA by Ty reverse transcriptase; and then the cDNA
interacts with the chromosomal gene and removes the advantage of the fact that five other species of Saccharo-myces (castelli,kluyveri, mikatae,paradoxus, andbayanus) intron by gene conversion. Similarly, in our model of
correction via an RNA intermediate (Figure 2), an have recently been sequenced (Cliften et al. 2003;
Kelliset al.2003). These species diverged fromS.
cerevis-mRNA produced by gene copy 1 is converted to cDNA
by Ty reverse transcriptase. This cDNA then interacts iaeat various times (paradoxus, 10 MYA;byanus, 20 MYA;
mikatae, 20 MYA;castelli, 50 MYA;kluyveri, very roughly with gene copy 2, and by gene conversion corrects gene
copy 2 into an exact duplicate of gene copy 1. Over 75 MYA), whereas the duplication of the Saccharomyces genome preceded most of these speciation events (the succeeding generations, gene copies 1 and 2 may again
drift apart, but then will undergo another round of probable exception being the speciation ofS. kluyveri). We reasoned as follows: if the sequence of a gene is correction, again making the two genes identical. An
attractive feature of this model is that the probability maintained solely by selection, and not by correction, then the rate at which the similarity of gene 1 copy 1 of correction is obviously directly proportional to the
level of gene expression: the more mRNA that is made, and gene 1 copy 2 drift apart withinS. cerevisiaewill be roughly the same as that of gene 1 copy 1 ofS. cerevisiae
the higher the probability that some of it will be
con-verted to cDNA. This could explain the strong correla- drifting from their orthologs in each of the other spe-cies. In other words, if there is no correction, then each tion between pairwise homology and expression level.
However, a weakness of this model is that RNA-mediated gene in each species will diverge independently and at roughly the same rate, regardless of whether there is a gene conversion is much rarer than DNA-DNA events
(DerrandStrathern1993). duplicate gene in the same cell. If anything, divergence will be faster when there is a duplicate copy in the same A feature of both of these correction models is that
gene conversion will occur only between sequences that cell, since the duplicate can provide important functions lost by its mutating partner. Alternatively, if correction have a very high percentage of identity; even a small
number of mismatches drastically reduces the frequency is a significant force, then gene 1 copy 1 and gene 1 copy 2 inS. cerevisiae will drift apart more slowly (if at of gene conversion (ModrichandLahue1996;Datta
ortholog in each of the other species, since of course cerevisiaeparalog. Divergence was examined as a corre-late of the codon adaptation index (SharpandLi1987). there will not be any correction between species. (Note
that for purposes of this argument, it does not matter Results are shown in Figure 3.
There are several noteworthy points. First, for genes whether the genes are unique or duplicate pairs in the
other species.) Thus, for each S. cerevisiae gene in a expressed at low and medium levels, the divergence is roughly proportional to the time since divergence. This list of 382S. cerevisiae gene pairs, we found the closest
ortholog in each of the other five species and compared is true both between species and within S. cerevisiae. Second, for genes expressed at high levels, the diver-the divergence of diver-these five orthologs and of diver-the S.
gence is decreased;i.e., highly expressed genes tend to be more conserved. This conservation is consistent with the idea that selection is important in preserving highly expressed genes; presumably some of the effect is due to selection for preferred codons. Nevertheless, the di-vergence between the highly expressedS. cerevisiaegenes and their castelli or kluyveri homologs is still
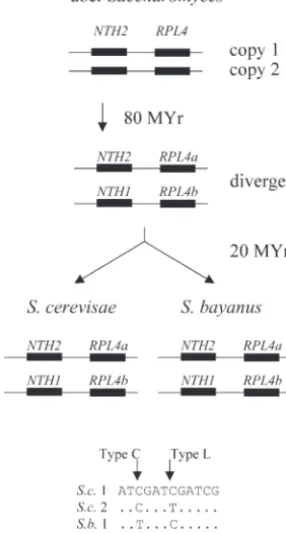
bosomal proteins) and theNTH1/NTH2genes (encod-ing neutral trehalase). InS. cerevisiae,RPL4aandNTH2
are linked on chromosome 2, while their duplicates,
RPL4bandNTH1, are linked on chromosome 4. These gene pairs are part of the “block 3” syntenic duplicated region defined by Wolfe and colleagues (http://acer. gen.tcd.ie/ⵑkhwolfe/yeast/nova/), and they are de-rived from the genome-wide duplication of 100 MYA. These gene duplicates have also survived inS. bayanus. Thus, we can now align four gene copies for each type of gene (S.c. RPL4a, S.c. RPL4b, S.b. RPL4a, and S.b. RPL4b, or S.c. NTH1, S.c. NTH2, S.b. NTH1, and S.b. NTH2) and ask about the patterns of nucleotide substi-tution.
Any pair of duplicated genes from the ancient dupli-cation event has hadⵑ80 MY in which to diverge before the separation ofS. cerevisiaefromS. bayanusⵑ20 MYA. Thus, in the absence of correction, one would expect
cerevisiaecopy 1 and its orthologbayanuscopy 1 to share certain nucleotide changes, whilecerevisiaecopy 2 and its orthologbayanuscopy 2 to share other changes, because copy 1 and copy 2 have had ⵑ80 MY to diverge, while the two orthologs of copy 1 in the two species have had only 20 MY. We call this pattern of nucleotide
substitu-Figure4.—Gene lineages and patterns of nucleotide substi- tion (where the orthologs in different species share a tution. The evolutionary lineages of theNTH1/2andRPL4a/b distinguishing nucleotide) the “L” pattern, for “lin-genes are shown. At a type C (correction) position, the
intra-eage.” In contrast, if correction occurs, then cerevisiae
species duplicates share a distinguishing nucleotide, while at
copy 1 andcerevisiaecopy 2 (i.e., the paralogs) will share a type L (lineage) position, the interspecies homologs, which
are most closely related by descent, share a distinguishing certain nucleotide changes (because the change has
nucleotide. been copied from 1 to 2 or vice versa), whilebayanus
copy 1 andbayanuscopy 2 will share other changes. We call this pattern of substitution (where paralogs within able, showing that there is still sequence space into the species share a distinguishing nucleotide) the “C” which these genes can diverge while still maintaining pattern, for “correction.” The bottom of Figure 4 shows function. Third and most striking, for highly expressed these two different patterns of nucleotide substitution. genes, there is very little divergence between the two Finally, mutational noise will sometimes generate a
situ-S. cerevisiae copies. The red line in Figure 3 for the ation in whichcerevisaecopy 1 will share a distinguishing intraspeciescerevisiae-cerevisiaecomparisons initially (i.e., nucleotide with copy 2 (i.e., the nonorthologous gene) at lowest CAI) shows very high divergence scores, but inbayanus. We call this a type N pattern, for “noise”; its then falls at higher CAIs, crossing through all the inter- frequency is important for estimating the number of C species comparisons, until finally at the highest CAI the and L patterns that might be due to noise.
cerevisiae-cerevisiae comparisons have the lowest diver- Figure 5 shows a sample four-way alignment of part gence. That is, two highly expressedcerevisiaecopies may of theRPL4a,bandNTH1,2 genes, and Table 1 shows have only a few mismatches and⬎95% DNA sequence results for the full-length four-way alignments. It is clear identity, despite the fact that the two genes diverged and striking that the highly expressedRPL4genes show long ago, and despite the fact that many more mis- exclusively the type C pattern of nucleotide substitution, matches are present between the sameS. cerevisiaegenes arguing that they have undergone correction, while the and their closest orthologs in all the other species, which tightly linkedNTH1,2genes show mainly type L substitu-diverged more recently. In summary, in intraspecies tion (305 positions). Although 31 type C substitutions comparisons, we see a striking lack of divergence be- are seen in theNTH1 vs. NTH2comparison, there are tween pairs of very highly expressed genes, even though also 35 type N substitutions, arguing that the type C it is clear from interspecies comparisons that such genes substitutions in these genes are simply mutational noise, can diverge. Since correction can occur within a species and not correction. Thus, as predicted, this pair of but not between species, we take this as evidence for highly expressed genes shows primarily (in this case,
correction. exclusively) the correction pattern of substitution, while
ri-Figure5.—Alignment of theRPL4a,b andNTH1,2genes. A representative 60 nucleotides of theRPL4a,bandNTH1,2 genes fromS. cerevisiae(S.c.) andS. baya-nus(S.b.) are aligned. Type C (correc-tion) substitutions are underlined and in boldface type; type L (lineage) substi-tutions are in boldface type, and type N (noise) substitutions are underlined.
tern of substitution. We consider this very strong evi- C/L ratio⫽0.078), and these ratios differ significantly
dence for the correction model. between the two groups (P⬍10⫺15by a chi-square test).
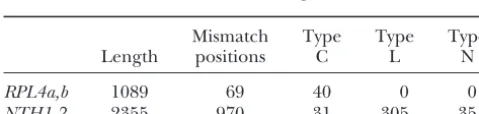
We extended this analysis to most of the syntenic Second, of 128 low-bias gene pairs, 126 have a low duplicated blocks defined by Wolfe and co-workers (http:// C/L ratio, as predicted. The two exceptions are
LYS20-acer.gen.tcd.ie/ⵑkhwolfe/yeast/nova/). We examined LYS21 andPPH21-PPH22, both members of block 12. all blocks (a) that contained at least one gene pair with These two genes in block 12 are close together on chro-a high codon bichro-as chro-and (b) where we could find two mosome 4 and in the same orientation. That is,LYS20
different bayanus orthologs of the high-codon-bias is close toLYS21, andPPH21is close toPPH22, all on gene(s). There wereⵑ28 eligible blocks. For all of these chromosome 4. This situation is perhaps favorable for genes (both high and low bias) where twobayanusor- DNA-DNA conversion (e.g., during meiotic mispairing thologs existed (168 genes total), we did the four-way of these tightly linked tandem syntenic regions), and alignments, as shown in Figure 5, and noted the number this may explain the high C/L ratio for these two gene of C (correction), L (lineage), and N (noise) nucleotide pairs. That is, DNA-DNA-based correction may have oc-substitutions. These results are shown in Table 2. The curred in the recent past, and DNA-DNA correction
main results are as follows. may not be as dependent on expression level as the
First, we compared the low-bias genes to the high- RNA-DNA correction that we suggest for the majority bias genes. The high-bias genes tend to have a high C/L of genes.
ratio (weighted mean C/L ratio⫽ 2.1), while the low- Third, of 33 high-bias genes, 20 have a C/L ratio⬎1, bias genes tend to have a low C/L ratio (weighted mean as predicted, but 13 have a C/L ratio⬍1; for instance, in the most extreme case, theRPS1A,RPS1Bgene pair has 5 correction substitutions, but 30 lineage substitu-TABLE 1
tions. Thus a substantial minority of the high-bias genes Correction and lineage substitutions in the do not seem to be undergoing correction. For the 20 RPL4andNTH1/2genes high-bias genes with C/L⬎1, the total number of events is 400 C, 57 L, and 29 N, for a C/L ratio of 7.0; and for Mismatch Type Type Type the 13 high-bias genes with C/L⬍1, the total number
Length positions C L N
of events is 40 C, 154 L, and 17 N, for a C/L ratio of
RPL4a,b 1089 69 40 0 0 0.26. The distribution of the normalized number of C
NTH1,2 2355 970 31 305 35 substitutions for the 33 high-bias genes appears to be bimodal, and statistical tests reject the hypothesis of a “Length” is the length of the nucleotide alignment, and in
single normally distributed population (P⬍10⫺7using
these cases is the length of the open reading frame of the
gene. “Mismatch positions” is the number of positions where a Shapiro-Wilk normality test). Thus, there seem to be all four nucleotides in the alignment are not identical,e.g.,an two kinds of high-bias genes: one kind that undergoes alignment of T:T:T:C or T:T:C:C, etc. “Type C” is a mismatch
concerted evolution via correction and a second kind position of the C type, characteristic of correction, where the
that does not. Possible reasons for these two populations two cerevisae genes share the same nucleotide and the two
bayanus genes share a different nucleotide (e.g., T:T:C:C). are considered in thediscussion.
“Type L” is a mismatch position of the L type, characteristic Fourth, the 20 high-bias gene pairs with a C/L ratio of the gene lineage, wherecerevisiae gene 1 and itsbayanus ⬎1 had a mean of 3.8% base-pair mismatches, while homolog share the same nucleotide, whilecerevisiae gene 2
the 13 high-bias genes with a C/L ratio⬍1 had a mean and its bayanus homolog share a different nucleotide (e.g.,
of 8.2% base-pair mismatches, confirming that correc-T:C:T:C). “Type N” is a mismatch position characteristic of
mutational noise, wherecerevisiaegene 1 and itsbayanusnon- tion is associated with high sequence identity, while lack homolog share the same nucleotide, whilecerevisiae gene 2 of correction is associated with divergence.
and itsbayanusnonhomolog share a different nucleotide (e.g.,
Fifth, we judged six gene pairs to be of medium codon T:C:C:T). Positions of the type T:T:T:C (i.e., one nucleotide
bias. All six pairs showed the low C/L ratio typical of at odds with the other three) are mismatch positions, but are
TABLE 2
Ratios of correction to lineage substitutions for duplicated genes
Block no. Gene pair CAI C L N C/L
7 NHP6B-NHP6A Low 3 26 5
7 YMC2-YMC1 Low 9 132 10
7 TKL2-TKL1 Low 26 320 18
7 TEF2-TEF1 High 44 0 0 High
8 SSE2-SSE1 Medium 26 252 25
8 SMY2-YPL105C Low 28 504 32
8 YBR177C-YPL095C Low 19 243 27
8 RPS6B-RPS6A High 12 0 0 High
8 SMP1-RLM1 Low 6 74 4
8 YBR183W-YPL087W Low 18 203 9
8 RPS9B-RPS9A High 17 2 2 High
8 RPL21A-RPL21B High 4 14 1 Low
8 YBR197C-YPL077C Low 7 163 10
8 KTR4-KTR6 Low 15 426 9
8 KTR3-KTR6 Low 10 343 11
10 RPS14A-RPS14B High 8 0 0 High
12 ARF2-ARF1 Low 9 19 2
12 RPL35B-RPL35A High 13 1 0 High
12 PPH21-PPH22 Low 87 20 6 High
12 LYS21-LYS20 Low 116 37 3 High
15 BDF2-BDF1 Low 20 482 19
15 RPS29B-RPS29A High 2 8 1 Low
19 PPZ2-PPZ1 Low 29 335 28
19 YDR438W-YML018C Low 15 251 8
19 YDR450W-RPS18B High 1 4 2 Low
19 YDR451C-YOX1 Low 19 240 9
26 RPS26B-RPS26A High 4 12 0 Low
26 PMD1-MDS3 Low 62 935 64
29 YGR221C-YHR149C Low 18 431 20
29 YGR230W-SPO12 Low 6 77 9
29 KEL2-KEL1 Low 36 499 34
29 YAP1802-YAP1801 Low 27 387 20
29 YGR243W-YHR162W Low 4 64 5
29 SOL4-SOL3 Low 16 147 13
29 ENO1-ENO2 High 48 14 7 High
29 GND2-GND1 Medium 20 100 14
30 YGR004W-YLR324W Low 14 365 14
30 STF2-YLR327C Low 2 37 4
30 YGR010W-YLR328W Low 17 175 11
30 RPS25A-RPS25B High 2 3 0 Low
30 ORM1-YLR350W Low 8 109 5
30 BUD9-BUD8 Low 15 210 24
30 YGR043C-TAL1 Medium 13 164 8
30 SCM4-YLR356W Low 6 158 4
30 RSC1-RSC2 Low 26 553 33
30 ROM1-ROM2 Low 54 673 46
30 YGR071C-YLR373C Low 35 671 31
32 YGL139W-YPL221W Low 33 371 26
32 RPL1B-RPL1A High 29 1 0 High
32 PCL10-PCL8 Low 21 324 14
32 YGL133W-YPL216W Low 50 724 50
33 YGL084C-YPL189W Low 35 273 33
33 YGL082W-YPL191C Low 18 217 13
33 RPL7A-RPL7B High 37 5 1 High
33 AFT1-YPL202C Low 9 388 10
33 PUS2-PUS1 Low 19 266 14
34 RPL11B-RPL11A High 30 7 0 High
34 DBF2-DBF20 Low 23 215 18
34 ASK10-YPR115W Low 46 628 44
TABLE 2
(Continued)
Block no. Gene pair CAI C L N C/L
34 CLB1-CLB2 Low 13 100 17
34 CLB6-CLB5 Low 14 220 22
34 RPS23A-RPS23B High 5 0 3 High
34 MEP1-MEP3 Low 16 188 21
34 ASN2-ASN1 Low 45 112 20
34 YGR131W-NCE102 Low 7 95 8
34 YGR136W-YPR154W Low 12 88 8
34 YGR141W-YPR157W Low 26 230 21
34 SKN1-KRE6 Low 43 290 31
35 YHL017W-PTM1 Low 6 176 7
35 YHL012W-UGP1 Low 17 365 8
35 LAG1-YKL008C Low 12 126 15
35 RPL14B-RPL14A High 13 5 0 High
35 YHR001W-YKR003W Low 18 180 24
37 YHR115C-YNL116W Low 25 228 18
37 TOM72-TOM70 Low 25 385 24
37 EPT1-CPT1 Low 15 215 13
37 YHR131C-YNL144C Low 32 477 36
37 YHR133C-YNL156C Low 6 220 9
37 YCK1-YCK2 Low 25 243 22
37 SPS100-YGP1 Medium 12 212 10
37 RPL42B-RPL42A High 3 2 0 High
38 UBP7-UBP11 Low 29 426 28
38 YIL151C-YKR096W Low 57 637 52
38 RPL40A-RPL40B High 0 8 3 Low
39 TPM2-TPM1 Low 5 86 4
39 RPL16A-RPL16B High 5 14 3 Low
39 FKH1-FKH2 Low 23 291 17
39 SIM1-SUN4 Low 5 11 4
39 YIL121W-YNL065W Low 21 390 17
39 YIL120W-YNL065W Low 21 406 19
39 POR2-POR1 Low 17 153 9
39 YIL113W-MSG5 Low 11 100 10
39 COX5B-COX5A Low 9 51 3
39 SEC24-YNL049C Low 41 449 29
39 YIL105C-YNL047C Low 29 373 28
39 PRK1-ARK1 Low 24 336 15
40 RPL17B-RPL17A High 5 14 1 Low
40 HAL5-KKQ8 Low 31 459 32
40 TPK1-TPK3 Low 22 162 13
40 CIS3-PIR3 High 5 99 9
41 YUR1-KTR2 Low 25 212 13
41 TIF2-TIF1 High 58 1 0 High
41 GLG2-GLG1 Low 22 261 20
41 RPS21B-RPS21A High 5 2 5 High
41 LCB3-LBP2 Low 14 133 9
41 MRS3-MRS4 Low 7 140 9
41 TRK1-TRK2 Low 42 456 35
41 NCA3-UTH1 Low 22 147 9
41 YJL112W-CAF4 Low 27 423 18
41 GZF3-DAL80 Low 7 169 7
41 YJL105W-YKR029C Low 15 459 13
41 CHS6-YKR027W Low 22 408 23
41 SAP185-SAP190 Low 46 594 36
41 YJL084C-YKR021W Low 39 623 30
41 YJL083W-IRS4 Low 0 2 0
41 YJL082W-YKR018C Low 32 354 35
44 CNA1-CNA2 Low 25 258 22
44 RPS1A-RPS1B High 5 30 3 Low
44 SIR3-ORC1 Low 30 743 30
TABLE 2
(Continued)
Block no. Gene pair CAI C L N C/L
44 RPL6B-RPL6A High 6 14 3 Low
44 FPR4-FPR3 Low 10 188 15
44 HMG2-HMG1 Low 47 575 41
45 YLR266C-YRR1 Low 38 505 38
45 YLR270W-YOR173W Low 12 179 10
45 BRR5-YOR179C Low 9 90 13
45 RPS30A-RPS30B High 7 0 0 High
45 GSP1-GSP2 Medium 4 47 4
45 EXG1-SPR1 Low 17 197 10
47 YMR222C-YOR280C Low 8 151 13
47 RPS10B-RPS10A High 3 10 0 Low
47 YMR233W-YOR295W Low 11 168 14
47 YMR237W-BUD7 Low 32 342 22
47 RPL20A-RPL20B High 12 10 0 High
47 ZRC1-COT1 Low 14 223 18
47 FAA4-FAA1 Low 51 307 35
48 MMT1-MMT2 Low 16 245 18
48 YMR180C-CET1 Low 14 229 15
48 YMR181C-YPL229W Low 6 120 5
48 RGM1-YPL230W Low 14 117 9
48 SSO2-SSO1 Low 10 119 12
48 YMR192W-YPL249C Low 26 500 24
48 RPL36A-RPL36B High 3 11 1 Low
48 YMR195W-YPL250C Low 6 85 2
48 CIK1-VIK1 Low 21 484 26
48 CLN1-CLN2 Low 12 284 14
49 MCK1-YOL128C Low 15 305 13
49 RPS19B-RPS19A High 8 4 0 High
49 TRF5-TRF4 Low 21 331 22
49 CLA4-SKM1 Low 30 369 25
49 MSB3-MSB4 Low 21 294 25
49 RFC3-RFC4 Low 12 172 7
51 DED1-DBP1 Low 20 291 18
51 YOR222W-YPL134C Low 12 163 4
51 YOR226C-YPL135W Low 5 65 5
51 YOR227W-YPL137C Low 60 707 42
51 YOR229W-UME1 Low 12 322 12
51 WTM1-UME1 Low 15 308 11
51 MKK1-MKK2 Low 28 260 24
51 KIN4-YPL141C Low 27 482 35
51 RPL33B-RPL33A High 2 7 2 Low
51 HES1-KES1 Low 18 197 12
IV:VIII STP1-STP2 Low 24 319 17
IV:VIII RPL27B-RPL27A High 4 19 0 Low
VII:VII TIF4631-TIF4632 Low 35 492 29
VII:VII RPL24B-RPL24A High 15 2 4 High
VII:X RNR4-RNR2 Medium 25 215 3
VII:X BUB1-MAD3 Low 20 351 24
VII:X TDH3-TDH2 High 10 0 7 High
VIII:X RPS4B-RPS4A High 26 1 0 High
TABLE 3
Preferred codons in six species of Saccharomyes
Amino acid S. bayanus S. castelli S. kluyveri S. mikatae S. paradoxus S. cerevisiae
Ile ATC 0.66 ATT 0.51 ATC 0.70 ATC 0.54 ATC 0.56 ATC 0.58
Asn AAC 0.96 AAC 1.00 AAC 1.00 AAC 0.92 AAC 0.93 AAC 0.94
Asp GAC 0.65 GAT 0.50 GAC 0.70 GAC 0.63 GAC 0.66 GAC 0.65
Gln CAA 0.99 CAA 0.98 CAA 1.00 CAA 0.98 CAA 0.99 CAA 1.00
Ala GCT 0.68 GCT 0.69 GCT 0.73 GCT 0.74 GCT 0.78 GCT 0.80
His CAC 0.82 CAC 0.71 CAC 1.00 CAC 0.84 CAC 0.88 CAC 0.90
Thr ACT 0.52 ACC 0.50 ACC 0.60 ACT 0.51 ACC 0.52 ACT 0.50
Tyr TAC 0.91 TAC 0.90 TAC 1.00 TAC 0.85 TAC 0.91 TAC 0.92
Glu GAA 0.97 GAA 0.99 GAA 0.94 GAA 0.95 GAA 0.98 GAA 0.98
Pro CCA 0.91 CCA 0.92 CCA 0.96 CCA 0.90 CCA 0.92 CCA 0.94
Leu TTG 0.83 TTG 0.74 TTG 0.95 TTG 0.80 TTG 0.83 TTG 0.89
Phe TTC 0.84 TTC 0.85 TTC 0.86 TTC 0.84 TTC 0.83 TTC 0.81
Gly GGT 0.94 GGT 0.96 GGT 0.95 GGT 0.96 GGT 0.96 GGT 0.96
Lys AAG 0.88 AAG 0.89 AAG 1.00 AAG 0.84 AAG 0.84 AAG 0.85
Trm TAA 0.90 TAA 1.00 TAA 1.00 TAA 0.62 TAA 0.80 TAA 0.90
Arg AGA 0.84 AGA 0.89 AGA 0.93 AGA 0.88 AGA 0.84 AGA 0.85
Cys TGT 0.86 TGT 0.83 TGT 1.00 TGT 1.00 TGT 1.00 TGT 1.00
Val GTC 0.51 GTT 0.50 GTT 0.52 GTT 0.60 GTT 0.55 GTT 0.55
Ser TCC 0.51 TCT 0.58 TCT 0.56 TCT 0.53 TCT 0.52 TCT 0.50
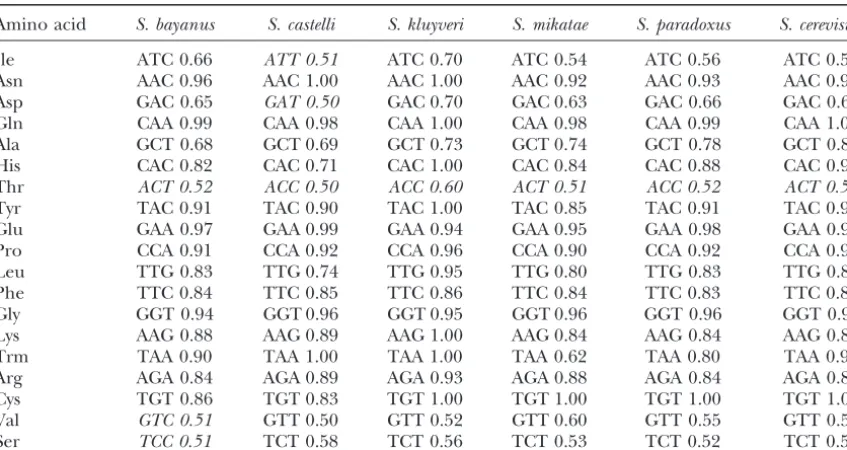
Ten highly expressed genes ofS. cerevisae(RPL11A, ENO1, TDH1, RPL4A, RPL8A, RPL9A, RPL15A, RPS2, RPS3, and RPS5) were selected, and their full-length closest homologs were identified in the other yeasts whenever possible. For each amino acid, the preferred codon and its frequency is listed for each yeast over the 10 selected proteins. Amino acids with only one codon (Met, Trp) are omitted. For most amino acids, all yeasts had the same preferred codon. For Ile, Asp, Thr, Val, and Ser, there were minor differences (indicated by italics). All of these minor differences occur when there are two commonly used codons, each with a frequency of close to 50%. For instance, inS. castelli, the preferred codon for Ile is ATT (frequency of 0.50), but the second-most preferred codon is ATC (frequency of 0.48). Similarly, inS. castelli, the preferred codon for Asp is GAT (frequency 0.50), but the second-most preferred codon is GAC (frequency 0.50). In the case of Thr, only two codons are substantially used, ACT and ACC, and these have nearly an equal frequency in each yeast. Similarly, for Ser, only TCC and TCT are substantially used, each atⵑ0.5 in each yeast.
Counterarguments:We have considered several alter- intra-cerevisiae divergence at high CAI would be ex-plained by the need to maintain preferred codons, while native explanations for the unexpectedly high
conserva-tion between highly expressed S. cerevisiaegene pairs. the presence of interspecies divergence would be ex-plained by highly expressed genes evolving to conform One obvious alternative is that these gene pairs are
not derived from the ancient genome-wide duplication to a different, species-specific codon bias. However, three findings argue against this possibility. First, the event, but instead are the result of a much more recent
chromosomal duplication. This is the case for several preferred codons seem to be the same in each of the six species (Table 3). Second, a substantial proportion duplications found near telomeres, which we do not
consider here. However, it appears not to be the case of the interspecies divergence (at least betweenS. cerevis-iae and S. bayanus) is due to nonsynonymous base for the gene pairs that we consider here, because the
unexpectedly high degree of homology among the gene changes (Table 4), which of course is not explainable by differences in codon bias. Third, this argument does pairs that we are considering ends abruptly at the
boundary of the gene’s open reading frame. The 5⬘and not explain gene families with a high proportion of correction nucleotide substitutions.
3⬘ noncoding regions of these genes do not show a
strikingly high level of conservation. Furthermore, these Patterns and properties of correction:Assuming that the unexpectedly high degree of conservation between genes are typically embedded in syntenic, duplicated
regions, and there are typically poorly expressed, poorly pairs of highly expressed genes does reflect recombina-tional correction, we can draw some inferences about conserved duplicated genes flanking the highly
ex-pressed, highly conserved genes. The exceptional genes the properties of correction. First, correction ends abruptly at the boundaries of identity. This can be seen in block 12,LYS20-LYS21andPPH21-PPH22, could be
a recent duplication. most easily at the beginning and end of each open
reading frame. Within the open reading frame, the per-A second alternative is that the preferred codons are
TABLE 4
Synonymous and nonsynonymous nucleotide changes
Gene Length C-C Syn C-C Non C-B Syn C-B Non C-M Syn C-M Non
eno1 1314 41 27 68 30 40 2
rpl11a 525 14 2 34 4 19 0
rpl1a 654 4 0 31 5 31 0
rps8a 603 11 0 25 7 10 1
tef1 1377 2 0 32 14 19 1
tif51a 474 28 15 30 10 16 6
Six highly expressed genes of S. cerevisiaewere compared to their closest homolog in S. cerevisiae (“C-C” comparisons), in S. bayanus (“C-B” comparisons), or in S. mikatae (“C-M” comparisons). The number of synonymous (“Syn”) and nonsynonymous (“Non”) changes are tabulated.
DISCUSSION outside the open reading frame, identity decays to
essen-tially random levels (data not shown). The same effect For highly expressed gene pairs, within-species diver-can be seen in genes with multiple exons. Although gence is significantly less than between-species diver-identity may be high within each exon, the introns show gence, even though the within-species pairs have had a
roughly random levels of identity. longer time to diverge (Figure 3). Furthermore, for
If correction ends at the end of a tract of high homol- the majority of highly expressed genes, the correction ogy, then the correction of different exons of the same pattern of nucleotide substitution is much more com-gene may be independent events. In this case, the fre- mon than the lineage pattern of substitution, while the quency of correction should be proportional to the opposite is true for poorly expressed genes (Figures 4 length of the exon (since longer exons have an in- and 5; Tables 1 and 2). These observations are very creased chance of interacting with each other). Indeed, difficult to explain by selection alone. We believe that in pairs of genes with multiple exons we have found selection and correction are synergistic with each other that the degree of sequence identity between the first for highly expressed genes; selection for both function exons of a pair of genes can be different from the se- and codon bias tends to minimize the rate of drift, and quence identity between the second exons of the same the resulting high level of sequence identity keeps the pair of genes. Furthermore, longer exons typically have gene pairs eligible for correction, which fully restores higher degrees of identity than shorter exons (although sequence identity between duplicates. There is less
selec-there are exceptions; data not shown). tion in poorly expressed genes, since codon bias is of
Exon length and RNA-DNA correction:If correction little or no importance. In addition, there is less selec-occurs via a cDNA intermediate, then this cDNA can tion in the 5⬘or 3⬘regions of genes or within introns, correct the same gene that originally generated the since many base changes in these regions have little or cDNA, as well as any copy of the gene. Such self-correc- no impact on gene function. Thus, poorly expressed tion would not have any effect on the nucleotide se- genes, 5⬘and 3⬘untranslated regions, and introns drift quence of the open reading frame, since this would be more rapidly and soon diverge to the point where se-identical between the cDNA and the gene. However, quence identity is too low to allow a recombinational on (rare?) occasions when correction proceeded past a interaction. After this point, they are no longer eligible boundary of high sequence identity, it could remove an for correction and continue to drift apart with time. intron from the gene. Indeed, it has been proposed Surprisingly, we found a substantial minority of highly that this kind of self-correction is responsible for remov- expressed genes that have a low C/L ratio, i.e., that ing most of the (presumed) originally existing introns appear not to have corrected in the 20 MY since the from the genome ofS. cerevisiae(Fink 1987). The few split between cerevisiae and bayanus (Table 2). Why introns that remain tend to be at the extreme 5⬘-end should some gene pairs fail to correct? In the context of the gene, suggesting that correction begins, or is of the RNA-DNA correction model, one possibility is
more probable, at the 3⬘-end of the gene. that some genes are more readily reverse transcribed
TABLE 5
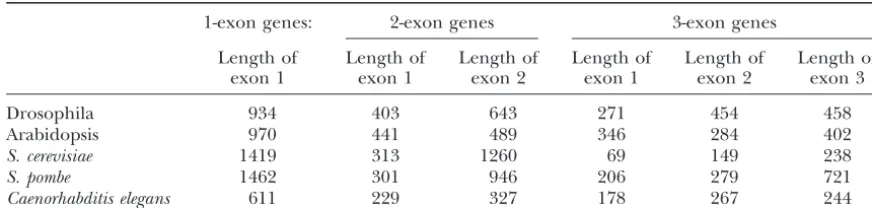
Distribution of exon lengths
1-exon genes: 2-exon genes 3-exon genes
Length of Length of Length of Length of Length of Length of
exon 1 exon 1 exon 2 exon 1 exon 2 exon 3
Drosophila 934 403 643 271 454 458
Arabidopsis 970 441 489 346 284 402
S. cerevisiae 1419 313 1260 69 149 238
S. pombe 1462 301 946 206 279 721
Caenorhabditis elegans 611 229 327 178 267 244
Mean exon lengths for genes of 1, 2, and 3 exons are given.
so packaged. Interestingly, RPS17a, which copurifies reverse-transcribed ribosomal protein pseudogenes in the human genome, showing that the conversion of a with Ty VLPs, is highly similar to its paralog RPS17b,
while PYK1, which has a CAI similar to RPS17a, but transcript to a cDNA is a reasonably common event in humans. Zhang et al. (2002) have also shown the which does not copurify with Ty VLPs, is highly diverged
from its paralog,PYK2. A second possibility is that the existence of a number of duplicate ribosomal protein genes. If any of these duplicates predate the divergence genes that fail to correct are those where the two
para-logs diverged significantly by chance before thecerevis- between,e.g., humans and mice, then analysis of these duplicates, such as we have done here with
Saccharo-iae-bayanus split and, because of the divergence, were
no longer eligible for gene conversion and correction. myces, may show whether these pairs are maintained by correction in mammals.
A third possibility (see below) is that the two copies
have taken on somewhat different cellular roles, and so We note that correction could occur between a highly expressed gene and an unexpressed pseudogene. We both genes are needed.
Correction could occur by a DNA-DNA interaction have preliminary data fromS. cerevisiaesuggesting that, in a few cases, one member of a pair of ribosomal pro-between the two genes of the pair or by a cDNA-DNA
(the RNA-DNA model) interaction occurring after re- tein genes is expressed poorly; possibly such poorly ex-pressed genes are maintained by correction from their verse transcription of an mRNA. Our evidence does not
distinguish these two models. The RNA-DNA model has highly expressed twin. Furthermore, this idea could ex-plain the maintenance of the large number of nonmu-several appealing features. First, it gives a clear
expecta-tion that correcexpecta-tion should be more prevalent for highly tated ribosomal protein pseudogenes that are present in the human genome (Zhanget al.2002).
expressed genes. Second, it is widely believed that
self-correction via a cDNA does occur in S. cerevisiae, and About 90% of the genes originally duplicated in the ancient duplication event have since been deleted, while if self-correction can occur, then correction of a copy
should also occur. Third, it explains why the introns of ⵑ10% remain as duplicates. Why do these 10% remain? Our results and the recent results ofKelliset al.(2004) highly expressed genes are not conserved, whereas a
DNA-DNA interaction between two chromosomal genes allow us to point to two kinds of reasons. First, for poorly expressed genes, one member of the gene pair seems might tend to correct these introns as well as flanking
exons. On the other hand, DNA-DNA events seem to to evolve quickly, gaining many substitutions rapidly and acquiring a new biological role (Kellis et al. 2004). be much more frequent than RNA-DNA events (Derr
andStrathern1993), and so one would expect correc- Thus, for poorly expressed genes, sequence divergence is favorable for maintaining the copy. Second, for highly tion to be dominated by the DNA-DNA mechanism,
even if RNA-DNA events sometimes occurred. expressed genes, we now argue that the duplication aids
in making large amounts of protein in cases where large It is unclear to what extent similar events may occur
in other organisms.S. cerevisiaehas a highly active system amounts of protein are needed. Thus, for highly ex-pressed genes, sequence conservation is favorable for for homologous recombination and thus is especially
suited to correction. However, most other organisms maintaining the copy. Figure 3, b and c, supports this view, because it shows that for poorly expressed genes, also have homologous recombination, and many or
most other eukaryotes contain reverse transcriptases. nonsynonymous substitutions are relatively favored (i.e., promoting divergence of protein function), while for We therefore imagine that correction could occur at
some level in many or most other organisms. Table 5 highly expressed genes, synonymous substitutions are relatively favored (i.e., conserving protein function). shows that 3⬘exons are typically longer than 5⬘exons for
many organisms, and this is consistent with correction. Correction fits into this scheme well, since correction seems to work only on highly expressed genes, which
Futcher, B., G. I. Latter, P. Monardo, C. S. McLaughlinandJ. I.
are precisely the genes where sequence conservation,
Garrels, 1999 A sampling of the yeast proteome. Mol. Cell.
and not divergence, leads to preservation of the copy. It Biol.19:7357–7368.
Kellis, M., N. Patterson, M. Endrizzi, B. BirrenandE. S. Lander,
is interesting to speculate that the rare, highly expressed
2003 Sequencing and comparison of yeast species to identify
genes not showing copy correction are highly expressed
genes and regulatory elements. Nature423:241–254.
genes that have nevertheless evolved to take on new Kellis, M., B. W. BirrenandE. S. Lander, 2004 Proof and
evolu-tionary analysis of ancient genome duplication in the yeast
Sac-cellular roles. It is interesting to note that deletion of
charomyces cerevisiae. Nature428:617–624.
either copy of RPS1a/b (the most extremely diverged
Modrich, P., andR. Lahue, 1996 Mismatch repair in replication
high-bias gene pair) leads to severe growth defects (Sac- fidelity, genetic recombination, and cancer biology. Annu. Rev.
Biochem.65:101–133.
charomyces Genome Database), suggesting that the two
Nei, M., andT. Gojobori, 1986 Simple methods for estimating the
copies may have nonoverlapping roles.
numbers of synonymous and nonsynonymous nucleotide substi-tutions. Mol. Biol. Evol.3:418–426.
This work was sponsored by National Institutes of Health grants
Powell, J. R., andE. N. Moriyama, 1997 Evolution of codon usage
GM39978 and GM648131 to B.F. and National Science Foundation
bias in Drosophila. Proc. Natl. Acad. Sci. USA94:7784–7790. grant EIA0325123 to S.S.
Saxe, D., A. DattaandS. Jinks-Robertson, 2000 Stimulation of
mitotic recombination events by high levels of RNA polymerase II transcription in yeast. Mol. Cell. Biol.20:5404–5414.
Seoighe, C., andK. H. Wolfe, 1999 Updated map of duplicated
LITERATURE CITED
regions in the yeast genome. Gene238:253–261.
Baltimore, D., 1985 Retroviruses and retrotransposons: the role of Sharp, P. M., andW. H. Li, 1987 The codon adaptation index—a
reverse transcription in shaping the eukaryotic genome. Cell40: measure of directional synonymous codon usage bias, and its
481–482. potential applications. Nucleic Acids Res.15:1281–1295.
Chen, W., andS. Jinks-Robertson, 1998 Mismatch repair proteins Wolfe, K. H., andD. C. Shields, 1997 Molecular evidence for
regulate heteroduplex formation during mitotic recombination an ancient duplication of the entire yeast genome. Nature387: in yeast. Mol. Cell. Biol.18:6525–6537. 708–713.
Cliften, P., P. Sudarsanam, A. Desikan, L. Fulton, B. Fultonet al., Xia, X., Z. Xieand W. H. Li, 2003 Effects of GC content and
2003 Finding functional features in Saccharomyces genomes by mutational pressure on the lengths of exons and coding se-phylogenetic footprinting. Science301:71–76. quences. J. Mol. Evol.56:362–370.
Datta, A., M. Hendrix, M. LipsitchandS. Jinks-Robertson, 1997 Xu, H., andJ. D. Boeke, 1990 Localization of sequences required
Dual roles for DNA sequence identity and the mismatch repair in cis for yeast Ty1 element transposition near the long terminal system in the regulation of mitotic crossing-over in yeast. Proc. repeats: analysis of mini-Ty1 elements. Mol. Cell. Biol.10:2695– Natl. Acad. Sci. USA94:9757–9762. 2702.
Derr, L. K., andJ. N. Strathern, 1993 A role for reverse transcripts Zhang, Z., P. HarrisonandM. Gerstein, 2002 Identification and
in gene conversion. Nature361:170–173. analysis of over 2000 ribosomal protein pseudogenes in the
hu-Derr, L. K., J. N. Strathernand D. J. Garfinkel, 1991 RNA- man genome. Genome Res.12:1466–1482.
mediated recombination in S. cerevisiae. Cell67:355–364.