ABSTRACT
MINGCHUN ZHAO. Operating Room Scheduling Analysis and Evaluation. (Under the direction of Dr. Thom J Hodgson and Dr. Javad Taheri.)
This thesis does a series of work using simulation and statistical methods: the reasonable
number of hours to schedule is determined by analyzing overtime using Excel VBA;
schedules are generated based on the reasonable hours scheduled using Arena and evaluated
using Excel VBA.
As a future work, a mathematical method is used to generate a schedule that allows no more
than half hour unused time and half hour overtime for any available scheduled hours kfor
© Copyright 2011 by Mingchun Zhao
Operating Room Scheduling Analysis and Evaluation
by Mingchun Zhao
A thesis submitted to the Graduate Faculty of North Carolina State University
in partial fulfillment of the requirements for the degree of
Master of Science
Industrial Engineering
Raleigh, North Carolina
2011
APPROVED BY:
_______________________________ Tom Reiland
________________________________ ______________________________
Thom J. Hodgson Javad Taheri
DEDICATION
I would like to dedicate this Master Thesis to my Mother, Liping Hou and my father, Xiaojin
Zhao. There is no doubt in my mind that without their continued support and counsel I could
BIOGRAPHY
I was born in Xi’an Shaanxi, China. I am the only child in my family so my parents focus on
me a lot.
I went to Zhejiang University in 2006, studied Control Engineering, and I came to NC State
University in 2009 in 3+X program, and studied Industrial Engineering.
I started doing this project with Dr. Hodgson and Dr. Taheri since January 2010, it has been 2
ACKNOWLEDGMENTS
I would like to acknowledge the advice and guidance of Dr. Hodgson and Dr Taheri, my
committee co-chairs.
I thank the member of my graduate committee for his guidance and suggestions.
I also thank my friend, Michelle Glatz for all her encouragement, advice for my research, and
help for revising my writing.
I acknowledge the Durham Veterans Administration Medical Center for their data support for
this project.
I would like to thank my family members, especially my mother, Liping Hou and father,
TABLE OF CONTENTS
LIST OF TABLES ... viii
LIST OF FIGURES ... ⅹ Chapter 1 Introduction ... 1
Durham Veterans Administration Medical Center ... 1
Process Description ... 1
Service Description ... 2
Project Description ... 4
Objective ... 5
Chapter 2 Literature Review ... 6
General ... 6
Computer Simulation Modeling ... 6
Scheduling... 7
Chapter 3 Reasonable Scheduled Hours ... 9
Introduction ... 9
Part 1 Generate schedules for four hours to ten hours a day ... 11
CPT code Frequency ... 11
Procedure Time and Turnover Time ... 13
Schedules from 4hrs to 10hrs ... 14
Turnover Time ... 15
Procedure Time ... 15
Flowchart of the Evaluation ... 16
The Results of Evaluation with 10 replications ... 19
The Results of Evaluation with the half-width confidence interval less than or equal to 15% of the average over time ... 36
Number of procedures in each time block for each Procedure type ... 56
Chapter 4 Simulation by Arena and Excel VBA ... 58
Introduction ... 58
Part 1 Schedule Creation ... 58
Flowchart ... 58
Schedule Generated ... 60
Part 2 Evaluation of the schedule generated above ... 61
Turnover Time ... 61
Procedure Time ... 62
Flowchart of simulation ... 63
Suggestion ... 87
Chapter 5 Future Work
--A Mathematical --Approach to Scheduling Operating Rooms ... 88
REFERENCES ... 91
LIST OF TABLES
Table 1.1 Time block Schedule for March 2010 ... 4
Table 3.1 Frequencies of each plastic surgery CPT code ... 11
Table 3.2 Average Procedure and Turnover Times for each CPT code ... 13
Table 3.3 An example of schedule generated from four hours to ten hours ... 14
Table 3.4 10 Percentile and 20 Percentile of the Time Gap between Two Procedures ... 15
Table 3.5 Partial list of the historical data for each CPT code for Plastic Surgery ... 16
Table 3.6 Overtime for an Eight Hour OR for Plastic with 10 rep ... 20
Table 3.7 Overtime for a Ten Hour OR for Plastic with 10 rep ... 21
Table 3.8 Overtime for an Eight Hour OR for Ortho with 10 rep ... 22
Table 3.9 Overtime for a Ten Hour OR for Ortho with 10 rep ... 23
Table 3.10 Overtime for an Eight Hour OR for General with 10 rep ... 24
Table 3.11 Overtime for a Ten Hour OR for General with 10 rep ... 25
Table 3.12 Overtime for an Eight Hour OR for Vascular with 10 rep ... 26
Table 3.13 Overtime for a ten Hour OR for Vascular with 10 rep ... 27
Table 3.14 Overtime for an Eight Hour OR for Urology with 10 rep ... 28
Table 3.15 Overtime for a ten Hour OR for Urology with 10 rep ... 29
Table 3.16 Overtime for an Eight Hour OR for Neurology with 10 rep ... 31
Table 3.17 Overtime for a ten Hour OR for Neurology with 10 rep ... 32
Table 3.18 Overtime for an Eight Hour OR for OHNS with 10 rep ... 33
Table 3.20 Overtime for an Eight Hour OR for Thoracic with 10 rep ... 35
Table 3.21 Overtime for a ten Hour OR for Thoracic with 10 rep ... 36
Table 3.22 Overtime for an Eight Hour OR for Plastic with 200 rep ... 38
Table 3.23 Overtime for a Ten Hour OR for Plastic with 200 rep ... 39
Table 3.24 Overtime for an Eight Hour OR for Ortho with 240 rep ... 40
Table 3.25 Overtime for a Ten Hour OR for Ortho ... 41
Table 3.26 Overtime for an Eight Hour OR for General with 370 replications ... 42
Table 3.27 Overtime for a Ten Hour OR for General ... 43
Table 3.28 Overtime for an Eight Hour OR for Vascular with 220 replications ... 45
Table 3.29 Overtime for Ten Hour OR for Vascular with 220 replications ... 46
Table 3.30 Overtime for an Eight Hour OR for Urology with 200 replications with 200 replications ... 47
Table 3.31 Overtime for Ten Hour OR for Urology ... 48
Table 3.32 Overtime for an Eight Hour OR for Neurology with 200 replications ... 49
Table 3.33 Overtime for a Ten Hour OR for Neurology with 200 replications ... 51
Table 3.34 Overtime for an Eight Hour OR for OHNS with 180 replications ... 52
Table 3.35 Overtime for a Ten Hour OR for OHNS with 180 replications ... 53
Table 3.36 Overtime for an Eight Hour OR for Thoracic with 250 replications ... 54
Table 3.37 Overtime for Ten Hour OR for Thoracic ... 55
Table 3.38 Reasonable Scheduled hours for 8 hour and 10 hour ORs ... 56
Table 3.40 Number of Procedures can be scheduled for each block and Actual Block Number
... 57
Table 4.1 An example of schedule generated ... 61
Table 4.2 10 Percentile and 20 Percentile of the Time Gap between Two Procedures ... 62
Table 4.3 An example of the ordered historical data for procedure time of each type of procedure ... 62
Table 4.4 Data collected during the simulation ... 65
Table 4.5 General result of the simulation ... 65
LIST OF FIGURES
Figure 1.1 The Process of Patients having procedures ... 1
Figure 3.1 Flowchart of generating schedule for four to ten hours a day ... 12
Figure 3.2 Flowchart of the evaluation for schedule for Eight Hour OR ... 17
Figure 3.3 Projected Monthly Overtime for 8 hour OR with 95% confidence interval for
Plastic with 10 reps ... 19
Figure 3.4 Projected Monthly Overtime for 10 hour OR with 95% confidence interval for
Plastic with 10 reps ... 20
Figure 3.5 Projected Monthly Overtime for 8 hour OR with 95% confidence interval for
Ortho with 10 rep ... 21
Figure 3.6 Projected Monthly Overtime for 10 hour OR with 95% confidence interval for
Orthowith 10 rep ... 22
Figure 3.7 Projected Monthly Overtime for 8 hour OR with 95% confidence interval for
General with 10 reps ... 24
Figure 3.8 Projected Monthly Overtime for 10 hour OR with 95% confidence interval for
General with 10 reps ... 24
Figure 3.9 Projected Monthly Overtime for 8 hour OR with 95% confidence interval for
Vascular with 10 rep ... 26
Figure 3.10 Projected Monthly Overtime for 10 hour OR with confidence interval for
Figure 3.11 Projected Monthly Overtime for 8 hour OR with 95% confidence interval for
Urology with 10 reps ... 28
Figure 3.12 Projected Monthly Overtime for 10 hour OR with 95% confidence interval for
Urology with 10 reps ... 29
Figure 3.13 Projected Monthly Overtime for 8 hour OR with 95% confidence interval for
Neurology with 10 reps ... 30
Figure 3.14 Projected Monthly Overtime for 10 hour OR with 95% confidence interval for
Neurology with 10 reps ... 31
Figure 3.15 Projected Monthly Overtime for 8 hour OR with 95% confidence interval for
OHNS with 10 reps ... 32
Figure 3.16 Projected Monthly Overtime for 10 hour OR with confidence interval for OHNS
with 10 rep ... 33
Figure 3.17 Projected Monthly Overtime for 8 hour OR with confidence interval for Thoracic
with 10 rep ... 35
Figure 3.18 Projected Monthly Overtime for 10 hour OR with confidence interval for
Thoracic with 10 rep ... 36
Figure 3.19 Projected Monthly Overtime for 8 hour OR with 95% confidence interval for
Plastic with 200 rep ... 37
Figure 3.20 Projected Monthly Overtime for 10 hour OR with 95% confidence interval for
Plastic with 200 reps ... 38
Figure 3.21 Projected Monthly Overtime for 8 hour OR with 95% confidence interval for
Figure 3.22 Projected Monthly Overtime for 10 hour OR with 95% confidence interval for
Orthopedics with 240 rep ... 40
Figure 3.23 Projected Monthly Overtime for 8 hour OR with 95% confidence interval for
General with 370 reps ... 42
Figure 3.24 Projected Monthly Overtime for 10 hour OR with 95% confidence interval for
General with 370 reps ... 43
Figure 3.25 Projected Monthly Overtime for 8 hour OR with 95% confidence interval for
Vascular with 220 reps ... 44
Figure 3.26 Projected Monthly Overtime for 10 hour OR with confidence interval for
Vascular with 220 replications ... 45
Figure 3.27 Projected Monthly Overtime for 8 hour OR with 95% confidence interval for
Urology with 200 reps ... 46
Figure 3.28 Projected Monthly Overtime for 10 hour OR with 95% confidence interval for
Urology with 200 replications ... 47
Figure 3.29 Projected Monthly Overtime for 8 hour OR with 95% confidence interval for
Neurology with 200 replications ... 49
Figure 3.30 Projected Monthly Overtime for 10 hour OR with 95% confidence interval for
Neurology with 200 reps ... 50
Figure 3.31 Projected Monthly Overtime for 8 hour OR with 95% confidence interval for
OHNS with 180 reps ... 51
Figure 3.32 Projected Monthly Overtime for 10 hour OR with confidence interval for OHNS
Figure 3.33 Projected Monthly Overtime for 8 hour OR with confidence interval for Thoracic
with 250 replications ... 54
Figure 3.34 Projected Monthly Overtime for 10 hour OR with confidence interval for Thoracic ... 55
Figure 4.1 Flowchart of creating schedules by Arena ... 59
Figure 4.2 Flowchart of the Evaluation ... 63
Figure 4.3 Scheduled total work hours for 7 operating rooms for 23 work days ... 66
Figure 4.4 Average Utilization with 95% confidence interval for OR1 in 23 work days ... 67
Figure 4.5 Average Utilization with 95% confidence interval for OR2 in 23 work days ... 68
Figure 4.6 Average Utilization with 95% confidence interval for OR3 in 23 work days ... 68
Figure 4.7 Average Utilization with 95% confidence interval for OR4 in 23 work days ... 69
Figure 4.8 Average Utilization with 95% confidence interval for OR5 in 23 work days ... 69
Figure 4.9 Average Utilization with 95% confidence interval for OR6 in 23 work days ... 70
Figure 4.10 Average Utilization with 95% confidence interval for OR7 in 23 work days .... 70
Figure 4.11 Average Utilization with 95% confidence interval for Type 1 in 23 work days . 71
Figure 4.12 Average Utilization with 95% confidence interval for Type 2 in 23 work days . 71
Figure 4.13 Average Utilization with 95% confidence interval for Type 3 in 23 work days . 72
Figure 4.14 Average Utilization with 95% confidence interval for Type 4 in 23 work days . 73
Figure 4.15 Average Utilization with 95% confidence interval for Type 5 in 23 work days . 73
Figure 4.16 Average Utilization with 95% confidence interval for Type 6 in 23 work days . 74
Figure 4.17 Average Utilization with 95% confidence interval for Type 7 in 23 work days . 75
Figure 4.19 Average Utilization with 95% confidence interval for OR1 in 23 work days
140replications ... 76
Figure 4.20 Average Utilization with 95% confidence interval for OR2 in 23 work days for
140replications ... 77
Figure 4.21 Average Utilization with 95% confidence interval for OR3 in 23 work days for
140replications ... 78
Figure 4.22 Average Utilization with 95% confidence interval for OR4 in 23 work days for
140replications ... 78
Figure 4.23 Average Utilization with 95% confidence interval for OR5 in 23 work days for
140replications ... 79
Figure 4.24 Average Utilization with 95% confidence interval for OR6 in 23 work days for
140replications ... 80
Figure 4.25 Average Utilization with 95% confidence interval for OR7 in 23 work days for
140replications ... 80
Figure 4.26 Average Utilization with 95% confidence interval for Type 1 in 23 work days for
140replications ... 81
Figure 4.27 Average Utilization with 95% confidence interval for Type 2 in 23 work days for
140replications ... 82
Figure 4.28 Average Utilization with 95% confidence interval for Type 3 in 23 work days for
140replications ... 82
Figure 4.29 Average Utilization with 95% confidence interval for Type 4 in 23 work days for
Figure 4.30 Average Utilization with 95% confidence interval for Type 5 in 23 work days for
140replications ... 84
Figure 4.31 Average Utilization with 95% confidence interval for Type 6 in 23 work days for
140replications ... 85
Figure 4.32 Average Utilization with 95% confidence interval for Type 7 in 23 work days for
140replications ... 86
Figure 4.33 Average Utilization with 95% confidence interval for Type 8 in 23 work days for
140replications ... 87
Figure 5.1 Equations to determine the total number of procedures for each CPT code ... 89
Chapter 1
Introduction
Durham Veterans Administration Medical Center
The Durham Veterans Administration (VA) Medical Center serves veterans in central and
eastern North Carolina in its main medical center or one of its three community-based
outpatient clinics. Since 1953, VAMC Durham has been improving the health of the men and
women who have so proudly served their nation. The VA considers it their privilege to serve
the health care needs of veterans in any way they can. Services are available to more than
200,000 veterans living in the 26-county area of central and eastern North Carolina.
Because of the large demand for surgical services, the VA Medical Center is trying to
increase the utilization in their operating rooms (OR), and this thesis provides technical
support for the VA to serve the veterans better.
Process Description
Procedure
in OR PACU ICU Ward Go Home
A typical surgical patient undergoes several preoperative activities such as physical
examination, anesthesia, etc. Once these are completed the surgical procedure is performed.
The total elapsed time for this process is called procedure time. After the surgical procedure
is completed, the patient is sent to the Post Anesthesia Care Unit (PACU). Once the
anesthesia effects have dissipated, the patient may be sent either to the Intensive Care Unit
(ICU) until stabilized, directly to the wards, or they may be discharged from the hospital.
When the OR is free, it is cleaned and set up with equipment to prepare for the next
procedure. This cleanup and preparation work is called “turnover”, the time elapsed is called
turnover time. In this whole process, surgical procedure duration and turnover time are both
uncertain. This increases the difficulty of scheduling the system.
There is no direct data for turnover time; the time between procedures includes two parts:
turnover time and idle time. Idle time is the time between when the staff finishes cleaning up
the OR and setting up the equipment to prepare for the next procedure and the arrival of the
patient for the next procedure. This thesis uses the 10 percentile and 20 percentile of the time
gap as turnover time.
This thesis focuses on the process in ORs, which includes turnover time and procedure time;
the processing time in PACU, ICU or wards is not taken into consideration.
Service Description
There are two kinds of procedures: emergency procedures and elective procedures. This
procedures can be categorized into fourteen different service types: Cardiac, General,
Gynecology, Neurology, Neonatal (NSU), Head and Neck Surgery (OHNS), Ophthalmology,
Oral, Orthopedics, Plastic, Podiatry, Thoracic, Urology and Vascular. Each of them has their
own set of the Current Procedural Terminology (CPT) codes to clarify the specific
procedures within each service.
This thesis only focuses on the eight service types which have the most historical CPT code
data available. They are Plastic, Ortho, OHNS, Thoracic, Vascular, General, Urology and
Neurology.
There are seven active ORs in the hospital. The standard operating hours are Monday
through Friday from 8:00am to 6:00pm for OR1 and OR2 and from 8:00am to 4:00pm for
OR3 through OR7. The service type for each schedule block (a combination of date and
room, e.g. March. 5th in OR 1) is predetermined according to a “Time Block Schedule” set
by the hospital management.
The March 2010 time block schedule is used in this thesis and it is shown in Table 1.1. The
Table 1.1 Time block Schedule for March 2010
OR 3/1/2010 3/2/2010 3/3/2010 3/4/2010 3/5/2010 3/8/2010 3/9/2010 3/10/2010 3/11/2010 3/12/2010 3/15/2010 3/16/2010 1 Urology OHN General Ortho Vascular Vascular General Neuro Thoracic Ortho 2 Thoracic Ortho Neuro OHN Neuro Plastic Plastic OHN Ortho Neuro General Ortho
3 Urology
4 Vascular OHN Neuro Urology Vascular Neuro Vascular Vascular 5 Plastic Neuro Plastic Ortho General Ortho Urology Ortho Plastic 6 General Ortho Ortho Ortho Urology General Ortho Thoracic Ortho Urology Urology OHN 7 Vascular Vascular General General Vascular OHN General OHN General Plastic Neuro
OR 3/17/2010 3/18/2010 3/19/2010 3/22/2010 3/23/2010 3/24/2010 3/25/2010 3/26/2010 3/29/2010 3/30/2010 3/31/2010
1 General Ortho Urology Urology OHN General Ortho General General Vascular General
2 Ortho Vascular General Ortho Neuro OHN Neuro Plastic Ortho OHN
3 General Urology
4 OHN Ortho Ortho Vascular OHN Neuro Urology OHN Neuro
5 Plastic Plastic Vascular Ortho Ortho Ortho Urology
6 Neuro Neuro Neuro Thoracic Ortho Urology Thoracic Plastic Thoracic
7 Urology OHN General General Urology Ortho Urology Vascular General
Project Description
This thesis uses the historical data from August 2009 to February 2010 to determine the
average procedure and turnover times for each service type. Using these times, schedules
comprising from four to ten hours were developed for each service type. The reasonable
number of hours to schedule is determined by evaluating the schedules using the empirical
data and calculating the projected overtime.
Then based on the average procedure and turnover times, the reasonable number of hours to
schedule, and the time block schedule, Arena is used to create a schedule for March 2010.
The schedule is analyzed using VBA and conclusions and recommendations are made based
Objective
The objective is to determine how to increase utilization of the operating rooms while
Chapter 2
Literature Review
General
Operating rooms, which have received increasing attention over the years, are one of the
most important facilities in a hospital. There are many references in the operations research
and health care literature relevant to many different areas of operating room planning and
scheduling. They range from patients to surgeons, elective to non-elective surgeries,
theoretical to real data analysis, waiting time to facility utilization, and from isolated
operating rooms to integrated operating rooms. There have been many different types and
levels of analyses conducted of these operating room issues.
Computer Simulation Modeling
There are many possibilities for simulating an operating room, this thesis uses Arena and
excel VBA. There are many references about this topic.
R. Davies and H. T. O. Davies (1994), analyze different patient flow models using different
simulation methods. They discuss process improvement and create a common understanding
about the health service planning problem and explore alternative solutions in an interactive
way. Discrete Markov and semi-Markov models are realistic and, once programmed, the
models can be tested and run extremely quickly, but this approach is hard to use due to the
Baumgart et al., (2007) use Arena to simulate operating rooms in different stages of the
business process management (BPM) lifecycle to provide decision support during the process
of optimizing the efficiency of operating rooms. They consider ex ante, in progress and ex
post at the same time in simulation. They first use Arena to do the ex post simulation
according to the historical data to get optimal strategies, then use those strategies to simulate
the following progress, which is ax ante simulation—experimental study. However, the “in
process” part is still a work in process as there are some limitations due to the current level of
technology.
J.E. Everett (2002) uses a Graphical-user interface simulation model. The simulation model
was constructed using the graphical user interface package Extend™. The patients are
divided into different types according to their treatment types and urgency levels, and then
they are added to a waiting list. The simulation model can be used as an operational tool to
match hospital availability and patient need. It can also be used to report on the performance
of the system, and as a planning tool to compare the effectiveness of alternative policies in
this multi-criteria decision environment.
Scheduling
Much of the surveyed research work only focuses on the OR itself, which is the case in this
thesis. Dexter et al., (1999) studied block time allocation for surgeons using simulation and a
patient survey. Various block scheduling methods were evaluated and it was shown that
based on expected total hours of elective cases, scheduling patients into the first available
date provided open block time is available within 4 weeks, and otherwise scheduling patients
in "overflow" time outside of the block time.
Dexter and Traub, (2002) tested two strategies for scheduling a new case into an OR, the
Earliest Start Time and the Latest Start Time, on the efficiency of use of an OR. It was
shown in several scenarios that Earliest Start Time performed substantially better when the
objective was to minimize overutilization, while Latest Start Time would perform better at
balancing workload among services’ OR time. The simulation using historical data was used
to show that these two heuristics are robust.
There are a number of stochastic optimization models for OR scheduling:
Denton and Gupta, (2002) studied a single OR scheduling problem with the objective of
minimizing the total expected cost of customer waiting time, server idle time, and tardiness
with respect to the session length. They developed a modified L-shaped algorithm based on
derived upper and lower bounds on the cost that are independent of procedure duration type.
Denton et al., (2006) described a stochastic optimization model and some practical heuristics
Chapter 3
Reasonable Scheduled Hours
Introduction
In this chapter, Excel VBA is used to create and analyze schedules in order to determine the
target number of hours to schedule per day for each service type. The analysis is based on
the actual procedure duration data obtained from the hospital for August 2009 to February
2010. The goal is to minimize overtime and maximize utilization. A schedule is generated
based on average procedure time and then simulated using the actual data distribution to
calculate the expected overtime. Seven schedules are generated for each service type, one
each for four, five, six, seven, eight, nine, and ten scheduled hours per day. For each service
type, the schedule that has expected overtime at the desired level is used to choose the
number of hours that should be scheduled per day for that service type.
There are two parts of the analysis:
1) Generate 7 separate monthly schedules, consisting of 23 work days, for each service
type. Every day of a schedule will contain the same total number of scheduled hours. There
will be one schedule each for four, five, six, seven, eight, nine, and ten scheduled hours per
day. The schedules will be generated using the average procedure and turnover times for
each CPT code.
2) Evaluate the schedules by projecting the cumulated expected overtime for the entire
are run first, then the number of replications for each service type needed for the half-width
of the confidence interval to be less than or equal to 15% of the average projected overtime is
estimated using the formula 1 0* ( 10 )2
*15% Halfwidth of the CI of rep
Average . The reasonable number of hours to
schedule each day for each service type is chosen based on an acceptable level of overtime.
We use the average projected monthly overtime plus 95% confidence interval to be no more
Part 1 Generate schedules for four hours to ten hours a day
CPT code Frequency
Table 3.1 lists the frequency of each CPT code for plastic surgery. The first column is the
index for each CPT code, the third column shows the number of procedures performed for
each CPT code according to the historical data, and the fourth column shows the probability
of occurrence for each of the plastic surgery CPT codes.
The VBA code will generate random numbers from 0 to 1 to choose the CPT codes to be
scheduled according to the number in the ‘RN’ column.
Table 3.1 Frequencies of each plastic surgery CPT code
Index CPT Code Count PROB RN
1 11422 20 0.246914 0.24691358
2 11402 10 0.123457 0.37037037
3 11423 9 0.111111 0.481481481
4 11404 8 0.098765 0.580246914
5 11421 7 0.08642 0.666666667
6 11403 7 0.08642 0.75308642
7 11406 6 0.074074 0.827160494
8 15820 4 0.049383 0.87654321
9 11441 4 0.049383 0.925925926
10 11440 3 0.037037 0.962962963
Analysis Flowchart
TimeAvailable(k) = TimeAvailable(k) - OperationTime - TurnoverTime
TimeAvailable(k) = 60*k NumberofProcedures = 0
TimeAvaila ble(k) > 30 Totalprocedures(k) =
Totalprocedures(k) + 1 NumberofProcedures = NumberofProcedures + 1
TimeAvailable(k) = 60 * k; Clean the schedule for current day Totalprocedures(k) = Totalprocedures(k) -
NumberofProcedures NumberofProcedures = 0
TimeAvailable(k) < 30 And TimeAvailable(k)
> -30
No NumberofProcedures = NumberofProcedures + 1Totalprocedures(k) = Totalprocedures(k) + 1 TimeAvailable(k) = 60 * k CurrentDay(k) = CurrentDay(k) + 1
NumberofProcedures = 0 Yes K=4 CurrentDay(k) <= 20 End K<=10 K=k+1 Yes yes
CurrentDay(k) = 1
NO
No Get average
Procedure time and turnover time
according to the CPT code • K is the time (in hours) that actually be
scheduled
• Count(CPT) is the number of procedures have been done in the past for that CPT code
Yes
Clear the schedule for K
hours No Generate random numbers (0,1)
Get CPT code
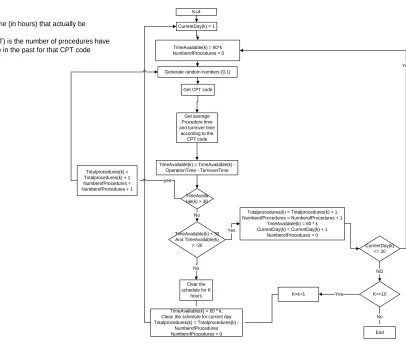
Figure 3.1 Flowchart of generating schedule for four to ten hours a day
Figure 3.1 show the flowchart for generating schedules for four to ten hours a day, the steps
are:
1) Initialize the daily number of hours to be scheduled, k, to 4 and the current day to 1.
2) Initialize TimeAvailable to the number of hours to be scheduled (k) and all other
parameters to zero.
3) Generate a random number from 0 to 1 to pick a CPT code.
5) Subtract the procedure plus turnover times from TimeAvailable. Check TimeAvailable:
a) If it is larger than 0.5 hours, add the procedure to the schedule and return to step 3.
b) If it is less than 0.5 hours and greater than -0.5 hours, add the procedure to the
schedule and increment day. If day is greater than 20, go to step 6. Otherwise, return
to step 2.
c) If it is less than -0.5 hours, clear the schedule for the current day and return to step 2.
6) Increase the time to be scheduled (k) by one hour, if ‘k’ is greater than 10 hours STOP.
Otherwise return to step 2.
The reasonable number of hours to schedule in a day must be determined for each of the
eight service types separately. For simplicity, the details are only shown for one service type.
The same method is used for the other service types as well.
Procedure Time and Turnover Time
The procedure time and turnover time used in this part are both average times, they are
constant number for each CPT code, as shown in Table 3.2 below. (In minutes)
Table 3.2 Average Procedure and Turnover Times for each CPT code
CPT code 11422 11402 11423 11404 11421 11403 11406 15820 11441 11440 11424
Procedure 56.5 37.4 92.22222 117.75 49.14286 77.14286 74.5 184.2727 37.5 53 63.5
Schedules from 4hrs to 10hrs
An example of a portion of the seven schedules generated for plastic surgery is shown in
Table 3.3. These schedules were generated using the average procedure and turnover time
given in Table 3.2. The CPT code numbers are the index numbers from Table 3.1.
There are two columns for each schedule, the first column is the date scheduled, and the
second column is the CPT code index number. The title of the schedule specifies the number
of hours scheduled each day in the schedule.
*The VBA Code for this process can be found in Appendix A.
Table 3.3 An example of schedule generated from four hours to ten hours
4h 5h 6h 7h 8h 9h 10h
Day CPT Day CPT Day CPT Day CPT Day CPT Day CPT Day CPT
1 9 1 6 1 6 1 8 1 5 1 6 1 4
1 9 1 8 1 1 1 1 1 9 1 4 1 9
1 9 2 6 1 3 1 2 1 10 1 4 1 5
1 5 2 8 1 1 1 11 1 1 1 2 1 9
2 9 3 6 2 9 2 1 1 4 1 3 1 9
2 2 3 8 2 1 2 2 1 5 2 2 1 3
2 9 4 8 2 1 2 6 2 1 2 11 1 3
2 5 4 6 2 2 2 1 2 1 2 9 2 1
3 2 5 3 2 7 2 9 2 11 2 1 2 1
3 5 5 7 3 1 2 9 2 2 2 6 2 3
Part 2 Schedule Evaluation
Turnover Time
There is no direct data for turnover time; the time between procedures includes two parts:
turnover time and idle time. Idle time is the time between when the staff finishes cleaning up
the OR and setting up the equipment to prepare for the next procedure and the arrival of the
patient for the next procedure. Table 3.4 shows 10 percentile and 20 percentile of the time
gap. This range will be used as a reasonable estimate of the actual turnover time. The VBA
code in the simulation will generate random number from 0 to 1 to get the random turnover
time from the table shown below.
Table 3.4 10 Percentile and 20 Percentile of the Time Gap between Two Procedures
CPT code 11422 11402 11423 11404 11421 11403 11406 15820 11441 11440 11424
10 percentile 18 18 18 18 18 18 18 18 18 18 18
20 percentile 21 21 21 21 21 21 21 21 21 21 21
Procedure Time
Table 3.5 below shows an example of the historical data for each CPT code with outliers
removed (only one to two per CPT code). It is based on the data from August 2009 to
February 2010. The procedure duration (in minutes) is shown for each procedure preformed.
The number of values in each column is the number of procedures with the corresponding
CPT code that were performed during the time period being studied. For example, the last
column shows that two procedures with CPT code 11424 were performed from August 2009
Table 3.5 Partial list of the historical data for each CPT code for Plastic Surgery
CPT code 11422 11402 11423 11404 11421 11403 11406 15820 11441 11440 11424
35 14 22 35 25 45 30 115 32 48 53
Procedure 36 23 45 64 35 67 75 193 35 50 74
Time 36 26 60 65 40 76 80 261 40 61
(minute) 38 31 72 82 45 80 82 43
38 34 97 147 51 82 87
38 35 104 165 73 95 93
41 40 115 185 75 95
Flowchart of the Evaluation
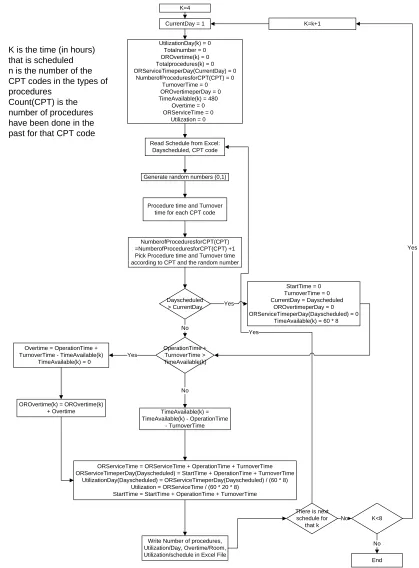
Figure 3.2 below shows the flowchart of the evaluation of schedules for ORs that are open
for eight operating hours. The same method is used for ORs that are open for ten operating
hours; the only difference is the initialization of the TimeAvailable variable and the
maximum value of ‘k’ to 10 (hours) instead of 8 - to initialize TimeAvailabe to 10 hours and
Procedure time and Turnover time for each CPT code
NumberofProceduresforCPT(CPT) =NumberofProceduresforCPT(CPT) +1 Pick Procedure time and Turnover time according to CPT and the random number
Generate random numbers (0,1) K=4
CurrentDay = 1
UtilizationDay(k) = 0 Totalnumber = 0 OROvertime(k) = 0 Totalprocedures(k) = 0 ORServiceTimeperDay(CurrentDay) = 0
NumberofProceduresforCPT(CPT) = 0 TurnoverTime = 0 OROvertimeperDay = 0
TimeAvailable(k) = 480 Overtime = 0 ORServiceTime = 0
Utilization = 0
• K is the time (in hours) that is scheduled • n is the number of the
CPT codes in the types of procedures
• Count(CPT) is the number of procedures have been done in the past for that CPT code
Read Schedule from Excel: Dayscheduled, CPT code
StartTime = 0 TurnoverTime = 0 CurrentDay = Dayscheduled
OROvertimeperDay = 0 ORServiceTimeperDay(Dayscheduled) = 0
TimeAvailable(k) = 60 * 8 Dayscheduled
> CurrentDay Yes
OperationTime + TurnoverTime > TimeAvailable(k)
No
Overtime = OperationTime + TurnoverTime - TimeAvailable(k)
TimeAvailable(k) = 0
TimeAvailable(k) = TimeAvailable(k) - OperationTime
- TurnoverTime No Yes
ORServiceTime = ORServiceTime + OperationTime + TurnoverTime ORServiceTimeperDay(Dayscheduled) = StartTime + OperationTime + TurnoverTime
UtilizationDay(Dayscheduled) = ORServiceTimeperDay(Dayscheduled) / (60 * 8) Utilization = ORServiceTime / (60 * 20 * 8)
StartTime = StartTime + OperationTime + TurnoverTime
Write Number of procedures, Utilization/Day, Overtime/Room, Utilization/schedule in Excel File
K=k+1
There is next schedule for that k End K<8 No Yes No OROvertime(k) = OROvertime(k)
+ Overtime
Yes
Figure 3.2 shows the flowchart of the schedule evaluation for an eight hour OR, the steps are:
1) Set k to 4.
2) Set CurrentDay to day one, set all other variables to zero.
3) Read the date scheduled of procedure and the CPT code from the schedule shown in
Table 3.3 for ‘k’ hours.
4) Set TimeAvailable to eight hours.
5) Generate a random number from 0 to 1 and pick the procedure time and turnover time
for the CPT code using the random number generated and the empirical data
distribution.
6) If it is the first procedure in that room for that day, set the turnover time equal to 0; if
not, use the turnover time generated in step 5. If a procedure ends results in overtime,
calculate the overtime.
7) If the end of the schedule has not been reached: Read the information for next
procedure, if the day scheduled is the current day, then set the TimeAvailable to the
CurrentTimeAvailable minus the turnover time and procedure time of the current
procedure and return to step 5; if the date scheduled is not the current processing date,
then set the current day to the date scheduled. Then go back to the fourth step.
8) Set k to k+1, if k is less than or equal to 8 return to step 2.
Ten replications are run first, then an estimate of the number of replications needed for each
the average projected overtime is calculated according to the formula
2 10
1 0* ( )
*15%
Halfwidth of the CI of rep Average .
*The VBA Code for this process can be found in Appendix B.
The Results of Evaluation with 10 replications
The results of evaluation using 10 replications for each service type are shown below.
Plastic Surgery (Type 1)
Figure 3.3 shows the projected monthly overtime with 95% confidence interval for an 8 hour
OR used for Plastic Surgery (Type 1). We can see that there is no over-time until 7 hours are
scheduled in an eight hour OR.
Figure 3.3 Projected Monthly Overtime for 8 hour OR with 95% confidence interval for Plastic with 10 reps
Table 3.6 below shows the average overtime and the lower and upper 95% confidence limits
of the schedule (in minutes). We calculate that about 78 replications are needed for the 95% 0
100 200 300
1h 2h 3h 4h 5h 6h 7h 8h
Projected Overtime
(min)
Hours Scheduled
confidence interval half-width to be less than or equal to 15% of the average projected
overtime for every schedule for plastic surgery for an eight hour OR.
Table 3.6 Overtime for an Eight Hour OR for Plastic with 10 rep
OR8h
Upper Lower Average
1h 0 0 0
2h 0 0 0
3h 0 0 0
4h 0 0 0
5h 0 0 0
6h 0 0 0
7h 30.1083 3.04048 16.57439
8h 200.9032 137.6165 169.2599
Figure 3.4 shows the Projected Monthly Overtime with 95% confidence interval for a 10
hour OR used for Plastic Surgery (Type 1). We can see that there is no over-time until 8
hours are scheduled in a ten hour OR.
Figure 3.4 Projected Monthly Overtime for 10 hour OR with 95% confidence interval for Plastic with 10 reps
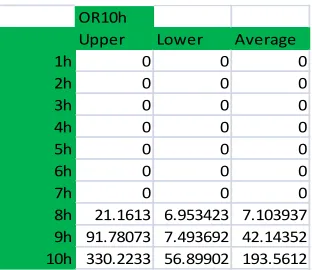
Table 3.7 below shows the average overtime and the lower and upper 95% confidence limits
of the schedule (in minutes). We calculate200 replications are needed for the 95% confidence 0
100 200 300 400
1h 2h 3h 4h 5h 6h 7h 8h 9h 10h Projected
Overtime (min)
Hours Scheduled Projected Monthly Overtime for 10 hour OR
interval half-width to be less than or equal to 15% of the average projected overtime for
plastic surgery for a ten hour OR.
Table 3.7 Overtime for a Ten Hour OR for Plastic with 10 rep
OR10h
Upper Lower Average
1h 0 0 0
2h 0 0 0
3h 0 0 0
4h 0 0 0
5h 0 0 0
6h 0 0 0
7h 0 0 0
8h 21.1613 6.953423 7.103937 9h 91.78073 7.493692 42.14352 10h 330.2233 56.89902 193.5612
Based on the number of replications calculated above, 200 replications will be used in next
section for plastic surgery.
Ortho Surgery (Type 2)
Figure 3.5 shows the Projected Monthly Overtime with 95% confidence interval for an 8
hour OR used for Orthopedic Surgery (Type 2). We can see that there is no projected
overtime until 7 hours are scheduled in a eight hour OR.
Figure 3.5 Projected Monthly Overtime for 8 hour OR with 95% confidence interval for Ortho with 10 rep 0
100 200 300
1h 2h 3h 4h 5h 6h 7h 8h Projected
Overtime (min)
Hour Scheduled Projected Monthly Overtime for 8 hour OR
Table 3.8 below shows the average overtime and the lower and upper 95% confidence limits
of the schedule (in minutes). We calculate237 replications are needed for the 95% confidence
interval half-width to be less than or equal to 15% of the average projected overtime for
Ortho surgery for an eight hour OR.
Table 3.8 Overtime for an Eight Hour OR for Ortho with 10 rep
OR8h
Upper Lower Average
1h 0 0 0
2h 0 0 0
3h 0 0 0
4h 0 0 0
5h 0 0 0
6h 0 0 0
7h 123.1148 8.307222 65.71103
8h 284.8562 163.7998 224.328
Figure 3.6 shows the Projected Monthly Overtime with 95% confidence interval for a 10
hour OR used for Orthopedic Surgery (Type 2), we can see that there is no projected
over-time until 7 hours are scheduled in a ten hour OR.
Figure 3.6 Projected Monthly Overtime for 10 hour OR with 95% confidence interval for Orthowith 10 rep
Table 3.9 below shows the average overtime and the lower and upper 95% confidence limits
of the schedule (in minutes). We calculate126 replications are needed for the 95% confidence 0
200 400 600
1 2 3 4 5 6 7 8 9 10 Projected
Overtime (min)
Hour Scheduled Projected Monthly Overtime for a 10 hour OR
interval half-width to be less than or equal to 15% of the average projected overtime for
Ortho surgery for a ten hour OR.
Table 3.9 Overtime for a Ten Hour OR for Ortho with 10 rep
OR10h
Upper Lower Average
1h 0 0 0
2h 0 0 0
3h 0 0 0
4h 0 0 0
5h 0 0 0
6h 0 0 0
7h 20.53574 4.342358 8.096693 8h 54.38237 21.04102 16.67068 9h 271.8465 118.7504 195.2985 10h 406.2594 190.9083 298.5838
Based on the number of replications calculated above, 240 replications will be used in next
section for plastic surgery.
General Surgery (Type 3)
Figure 3.7 shows the Projected Monthly Overtime with 95% confidence interval for an 8
hour OR used for General Surgery (Type 3), we can see that there is no projected over-time
until 6 hours are scheduled in a eight hour OR.
0 100 200 300 400 500
1h 2h 3h 4h 5h 6h 7h 8h Projected
Overtime (min)
Hour Scheduled Projected Monthly Overtime for an 8 hour OR
Figure 3.7 Projected Monthly Overtime for 8 hour OR with 95% confidence interval for General with 10 reps
Table 3.10 below shows the average overtime and the lower and upper 95% confidence
limits of the schedule, (in minutes). We calculate368 replications are needed for the 95%
confidence interval half-width to be less than or equal to 15% of the average projected
overtime for general surgery for an eight hour OR.
Table 3.10 Overtime for an Eight Hour OR for General with 10 reps
OR8h
Upper Lower Average
1h 0 0 0
2h 0 0 0
3h 0 0 0
4h 0 0 0
5h 0 0 0
6h 13.06921 1.736506 5.666353 7h 110.9819 5.207851 58.09488 8h 382.5219 189.2538 285.8878
Figure 3.8 shows the Projected Monthly Overtime with 95% confidence interval for a 10
hour OR used for Genral Surgery (Type 3), we can see that there is no over-time until 8
hours are scheduled in a ten hour OR.
Figure 3.8 Projected Monthly Overtime for 10 hour OR with 95% confidence interval for General with 10 reps 0
100 200 300 400 500 600
1h 2h 3h 4h 5h 6h 7h 8h 9h 10h Projected
Overtime (min)
Hour Scheduled Projected Monthly Overtime for a 10 hour OR
Table 3.11 below shows the average overtime and the lower and upper 95% confidence
limits of the schedule, (in minutes). We calculate185 replications are needed for the 95%
confidence interval half-width to be less than or equal to 15% of the average projected
overtime for general surgery for a ten hour OR.
Table 3.11 Overtime for a Ten Hour OR for General with 10 reps
OR10h
Upper Lower Average
1h 0 0 0
2h 0 0 0
3h 0 0 0
4h 0 0 0
5h 0 0 0
6h 0 0 0
7h 0 0 0
8h 43.7231 7.263023 18.23004
9h 150.4128 32.52944 91.4711
10h 482.0113 225.4326 353.722
Based on the number of replications calculated above, 370 replications will be used in next
section for plastic surgery.
Vascular Surgery (Type 4)
Figure 3.9 shows the Projected Monthly Overtime with 95% confidence interval for an 8
hour OR used for Vascular Surgery (Type 4), we can see that there is no projected over-time
Figure 3.9 Projected Monthly Overtime for 8 hour OR with 95% confidence interval for Vascular with 10 rep
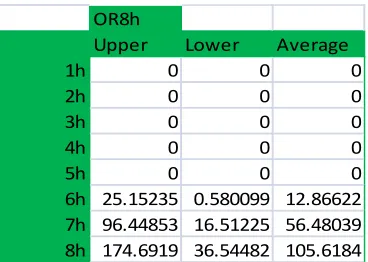
Table 3.12 below shows the average overtime and the lower and upper 95% confidence
limits of the schedule, (in minutes). We calculate220 replications are needed for the 95%
confidence interval half-width to be less than or equal to 15% of the average projected
overtime for Vascular surgery for an eight hour OR.
Table 3.12 Overtime for an Eight Hour OR for Vascular with 10 reps
OR8h
Upper Lower Average
1h 0 0 0
2h 0 0 0
3h 0 0 0
4h 0 0 0
5h 0 0 0
6h 25.15235 0.580099 12.86622 7h 96.44853 16.51225 56.48039 8h 174.6919 36.54482 105.6184
Figure 3.10 shows the Projected Monthly Overtime with 95% confidence interval for a 10
hour OR used for Vascular Surgery (Type 4), we can see that there is no projected over-time
until 8 hours are scheduled in a ten hour OR. 0
50 100 150 200
1h 2h 3h 4h 5h 6h 7h 8h Projected
Overtime (min)
Hour Scheduled Projected Monthly Overtime for an 8 hour OR
Figure 3.10 Projected Monthly Overtime for 10 hour OR with confidence interval for Vascular with 10 reps
Table 3.13 below shows the average overtime and the lower and upper 95% confidence
limits of the schedule, (in minutes). We calculate178 replications are needed for the 95%
confidence interval half-width to be less than or equal to 15% of the average projected
overtime for Vascular surgery for a ten hour OR.
Table 3.13 Overtime for a ten Hour OR for Vascular with 10 reps
OR10h
Upper Lower Average
1h 0 0 0
2h 0 0 0
3h 0 0 0
4h 0 0 0
5h 0 0 0
6h 0 0 0
7h 0 0 0
8h 14.52482 5.61978 4.45252 9h 148.991 33.58535 91.28819 10h 318.0196 107.8592 212.9394
Based on the number of replications calculated above, 220 replications will be used in next
section for plastic surgery.
Urology Surgery (Type 5)
0 100 200 300 400
1h 2h 3h 4h 5h 6h 7h 8h 9h 10h Projected
Overtime (min)
Hour Shceduled Projected Monthly Overtime for a 10 hour OR
Figure 3.11 shows the Projected Monthly Overtime with 95% confidence interval for an 8
hour OR used for Urology Surgery (Type 5), we can see that there is no projected over-time
until 6 hours are scheduled in a eight hour OR.
Figure 3.11 Projected Monthly Overtime for 8 hour OR with 95% confidence interval for Urology with 10 reps
Table 3.14 below shows the average overtime and the lower and upper 95% confidence
limits of the schedule, (in minutes). We calculate95 replications are needed for the 95%
confidence interval half-width to be less than or equal to 15% of the average projected
overtime for Urology surgery for an eight hour OR.
Table 3.14 Overtime for an Eight Hour OR for Urology with 10 rep
OR8h
Upper Lower Average
1h 0 0 0
2h 0 0 0
3h 0 0 0
4h 0 0 0
5h 0 0 0
6h 44.7411 3.21044 20.76533
7h 206.39 76.01009 141.2
8h 328.4379 124.3974 226.4177 0
100 200 300 400
1h 2h 3h 4h 5h 6h 7h 8h Projected
Overtime (min)
Hour Scheduled Projected Monthly Overtime for an 8 hour OR
Figure 3.12 shows the Projected Monthly Overtime with 95% confidence interval for 10 hour
OR Urology Surgery (Type 5), we can see that there is no projected over-time until 7 hours
are scheduled in a ten hour OR.
Figure 3.12 Projected Monthly Overtime for 10 hour OR with 95% confidence interval for Urology with 10 reps
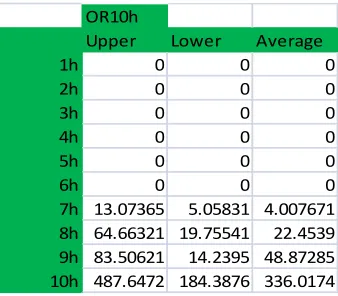
Table 3.15 below shows the average overtime and the lower and upper 95% confidence
limits of the schedule, (in minutes). We calculate200 replications are needed for the 95%
confidence interval half-width to be less than or equal to 15% of the average projected
overtime for Urology surgery for an eight hour OR.
Table 3.15 Overtime for a ten Hour OR for Urology with 10 rep
OR10h
Upper Lower Average
1h 0 0 0
2h 0 0 0
3h 0 0 0
4h 0 0 0
5h 0 0 0
6h 0 0 0
7h 13.07365 5.05831 4.007671 8h 64.66321 19.75541 22.4539 9h 83.50621 14.2395 48.87285 10h 487.6472 184.3876 336.0174 0
200 400 600
1h 2h 3h 4h 5h 6h 7h 8h 9h 10h Projected
Overtime (min)
Hour Scheduled Projected Monthly Overtime for a 10 hour OR
Based on the number of replications calculated above, 200 replications will be used in next
section for plastic surgery.
Neurology Surgery (Type 6)
Figure 3.13 shows the Projected Monthly Overtime with 95% confidence interval for an 8
hour OR Neurology Surgery (Type 6), we can see that there is no projected over-time until 6
hours are scheduled in a eight hour OR.
Figure 3.13 Projected Monthly Overtime for 8 hour OR with 95% confidence interval for Neurology with 10 reps
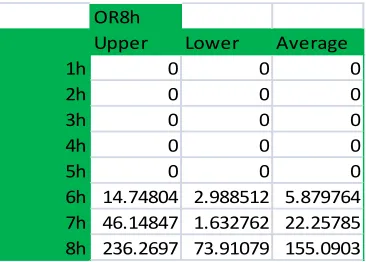
Table 3.16 below shows the average overtime and the lower and upper 95% confidence
limits of the schedule, (in minutes). We calculate250 replications are needed for the 95%
confidence interval half-width to be less than or equal to 15% of the average projected
overtime for Neurology surgery for an eight hour OR. 0
100 200 300
1h 2h 3h 4h 5h 6h 7h 8h Projected
Overtime (min)
Hour Scheduled Projected Monthly for an 8 hour OR
Table 3.16 Overtime for an Eight Hour OR for Neurology with 10 rep
OR8h
Upper Lower Average
1h 0 0 0
2h 0 0 0
3h 0 0 0
4h 0 0 0
5h 0 0 0
6h 14.74804 2.988512 5.879764 7h 46.14847 1.632762 22.25785 8h 236.2697 73.91079 155.0903
Figure 3.14 shows the Projected Monthly Overtime with 95% confidence interval for a 10
hour OR used for Neurology Surgery (Type 6), we can see that there is no projected
over-time until 8 hours are scheduled in a ten hour OR.
Figure 3.14 Projected Monthly Overtime for 10 hour OR with 95% confidence interval for Neurology with 10 reps
Table 3.17 below shows the average overtime and the lower and upper 95% confidence
limits of the schedule, (in minutes). We calculate250 replications are needed for the 95%
confidence interval half-width to be less than or equal to 15% of the average projected
overtime for Neurology surgery for a ten hour OR. 0
50 100 150 200 250
1h 2h 3h 4h 5h 6h 7h 8h 9h 10h Projected
Overtime (min)
Hour Scheduled Projected Monthly for a 10 hour OR
Table 3.17 Overtime for a ten Hour OR for Neurology with 10 reps
OR10h
Upper Lower Average
1h 0 0 0
2h 0 0 0
3h 0 0 0
4h 0 0 0
5h 0 0 0
6h 0 0 0
7h 0 0 0
8h 4.392183 0.967242 1.71247 9h 58.93559 9.040616 33.9881 10h 229.7727 61.36401 145.5683
Based on the number of replications calculated above, 250 replications will be used in next
section for plastic surgery.
OHNS Surgery (Type 7)
Figure 3.15 shows the Projected Monthly Overtime with 95% confidence interval for an 8
hour OR used for OHNS Surgery (Type 7), we can see that there is no projected over-time
until 6 hours are scheduled in a eight hour OR.
Figure 3.15 Projected Monthly Overtime for 8 hour OR with 95% confidence interval for OHNS with 10 reps 0
50 100 150 200
1h 2h 3h 4h 5h 6h 7h 8h Projected
Overtime (min)
Hour Scheduled Projected Monthly Overtime for a 10 hour OR
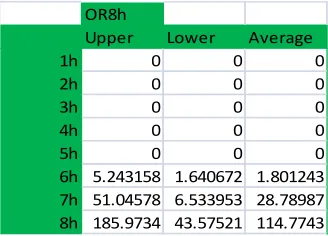
Table 3.18 below shows the average overtime and the lower and upper 95% confidence
limits of the schedule, (in minutes). We calculate171 replications are needed for the 95%
confidence interval half-width to be less than or equal to 15% of the average projected
overtime for OHNS surgery for an eight hour OR.
Table 3.18 Overtime for an Eight Hour OR for OHNS with 10 rep
OR8h
Upper Lower Average
1h 0 0 0
2h 0 0 0
3h 0 0 0
4h 0 0 0
5h 0 0 0
6h 5.243158 1.640672 1.801243 7h 51.04578 6.533953 28.78987 8h 185.9734 43.57521 114.7743
Figure 3.16 shows the Projected Monthly Overtime with 95% confidence interval for a 10
hour OR used for OHNS Surgery (Type 7), we can see that there is no projected over-time
until 8 hours are scheduled in a ten hour OR.
Figure 3.16 Projected Monthly Overtime for 10 hour OR with confidence interval for OHNS with 10 rep
Table 3.19 below shows the average overtime and the lower and upper 95% confidence
limits of the schedule, (in minutes). We calculate165 replications are needed for the 95% 0
50 100 150 200
1h 2h 3h 4h 5h 6h 7h 8h 9h 10h Projected
Overtime (min)
Hour Scheduled Projected Monthly for a 10 hour OR used for
confidence interval half-width to be less than or equal to 15% of the average projected
overtime for OHNS surgery for a ten hour OR.
Table 3.19 Overtime for a ten Hour OR for OHNS with 10 rep
OR10h
Upper Lower Average
1h 0 0 0
2h 0 0 0
3h 0 0 0
4h 0 0 0
5h 0 0 0
6h 0 0 0
7h 0 0 0
8h 4.572918 1.161282 1.705818 9h 92.36489 9.211759 50.78832 10h 181.3241 42.19929 111.7617
Based on the number of replications calculated above, 180 replications will be used in next
section for plastic surgery.
Thoracic Surgery (Type 8)
Figure 3.17 shows the Projected Monthly Overtime with 95% confidence for an 8 hour OR
used for Thoracic Surgery (Type 8), we can see that there is no projected over-time until 6
Figure 3.17 Projected Monthly Overtime for 8 hour OR with confidence interval for Thoracic with 10 rep
Table 3.20 below shows the average overtime and the lower and upper 95% confidence
limits of the schedule, (in minutes). We calculate250 replications are needed for the 95%
confidence interval half-width to be less than or equal to 15% of the average projected
overtime for Thoracic surgery for an eight hour OR.
Table 3.20 Overtime for an Eight Hour OR for Thoracic with 10 rep
Upper Lower Average
1h 0 0 0
2h 0 0 0
3h 0 0 0
4h 0 0 0
5h 0 0 0
6h 11.21807 0.444148 5.831108 7h 81.24705 42.35178 61.79942
8h 226.98 100.5575 163.7688
Figure 3.18 shows the Projected Monthly Overtime with 95% confidence interval for a 10
hour OR used for Thoracic Surgery (Type 7), we can see that there is no over-time until 9
hours are scheduled in a ten hour OR. 0 50 100 150 200 250
1h 2h 3h 4h 5h 6h 7h 8h Projected
Overtime (min)
Hour Scheduled Projected Monthly Overtime for an 8 hour OR
Figure 3.18 Projected Monthly Overtime for 10 hour OR with confidence interval for Thoracic with 10 rep
Table 3.21 below shows the average overtime and the lower and upper 95% confidence
limits of the schedule, (in minutes). We calculate165 replications are needed for the 95%
confidence interval half-width to be less than or equal to 15% of the average projected
overtime for Thoracic surgery for a ten hour OR.
Table 3.21 Overtime for Ten Hour OR for Thoracic with 10 rep
Upper Lower Average
1h 0 0 0
2h 0 0 0
3h 0 0 0
4h 0 0 0
5h 0 0 0
6h 0 0 0
7h 0 0 0
8h 0 0 0
9h 64.5963 3.080661 30.75782 10h 200.6863 51.43298 126.0596
Based on the number of replications calculated above, 250 replications will be used in next
section for plastic surgery to make sure the Results of Evaluation with the half-width
confidence interval less than or equal to 15% of the average over time.
Plastic Surgery (Type 1)
0 50 100 150 200 250
1h 2h 3h 4h 5h 6h 7h 8h 9h 10h Projected
Overtime (min)
Hour Scheduled Projected Monthly Overtime for a 10 hour OR
Figure 3.19 shows the Projected Monthly Overtime with 95% confidence interval for an 8
hour OR used for Plastic Surgery (Type 1) with 200 replications. We can see that there is no
over-time until 7 hours are scheduled in an eight hour OR.
Figure 3.19 Projected Monthly Overtime for 8 hour OR with 95% confidence interval for Plastic with 200 rep
Table 3.22 below shows the average overtime and the lower and upper 95% confidence
limits of the schedule (in minutes). We can see that the projected overtime is less than 60
minutes when 7 hours are scheduled and more than 60 minutes when 8 hours are scheduled.
So for OR3 to OR7 , so 7 hours is the reasonable number of hoursto schedule per day for
plastic surgery.
0 20 40 60 80 100 120 140 160 180
1h 2h 3h 4h 5h 6h 7h 8h
Projected Overtime
(min)
Hours Scheduled Projected Monthly Overtime for 8 hour OR
Table 3.22 Overtime for an Eight Hour OR for Plastic with 200 rep
OR8h
Upper Lower Average
1h 0 0 0
2h 0 0 0
3h 0 0 0
4h 0 0 0
5h 0 0 0
6h 1.414122 0.017513 0.698305 7h 29.35651 20.32122 24.83886 8h 161.7163 132.8295 147.2729
Figure 3.20 shows the Projected Monthly Overtime with 95% confidence interval for a 10
hour OR used for Plastic Surgery (Type 1) for 200 replications. We can see that there is no
over-time until 8 hours are scheduled in a ten hour OR.
Figure 3.20 Projected Monthly Overtime for 10 hour OR with 95% confidence interval for Plastic with 200 reps
Table 3.23 below shows the average overtime and the lower and upper 95% confidence
limits of the schedule, (in minutes). We can see that the projected overtime is less than 60
minutes when 9 hours are scheduled and more than 60 minutes when 10 hours are scheduled.
9 hours is the reasonable number of hours to schedule per day for plastic surgery. 0
50 100 150 200
1h 2h 3h 4h 5h 6h 7h 8h 9h 10h Projected
Overtime (min)
Hours Scheduled Projected Monthly Overtime for 10 hour OR
Table 3.23 Overtime for a Ten Hour OR for Plastic with 200 rep
OR10h
Upper Lower Average
1h 0 0 0
2h 0 0 0
3h 0 0 0
4h 0 0 0
5h 0 0 0
6h 0 0 0
7h 0 0 0
8h 8.410652 3.184348 5.7975 9h 59.37509 42.88687 51.13098 10h 162.0499 129.8652 145.9576
Ortho Surgery (Type 2)
Figure 3.21 shows the Projected Monthly Overtime with 95% confidence interval for an 8
hour OR used for Orthopedic Surgery (Type 2). We can see that there is no projected
overtime until 7 hours is scheduled in a eight hour OR.
Figure 3.21 Projected Monthly Overtime for 8 hour OR with 95% confidence interval for Ortho with 240 reps
Table 3.24 below shows the average overtime and the lower and upper 95% confidence
limits of the schedule (in minutes) with 240 replications. We can see that the projected
overtime is less than 60 minutes when 6 hours is scheduled and more than 60 minutes when 7 0
50 100 150 200 250
1h 2h 3h 4h 5h 6h 7h 8h Projected
Overtime (min)
Hour Scheduled Projected Monthly Overtime for 8 hour OR
hours is scheduled. So for OR3 to OR7 , 6 hours is the reasonable number of hours to
schedule per day for orthopedic surgery.
Table 3.24 Overtime for an Eight Hour OR for Ortho with 240 rep
OR8h
Upper Lower Average
1h 0 0 0
2h 0 0 0
3h 0 0 0
4h 0 0 0
5h 0 0 0
6h 1.610153 0.117423 0.863788 7h 85.15178 62.48945 73.82061 8h 219.9193 189.8036 204.8615
Figure 3.22 shows the Projected Monthly Overtime with 95% confidence interval for a 10
hour OR used for Orthopedic Surgery (Type 2) for 240 replication, we can see that there is
no projected over-time until 7 hours is scheduled in a ten hour OR.
Figure 3.22 Projected Monthly Overtime for 10 hour OR with 95% confidence interval for Orthopedics with 240 rep
Table 3.25 below shows the average overtime and the lower and upper 95% confidence
limits of the schedule (in minutes) with 240 replication. We can see that the projected 0
100 200 300 400 500
1 2 3 4 5 6 7 8 9 10 Projected
Overtime (min)
Hour Scheduled Projected Monthly Overtime for a 10 hour OR
overtime is less than 60 minutes when 8 hours is scheduled and more than 60 minutes when 9
hours is scheduled. So for OR1 and OR2, 8 hours is the reasonable number of hour to
schedule per day for orthopedic surgery.
Table 3.25 Overtime for a Ten Hour OR for Ortho
OR10h
Upper Lower Average
1h 0 0 0
2h 0 0 0
3h 0 0 0
4h 0 0 0
5h 0 0 0
6h 0 0 0
7h 10.69758 5.529658 8.113618 8h 11.98494 4.231136 8.108038 9h 253.8024 209.2562 231.5293
10h 381.811 335.8989 358.855
General Surgery (Type 3)
Figure 3.23 shows the Projected Monthly Overtime with 95% confidence interval for an 8
hour OR used for General Surgery (Type 3) with 370 replications, we can see that there is no
Figure 3.23 Projected Monthly Overtime for 8 hour OR with 95% confidence interval for General with 370 reps
Table 3.26 below shows the average overtime and the lower and upper 95% confidence
limits of the schedule (in minutes) with 370 replications. We can see that the projected
overtime is less than 60 minutes when 6 hours is scheduled and more than 60 minutes when 7
hours is scheduled. So for OR3 to OR7 , 6 hours is the reasonable number of hours to
schedule per day for general surgery.
Table 3.26 Overtime for an Eight Hour OR for General with 370 replications
0 50 100 150 200 250 300 350
1h 2h 3h 4h 5h 6h 7h 8h
Projected Overtime (min)
Hour Scheduled Projected Monthly Overtime for an 8 hour OR
General Surgery (Type 3)
OR8h
Upper Lower Average
1h 0 0 0
2h 0 0 0
3h 0 0 0
4h 0 0 0
5h 0 0 0
Figure 3.24 shows the Projected Monthly Overtime with 95% confidence interval for a 10
hour OR used for Genral Surgery (Type 3) with 370 replications, we can see that there is no
over-time until 8 hours are scheduled in a ten hour OR.
Figure 3.24 Projected Monthly Overtime for 10 hour OR with 95% confidence interval for General with 370 reps
Table 3.27 below shows the average overtime and the lower and upper 95% confidence
limits of the schedule (in minutes). We can see that the projected overtime is less than 60
minutes when 8 hours are scheduled and more than 60 minutes when 9 hours are scheduled.
So for OR1 and OR2, 8 hours is the reasonable scheduled hour for general surgery.
Table 3.27 Overtime for a Ten Hour OR for General
OR10h
Upper Lower Average
1h 0 0 0
2h 0 0 0
3h 0 0 0
4h 0 0 0
5h 0 0 0
6h 0 0 0
7h 0 0 0
8h 36.60645 25.06915 30.8378 9h 146.5684 122.4472 134.5078 10h 296.6329 259.9371 278.285
0 100 200 300 400
1h 2h 3h 4h 5h 6h 7h 8h 9h 10h Projected
Overtime (min)
Hour Scheduled Projected Monthly Overtime for a 10 hour OR
Vascular Surgery (Type 4)
Figure 3.25 shows the Projected Monthly Overtime with 95% confidence interval for an 8
hour OR used for Vascular Surgery (Type 4), we can see that there is no projected over-time
until 6 hours are scheduled in a eight hour OR.
Figure 3.25 Projected Monthly Overtime for 8 hour OR with 95% confidence interval for Vascular with 220 reps
Table 3.28 below shows the average overtime and the lower and upper 95% confidence
limits of the schedule, (in minutes). We can see that the projected overtime is equal to 60
minutes when 7 hours are scheduled. So for OR3 to OR7 , 7 hours is the reasonable number
of hour to schedule per day for vascular surgery. 0
50 100 150 200
1h 2h 3h 4h 5h 6h 7h 8h Projected
Overtime (min)
Hour Scheduled Projected Monthly Overtime for an 8 hour OR
Table 3.28 Overtime for an Eight Hour OR for Vascular with 220 replications
OR8h
Upper Lower Average
1h 0 0 0
2h 0 0 0
3h 0 0 0
4h 0 0 0
5h 0 0 0
6h 9.854731 5.749576 7.802153
7h 60.3583 48.45582 54.40706
8h 175.346 151.0245 163.1853
Figure 3.26 shows the Projected Monthly Overtime with 95% confidence interval for a 10
hour OR used for Vascular Surgery (Type 4), we can see that there is no projected over-time
until 8 hours are scheduled in a ten hour OR.
Figure 3.26 Projected Monthly Overtime for 10 hour OR with confidence interval for Vascular with 220 replications
Table 3.26 below shows the average overtime and the lower and upper 95% confidence
limits of the schedule, (in minutes). We can see that the projected overtime is less than 60
minutes when 8 hours are scheduled and more than 60 minutes when 9 hours are scheduled. 0
50 100 150 200 250 300
1h 2h 3h 4h 5h 6h 7h 8h 9h 10h Projected
Overtime (min)
Hour Shceduled Projected Monthly Overtime for a 10 hour OR
So for OR1 and OR2, 8 hours is the reasonable number of hour to schedule per day for
vascular surgery.
Table 3.29 Overtime for Ten Hour OR for Vascular with 220 replications
OR10h
Upper Lower Average
1h 0 0 0
2h 0 0 0
3h 0 0 0
4h 0 0 0
5h 0 0 0
6h 0 0 0
7h 0 0 0
8h 2.193476 0.644248 1.418862 9h 139.2293 117.4202 128.3247 10h 242.7691 208.5857 225.6774 Urology Surgery (Type 5)
Figure 3.27 shows the Projected Monthly Overtime with 95% confidence interval for an 8
hour OR used for Urology Surgery (Type 5) with 200 replications, we can see that there is no
projected over-time until 6 hours are scheduled in a eight hour OR.
Figure 3.27 Projected Monthly Overtime for 8 hour OR with 95% confidence interval for Urology with 200 reps
Table 3.30 below shows the average overtime and the lower and upper 95% confidence
limits of the schedule (in minutes). We can see that the projected overtime is less than 60 0
100 200 300
1h 2h 3h 4h 5h 6h 7h 8h Projected
Overtime (min)
Hour Scheduled Projected Monthly Overtime for an 8 hour OR