Thermal Performance of Air Flow Windows
via CFD Simulation
Nikita Jain
P.G. Student, Department of Mechanical Engineering, Career Point University, Kota, India1
ABSTRACT: The purpose of this paper is to investigate the thermal performance of such air flow windows in which air flow windows integrate windows and ventilation system by drawing the fresh air through the cavity between the panes before it enters the room. By the extensive CFD modeling it is shown that the method prescribed by the existing ISO standard is inadequate in predicting the convective heat fluxes in the ventilated cavity. The transient method is implemented in a program called Win Vent, developed in connection with this project. There is a large potential for lowering heating demands in buildings with exhaust ventilation by using air flow windows. The multi-node resistance model that is the ISO method is used for calculating the thermal performance for normal windows and air flow windows vision area. The parameter (geometry, boundary conditions, and mesh generation, near wall treatment, turbulence model and radiation model) study is done by using the CFD model.
KEYWORDS:Thermal, heat fluxes, Air Flow Windows, ventilated cavity, CFD model. I. INTRODUCTION
Being an important factor of human comfort balanced ventilation with heat recovery is not the only solution to lower ventilation heat loss. Another proposed solution to lower heating demands in exhaust ventilated buildings is the air flow window. The concept is also known as supply air window and ventilation window.[1] We focus here primarily on the heat loss characteristics of improved window systems and components, including both commercially available products which are not widely utilized as well as more speculative buildings often have high ventilation rates and therefore heat recovery has a much greater impact. Approaches which are under development or perhaps deserve additional development, testing, and appraisal. In the Dan-ish building regulation code [2] the minimum ventilation rate for the average apartment is highest. Balanced ventilation systems with heat recovery can significantly reduce the ventilation loss Commercial.
II. MATERIALS AND METHODS
The fundamental motive behind this project is to evaluate the thermal performance of air flow windows and the potential energy savings. The main aim of this project is to find out the satisfying method for calculating the characteristics of air flow windows.The main issue is the convective heat fluxes in the ventilated cavity. Convective heat fluxes depend on temperature differences and flow pattern of the fluid. The short time frame and the need to analyze many different configurations make CFD modeling the tool of choice for this part of the project. [3]
An approach to improve the calculation method for the ventilated cavity is analyzed:
The multi-node resistance models that ISO standard method is based on.
Transient heat flux and temperature development with the time dependency linked to the height of the cavity.
Description and Validation of CFD Models
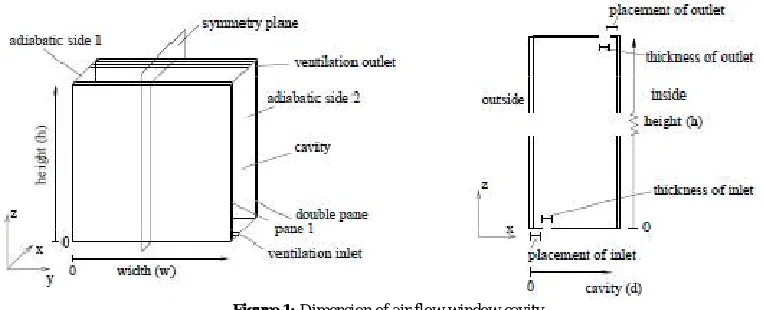
Figure 1: Dimension of air flow window cavity
Inlet and Outlet: A fixed flow rate is wanted for the CFD simulations. The boundary condition of the ventilation inlet is therefore a fixed velocity. It is assumed that there is a uniform distribution of inlet air in the width of thewindow. The outlet is assumed to have no effect on the cavity and is therefore simulated as a simple outflow boundary.
Table1: Boundary conditions
Type Setting Emissivity
Adiabatic walls heat flux 0 / 0 Outside pane convection 18 / 0.9 Inside pane convection 1.72 / 0.9 Inlet velocity inlet 0.6 m/s-0 ℃ 0 Outlet outflow [-] 0 Symmetry symmetry [-] [-]
Symmetry: The computational domain is cut in half by imposing a symmetry boundary on the geometrical plane of symmetry. A symmetry boundary simple imposes that no flux can exist through the boundary.
Radiation: The influences of the adiabatic boundaries on the radiation are excluded by setting the emissivity factor of these surfaces to zero. The emissivities of the panes are set to 0.9, which is roughly equal to an uncoated pane. [4]
Grid Dependency Analysis
The grid dependency is investigated by conducting simulations for the reference case with an increasing number of cells. The grid adaption function in FLUENT cannot be used together with the DTRMradiation model.This grid factor is varied between 0.7 and 2.0 producing between 56000 and 15000 cells, see table 2.
Table2: Parameter variation for grid dependency analysis
Grid factor 0.7 1.0 1.5 2.0
Size function initial size [mm] 0.35 0.50 0.75 1.0 Growth factor [-] 1.1 1.1 1.1 1.1 Size limit [mm] 1.75 2.5 3.75 5 Boundary layer first layer [mm] 0.35 0.50 0.75 1.0 Growth factor [-] 1.115 1.115 1.115 1.115 Cooper method distance [mm] 7 10 1.5 20 Number of cells 1490929 306225 193809 56150
Radiation Model
Radiative heat fluxes play an important role in normal windows. It is very crucial to include the radiative heat fluxes in the CFD simulations. The best radiation model for enclosed spaces and were the fluid doesn’t partake in the radiation, like our ventilated cavity, is properly the Surface toSurface model. The Surface to Surface model is a view factor model and calculates the view factor between all surfaces in the domain. The participation of the air is omitted by setting the absorption coefficient to zero.[5]
III.RESULTS
The purpose of the CFD simulations is to analyze the relationship between the specific geometry, conditions and the convective heat fluxes in the cavity.
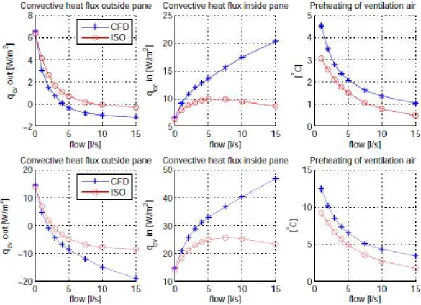
Figure 2: Dependency on ventilation flow rate. Comparison of main results from CFD simulations without solar irradiation, top, and with 500 / solar irradiation bottom and corresponding ISO standard calculations.
The ventilation flow depends on the pressure difference across the window. But the cause of the pressure difference is of no particularly interest for the air flow pattern. It is the aim of this project to present a method for calculating the thermal performance for specific conditions.
Solar irradiation: The surface temperatures of the cavity are increased by applying internal heat generation to the pane boundaries. The internal heat generation corresponding to an absorption of 12% in the outside pane and 10% in the inside pane of the total solar irradiation.[6]
Cavity depth: The depth of the cavity affects both the average velocity of forced air flow and thermal resistance of the cavity. The cavity depth is varied between 50 and 150mm.
Window height: The height of the window determines how long it takesfor the air to flow through the cavity. The higher the cavity the higher the potential preheating of the air. The height is varied between 0.75 and 1.5m.[7]
Analysis of CFD Simulation Results
The convective heat flux q is calculated from the convective heat transfer coefficient, h and the temperature difference between the surface and the air.
= ( − )
Modification of the ISO Standard Method
= , −
. .
, + ,
By increasing ( h , + h , ) the average air temperature, becomes closer to the average surface
temperature, , . It follows that a higher T makes it even more impossible to capture the large negative heat
flux observed in the CFD simulations.[8]
( , − , )
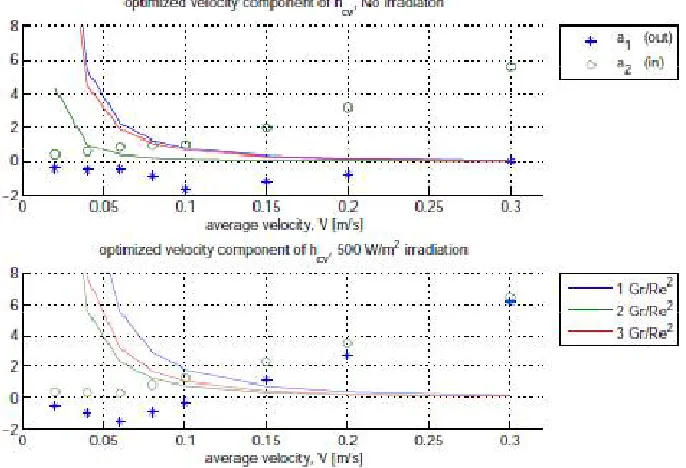
For ≪ the natural convection can be assumed negligible and for ≫ the forced flow can be assumed negligible.
Grashof = ( ∞)
Ration of buoyancy to viscous forces
Reynolds = Ratio of inertia to viscous forces
Figure 3: Results of the optimization of the velocity component for the heat transfer coefficients plotted together with possible calculations of .
Boundary Conditions for Transient Calculations
The surface temperature of the outer surface is rather stable according to the temperature profiles. It does not undergo any change very much over the height of the window.[9]
Figure 4: Transient temperature development for three surface conditions: constant surface temperature, constant heat flux and surface convection.
= ( − )
Impact of Transient Method vs. ISO Standard Method
Table 3: Comparison of windows thermal performance for transient or ISO standard method for ventilated cavity
Method parameter case 1 case 2 case 3
Transient U [ ] 0.69 0.55 0.41 Preheating [℃] 10.2 8.4 5.6 g-value [-] 0.62 0.63 0.65 ISO standard U [ ] 0.76 0.69 0.61 Preheating[℃] 8.5 6.5 4.0 g-value [-] 0.61 0.62 0.63 Improvement U [ ] 9% 25% 33% Preheating[℃] 20% 29% 40% g-value [-] 2% 2% 3%
A significant improvement of the ISO standard method, in terms of prediction of the convective heat flows in ventilated cavity. But they are only a small part of the total heat fluxes in the window and it is important to know whether the method for the ventilated cavity has any impact on the total performance of the window. [11]
Table 4: Main thermal characteristics of different panes including coating (Values are calculated with WIS)
Name IR emissivity solar transmittance
Inside [-] outside [-] [-]
iplus SE 0.037 0.837 0.466
W D lawE 0.092 0.837 0.666
W D hard 0.160 0.890 0.699
W D clear 0.837 0.837 0.847
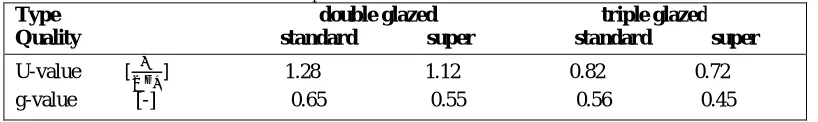
Thermal performance characteristics of normal windowsare shown in table 5 in which there are presented both a standard and an optimized ’super’ version of double and triple glazed windows.
Table 5: Thermal performance characteristics of normal windows
Type double glazed triple glazed Quality standard super standard super
U-value [ ] 1.28 1.12 0.82 0.72 g-value [-] 0.65 0.55 0.56 0.45
Stable g-value
Figure 5: G-values dependency on amount of solar irradiation.
Thermal Performance with Solar Irradiation
Figure 6: Comparison of g-value for different ventilation window
IV. CONCLUSION
The CFD model is therefore validated against a well known and extensively researched case: natural convection in a closed vertical cavity. Comparison with the ISO standard method for closed cavities has shown that the Renormalization Group (RNG) turbulence model has the overall best results. But for low surface temperature differences, where the flow is expected to be laminar and without multi cellular flows, the laminar or the RNG-model with Viscosity Differential Model (VDM) enabled, produces the best results. The grid dependency analysis has shown that refinement of the grid will only cause minor changes to the results. It is therefore reasonable to assume grid independency of the simulations.
REFERENCES
[1] Ruchi Kadwane , VinayaGohokar, “Design and characteristics investigation of Multi-Band microstrip patch Antenna for Wireless Applications”, International Journal of Emerging Engineering Research and Technology, Volume 2, Issue 3,pp 61-66,June 2014.
[2] The National Home Energy Rating scheme, www.nher.co.uk.
[3] Bhamjee M, Nurick A, Madyira DM., “An experimentally validated mathematical and CFD model of a supply air window: forced and natural flow”, Energy and buildings, 2013, 57:289-301.
[4] Gloriant F, Tittelein P, Joulin A, Lassue S., “Modeling a triple-glazed supply-air window”, Building and environment, 2015. [5] Gloriant F, Tittelein P, Joulin A, Lassue S. “Modeling supply-air window in a building simulation code”, Building Simulation 2013. [6] Wright JL., “Effective U-value and shading coefficients of preheat/supply air glazing systems”, Waterloo, Ontario (Canada): 1986. [7] ISO-15099, “Thermal performance of windows, doors and shading devices-detailed calculations”, 2003.
[8] J.L.Wright, “a correlation to quantify convective heat transfer between vertical window and glazings ASHRAE Transactions”, Volume 102, 1996, pp. 940-946.
[9] Raffnsøe LM. “Thermal Performance of Air Flow Windows”, Master Thesis, Danmarks Teniske Universitet, 2007.