ABSTRACT
RAUT, POORVA BHUSHAN. Understanding the Attitude-Behavior Gap in the
Consumption of Green Apparel. (Under the direction of Dr. Marguerite Moore and Dr. Lori Rothenberg).
Consumers play a crucial factor in the decision making process that occurs at every step of the textile value chain. Hence, it is of prime importance to understand consumer requirements, attitudes and behaviors. However, it is observed that most of the existing research studies the ethics of companies while very little research is carried out to study the ethics of the consumer. The purpose of this research is to address this shortcoming through insights from the consumer perspective. Specifically, this study empirically examines a U.S. consumer sample to contrast consumers who behave in pro-environment ways against those who do not behave in pro-environment manner and study the attitude-behavior gap within the consumer behavior.
and with a lower income. They are very price sensitive, unengaged in green apparel purchase and do not show intentions to purchase it in the future.
Understanding the Attitude-Behavior Gap in the Consumption of Green Apparel
by
Poorva Bhushan Raut
A thesis submitted to the Graduate Faculty of North Carolina State University
in partial fulfillment of the requirements for the degree of
Master of Science
Textiles
Raleigh, North Carolina 2016
APPROVED BY:
_______________________________ _______________________________ Dr. Marguerite Moore Dr. Lori Rothenberg
Co-chair of Advisory Committee Co-chair of Advisory Committee
_______________________________ _______________________________ Dr. Lisa Parrillo-Chapman Dr. Moon W. Suh
Committee Member Committee Member
DEDICATION
♥
BIOGRAPHY
Poorva Raut was born on July 6, 1992 in Mumbai, India. She is the daughter of Mr. Bhushan and Mrs. Varsha Raut. Poorva grew up in Mumbai, where she graduated with a Bachelor of Technology in Fibers and Textile Processing in 2014 from the Institute of Chemical Technology (ICT), Mumbai, one of the leading schools for Chemical Technology globally. For her remarkable academic excellence she was awarded with UAA’s (UDCT Alumni Association) prestigious ‘Best Student Award’ in the year 2013.
Upon graduation, Poorva continued her education by pursuing her Master’s Degree in Textiles by joining North Carolina State University’s (NCSU) College of Textiles in Fall
2014. Poorva has a keen interest in market research and consumer analytics. She is currently working with Cotton Incorporated as a part of Consumer Innovation Practicum. This Practicum is NCSU’s Poole College of Management’s, industry collaboration initiative. As a
part of the Practicum she is working with a team of three other MBA students in studying the efficacy of priming at point of purchase to drive key desired behavior. Poorva also currently serves as the Vice President of Textile Association of Graduate Students (TAGS), at College of Textiles, where she is actively involved in organizing events, interacting with faculty and students and advising the college on specific issues related to graduate students.
ACKNOWLEDGEMENT
I would like to take this opportunity to sincerely thank all the people who have been supremely influential in my academic and personal life. Firstly and most importantly, I would like to express my deepest gratitude to Dr. Marguerite Moore my co-chair and advisor for her excellent guidance, everlasting care and most importantly for providing me with a plethora of opportunities to grow professionally and personally. Thank you for your enthusiasm about my research idea and belief in my ability. Second, I want to extend my sincere gratitude to my co-chair Dr. Lori Rothenberg for her constant encouragement and outstanding guidance through a major part of my research.
I would also like to sincerely thank Dr. Lisa Parrillo-Chapman, Dr. Moon W. Suh and Dr. Karen Leonas for serving as members on my committee and for their valuable insights and constant guidance. I want to extend a sincere thank you to Dr. Nancy Cassill and Dr. Yingjiao Xu for their constant encouragement and support as I complete my graduate studies. Heartfelt thanks to Rob Cooper for his support. I would like to take this opportunity to offer my sincere gratitude to Cotton Incorporated for providing the survey data for this research.
TABLE OF CONTENTS
LIST OF TABLES ... vii
LIST OF FIGURES ... viii
CHAPTER 1 INTRODUCTION...1
Purpose of the Study ...3
Research Objectives ...4
Significance of the Study ...4
CHAPTER 2 LITERATURE REVIEW ...6
Attitude-Behavior Gap ...6
Consumers’ Justification for the Gap ...7
Consumer Theories to Rationalize Purchase Decisions...11
Models Developed to Understand the Consumer Decision-Making Process ...12
Green Consumer Demographics ...15
Product Attributes ...17
Attribution of Responsibility ...21
Future Purchase Intentions ...24
CHAPTER 3 RESEARCH METHODOLOGY AND EXPERIMENTATION ...28
Research design ...28
Data collection and sample ...29
Measurement ...29
CHAPTER 4
RESULTS ...32
Sample Characteristics ...32
Research Objective One: Demographics ...35
Research Objective Two: Product Attributes ...38
Research Objective Three: Attribution of Responsibility ...41
Research Objective Four: Future Purchase Intentions ...44
CHAPTER 5 CONCLUSIONS, IMPLICATIONS, LIMITATIONS, FUTURE RESEARCH ...52
Conclusions ...52
Practical Implications...58
Limitations and Future Research ...59
REFERENCES ...61
LIST OF TABLES
Table 1: Sample Characteristics ...33
Table 2: Retail Patronage Choice ...34
Table 3: Average Monthly Personal Expenditure on Apparel ...35
Table 4: T-test for Age, Education, Annual Household Income ...36
Table 5: Chi-square test for Gender ...36
Table 6: Chi-square test for Retail Patronage ...37
Table 7: Chi-square test for Employment Status ...38
Table 8: T-test for Product Attributes ...40
Table 9: Chi-square test for Attribution of Responsibility ...42
Table 10: Chi-square test for Attribution of Responsibility (Reaction) ...43
Table 11: Chi-square test for Willingness to Pay More ...46
Table 12: Chi-square test for Future Purchase Intention ...49
LIST OF FIGURES
Figure 1: Theory of Reasoned Action ...12
Figure 2: Theory of Planned Behavior...13
Figure 3: Graph of Product Attributes ...40
Figure 4: Graph of Attribution of Responsibility ...42
Figure 5: Graph of Attribution of Responsibility (Reaction)...44
Figure 6: Graph of Willingness to Pay More ...47
CHAPTER 1
Introduction
Consumers are at the heart of the supply chain. The products that are produced and the services that are provided should meet the ultimate requirements of the consumer. Thus consumers play a crucial factor in the decision making process that occurs at every step of the value chain. Hence, there is an ongoing importance to understand consumer requirements, attitudes and behaviors.
However, understanding the numerous potential influences in the mind of the consumer is not an easy task. A number of recent studies in the consumer behavior literature demonstrate that what consumers say they do and what they actually do are in particular cases two different things (Johnstone & Tan, 2015; Young, Hwang, McDonald & Oates, 2010; Milfont, 2009). For example, consumers profess their willingness to spend on green products but they do not subsequently buy the products they actually say they prefer. Various studies suggest that 30 percent of consumers have positive attitudes towards purchase of responsible products. Out of this estimated group, only 3 percent actually translate their attitudes into congruent buying behavior (Davies, Lee, & Ahonkhai, 2012). Thus, there is a vast gap in consumer attitude and their actual buying behavior. This inconsistency between consumers’ words and deeds is commonly referred to by academic researchers as the
attitude-behavior gap (Roberts, 1996).
for responsible consumption of low priced goods while these implications change for the purchase of high priced goods due to financial implications. Typical reasons attributed to the attitude behavior gap include confusion about green products and a consumer mind-set that green products are often expensive (Roberts, 1996). A study of students from south-eastern universities found that there is a low perceived behavior amongst consumers because they think that their one action cannot make much of a difference and hence they choose not to buy green products. Consumers also experience lack of social pressure which prevents them from buying green products. However, they show a changed behavior in the presence of peers where consumers purchase differently to send a positive message to others as a status symbol (Gabler, Butler, & Adams, 2013).
Further studies suggest that approximately 70 percent of the consumers self-report a gap within their own attitude and behavior for the purchase of green products. As a means of justifying this observed gap the consumers argue that there are uncontrollable circumstances such as lack of knowledge, insufficient time and lack of access to recyclable programs within the community which cause the gap (Kennedy, Beckley, McFarlane & Nadeau, 2009). The attitude-behavior gap is also found to be a function of the temporal frame and increases or decreases based on the context and ability of consumers to compensate choices and manage emotions. Consumers often employ guilt-management strategies in order to sustain a contradictory behavior and manage this cognitive dissonance. For example, a feeling of guilt related to a consumer’s unethical choice is usually compensated by pride associated with a
previous ethical choice on their part (Gregory-Smith, Smith, & Winklhofer, 2013).
(Ha-Brookshire & Norum, 2011; see also Connell, 2010). However, this attitude does not translate into actual purchase behavior. They either do not buy green apparel or are not consistent in their purchase (Sudbury & Böltner, 2011; Bray, Johns & Kilburn, 2011; Young, Hwang, McDonald & Oates, 2010). Though research into the attitude-behavior gap in the context of socially responsible consumption behavior is limited in scope and empirical depth, consensus among researchers that such a gap exists suggests that future study into socially responsible consumer behaviors including buying environmentally friendly products should consider the potential for an attitude-behavior gap among consumers.
Purpose of the Study
To date most of the research carried out to understand the attitude behavior gap among consumers’ is generalized to all green products (e.g. organic food and green
electronic products). Very little knowledge is available regarding the textile consumers and their attitude-behavior gap. The following study is carried out as an attempt to fill this void.
Research Objectives
i. To identify the demographic profile of pro-environment apparel consumers.
ii. To identify apparel product attributes which are important to the pro-environment consumer.
iii. To determine consumer attribution of responsibility for the sale of non-environment friendly products among multiple levels in the apparel supply chain (i.e., manufacturer, brand, retailer and consumer).
iv. To understand the future purchase intentions of such pro-environment consumers.
In contrasting the apparel consumers who behave in pro-environment ways against those who do not, this study defines each type of consumers as follows based on the survey response obtained. The pro-environment consumers are classified as the consumers who self-reported their involvement in purchase of apparel labelled either as environmentally-friendly, recycled or sustainable. While the not pro-environment consumers are classified as consumers who self-reported that they are not involved in purchase of apparel labelled by any of the following: environmentally-friendly, recycled or sustainable. This will be further explained in Chapter 3.
Significance of the Study
CHAPTER 2
Literature Review
As mentioned in Chapter 1 the purpose of this study is to examine the gap observed in the attitude and behavior of consumers during the process of purchasing green apparel. This chapter will review some of the key relevant work that has been carried out to assess the attitude behavior gap as well as increase our understanding about consumer attitudes and behavioral intentions.
Attitude Behavior Gap
In general, academics and practitioners agree that consumers tend to differ in their individual perceptions of products and services. What one consumer perceives as ethical may not be perceived as ethical by another consumer. The European Commission’s (2011) report states that 88 percent of Europeans consider protecting the environment very important. The same study further states that 87 percent of Europeans believe that environmental protection is in part the responsibility of the individual. More recently, the European Commission (2013) reports that 89 percent of Europeans believe that purchasing green products can make a difference with respect to the environment and 95 percent agree that purchasing green products is the, ‘right thing to do’ (European Commission, 2013, p.6). Within the U.S., 58
idea of this gap are predominantly anecdotal. Therefore empirical research is needed to build an understanding of this increasingly important consumer segment.
Consumers’ Justification for the Gap
Consumers evaluate environmental problems differently because different variables affect their perception and evaluation of issues. The review of academic literature on the existence of the attitude-behavior gap within the realm of green product purchasing (i.e., apparel and additional consumer products) suggests a number of potential reasons for this gap: price (e.g., Sudbury and Böltner, 2011), consumer cynicism (e.g., Bray, Johns and Kilburn, 2011) product availability (e.g. Barbarossa & Pastore, 2015) and brand loyalty (Ahluwalia, Burnkrant & Unnava, 2000). The following sections report the relevant research findings that describe these potential influences on green purchasing. The research included in this portion of the review focuses on the consumer attitude-behavior gap for the purchase of multiple types of green products, including those beyond apparel.
Price
McDonald and Oates’ (2010) research which focuses on multiple product categories suggests that time influences the purchase of ethical goods. Their research reveals that while consumers are willing to spend relatively more time to purchase organic groceries, they are less willing to do so when purchasing other products (e.g., energy saving electronic products or organic food products) and often use lack of time as an excuse for unethical purchases (Young, Hwang, McDonald & Oates, 2010).
Cognitive mapping is the process of representing the decision-making process of an individual based on a particular theme and identifies relationships between different cognitive elements at a given moment. It facilitates understanding of how interventions in specific barrier can change environmentally conscious consumers’ perceptions of other
related barriers by assigning different degrees of priority to the different barriers (Chaney and Marshall, 2013). Barbarossa and Pastore (2015) used the cognitive mapping theory to assess which barriers are perceived most relevant in hampering the purchase of green products for environmentally conscious consumers. The results indicate that the main barriers responsible for green purchasing gap are the lack of availability, higher perceived prices and improper communication. Barbarossa and Pastore also found that ethical product’s placement inside the store reinforce consumers’ perception of environmentally-friendly products as too
Cynicism
Bray, Johns and Kilburn (2011) also report that consumer cynicism is an additional impediment to green purchasing behavior. They find that consumers express doubt regarding brands’ ethical claims as a justification for their reluctance to purchase ethical products.
Further, the research suggests that consumers feel that ethical claims are merely a marketing gimmick whereby brands command higher prices and take advantage of consumer goodwill. They also report that consumers believe the beneficiaries of their ethical choices should be the sweatshop workers, but cynically assume that the beneficiaries are the corporate organizations who ultimately profit. Additionally, consumers commonly perceive that companies who primarily focus on maintaining ethical standards produce low quality products (Bray, Johns, & Kilburn, 2011).
Social Desirability
(2009) carried out two studies to explicitly address whether Socially Desirable Responding has direct or moderating effects on self-reported environmental attitudes and behavior. He found that social desirability does not influence the way people respond to questions addressing environmental issues. Thus, the findings to date indicate that social desirability appears to have mixed effects on the consumer’s purchase of green products.
Brand Loyalty
Consumer Theories to Rationalize Purchase Decisions
Consumers have their own theories on which they base their purchase decisions. The most common and widely accepted is the theory of neutralization used by consumers to rationalize their deviant behavior. Consumers try to maintain their self-esteem and resort to this theory to justify their behavior (Chatzidakis, Hibbert & Smith, 2006). In the Johnstone and Tan (2015) study, the researchers conclude that consumers indicate two main reasons for discrepancies in their behavior. The first reason referred to as ‘denial of responsibility’, suggests that consumers claim that being eco-friendly is time consuming and requires much effort and money. The researchers report that consumers claim that high price, income constraints, limited time and shopping resources hinder their ability to engage in green consumption and justify their denial of responsibility. The second main reason for consumer purchase behavior discrepancy offered by Johnstone and Tan is the ‘denial of benefit (injury)’ whereby consumers claim that their ethical misconduct does not cause serious,
direct harm to others and hence this behavior should be acceptable. In keeping with Johnstone and Tan’s (2015) first stated reason for consumer’s behavioral discrepancy,
Young, Hwang, McDonald and Oates (2010), find through in-depth interviews of self-declared green consumers, that there is a gap in the purchase of ethical products due to efforts required to buy ethical products. In a related 2014 study, Miniero, Codini, Bonera, Corvi and Bertoli also investigated green purchase behavior among consumers. Through an experimental design, the researchers demonstrate a time effect that impacts consumers’
they would require several months to adjust their habits before going green, no matter how urgently they perceive an environmental problem.
Models Developed to Understand the Consumer Decision-Making Process
Consumer researchers employ a diverse range of models to study the cognitive and rational aspects of the consumer behavior to understand the underlying consumer decision making process and bridge the attitude-behavior gap. The most common theoretical approach adopted by researchers in the past is the ‘Theory of Reasoned Action (TRA)’ developed by Fishbein and Ajzen (1975). This model suggests that a person’s behavior is determined based on his/her intention to perform. The intention in turn is a function of the individual’s
attitude towards the behavior and his or her subjective norm. These attitudes and subjective norms originate from consumer beliefs and evaluations. Thus, this theory identifies two factors, individual attitudes and subjective norms, as the antecedents of behavior (Figure 1).
Figure 1: Theory of Reasoned Action (adopted from Fishbein and Ajzen, 1975)
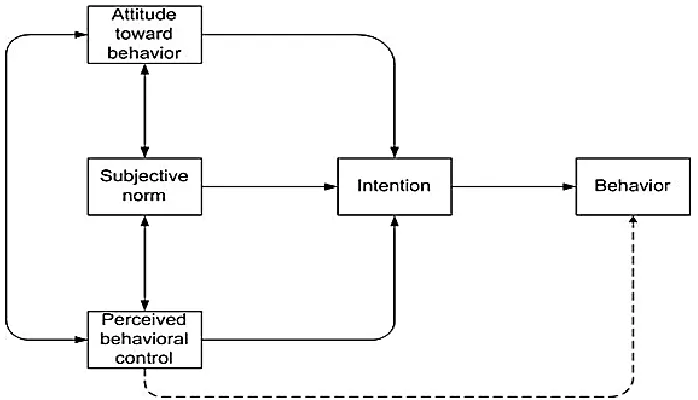
(Figure 2). This theory asserts that attitude (i.e., evaluation of target behavior), subjective norms (i.e., social factors like perceived social pressure regarding performance of behavior), and perceived behavioral control (i.e., perceived control over performance of the behavior) influence behavior primarily through their impact on behavioral intention. The central theme of this theory is that behavioral decisions are not made spontaneously but are a result of a reasoned process involving factors which include attitudes, norms and perceptions of control over the behavior.
Figure 2: Theory of Planned Behavior (adopted from Ajzen, 1991).
an issue impacts all stages of Rest’s model, such that at any given time two separate moral
issues are simultaneously acknowledged by the consumer and may exert different levels of influence on their decision making process. A review by Loe, Ferrell and Mansfield (2000) concludes that Jones’ approach provides a more comprehensive synthesis model of ethical
decision-making. However, these models focus exclusively on ethical aspects of the decision-making process and do not provide insight into situations where ethics of a decision may be secondary factors. For example, ethics may have some influence while buying clothes however consumers may find fit, color style as more important aspects. Moreover, TRA and TPB models have been devised to study the general decision making process of consumers and not just specifically concerned with green consumption decisions (Bray, Johns, & Kilburn, 2011).
Green Consumer Demographics
Over the past several decades researchers have considered the demographic profile of consumers who tend to purchase green products with particular attention to both apparel and food categories. This research is reviewed to understand past findings that relate demographics to green purchasing behaviors.
unethical behavior compared to males. Thus, this research suggests that women are more likely to act in pro-environment purchase behavior as compared to men.
In a study to determine if age plays a significant role in determining consumers’ attitude towards green products, Hustvedt and Dickson (2011) find that older consumers do not have skepticism towards the purchase of green products. These older consumers are observed to be supporters of organic farming and pro-environment companies as compared to consumers below the age of 45. Hustvedt and Dickson further report that older consumers value paying more for organic cotton apparel and are less sensitive towards price since they were more educated and financially stable. Previous research by the same duo Hustvedt and Dickson (2009) has established that age plays an important role in purchase behavior and Baby-Boomers are more likely to engage in pro-environment buying behavior as compared to Millennials.
Thus, based on the empirical literature to date, the various factors that influence consumers’ purchase behavior related to green products include: age, gender, education level,
and income level. Hence the following research objective was developed for this study.
RO1: To identify the demographic profile of pro-environment apparel consumers and contrast that against the profile of consumers who engage in non-green purchase of apparel.
Product Attributes
Traditional economic views suggest that products were primarily bought to satisfy basic human needs. However, the marketing view realizes that products are bought to fulfill consumers’ desires. Consumers recognize their needs for apparel products and often seek
information and conduct their own evaluation of the products prior to making purchase decisions. Consumers commonly consider numerous product attributes when making purchase decisions (Zhang, Li, Gong, & Wu, 2002).
Soutar, (2012) carried out a study to identify young Australian consumers preferences related to denim jeans. Focus group participants in this study reveal that style, price, brand, country of origin and ethics are the attributes used to evaluate denim jeans. A conjoint analysis further reveals that consumers identify price as having the highest relative importance, followed by brand, country of origin (COO), style and ethical attributes for the purchase of denim jeans. Huddleston and Cassill (1990) in their paper to understand female consumers brand orientation find that consumers use brand name as a cue to assess quality, thus justifying a willingness to pay a higher price for a product with an established brand name. Similar studies like the one carried out by North, De Vos and Kotzé, (2003) states that price, care requirements, brand, product composition (i.e. style and color), store image, and advertising image are the factors that influence the evaluation and purchase decision of apparel.
In addition to concerns regarding how products are made, consumers are also interested in where products are made. As a part of their study on whether female fashion leaders and fashion followers differ in the importance they give to selected clothing attributes and their attitudes toward buying imported and domestic apparel, Beaudoin, Moore and Goldsmith (2000) find that price, care, COO, quality, and style are most important to female consumers. A focus group study followed by a survey was carried out by Sneddon, Soutar, and Lee (2014) to explore the attributes that wool consumers consider important during their purchase. The study indicates that COO is considered most important by wool consumers followed by price, brand, ethical attributes and style while making purchase decisions. In their study on consumers’ willingness to pay for socially responsible products made from
high demand by socially conscious consumers who are interested in saving domestic jobs, thereby increasing economic activities within the U.S. These consumers consider this an act of patriotism and social responsibility. COO along with sustainable farming techniques have become important criteria that consumers consider while making their purchase decisions. Based on their research findings, Ha-Brookshire and Norum conclude that an average priced cotton woven shirt or blouse made of U.S. grown fiber with complete transparency and sustainable farming captures 6.6 percent market share. The same cotton product produced using conventional farming captures only 5.7 percent market share. Surprisingly, only 1.1% percent of consumers prefer the same shirt with unknown fiber origin and no information regarding farming technique.
Connection between Demographics and Product Attributes
The literature provides several examples of relationships between consumer demographics and product attribute preferences. Zhang, Li, Gong, & Wu (2002) have identified age as a significant influencer on the perceived importance of fit, comfort, style, price, color, trendiness, brand and fiber content. Older people are observed to put more emphasis on all product attributes except trendiness and brand. Zhang, Li, Gong, & Wu thus conclude that older consumers act more practically, as they pay more attention to tangible things while younger consumers tend to pay more attention to symbolic factors like trendiness and brand name of apparel products. In a more recent similar study, Jegethesan, Sneddon, and Soutar, (2012) find that young adult consumers identify style, price, brand, COO and ethics as attributes that they use to evaluate denim jeans before purchase.
Zhang, Li, Gong and Wu (2002) identified that gender also has a significant impact on the importance of most of the attributes. Female consumers tend to place more importance on most of the attributes especially fit, comfort, style, color and easy care as compared to male consumers. North, De Vos and Kotzé’s (2003) findings support this by indicating that style is the most important attribute for women when making purchasing decisions, while price is the second most important attribute.
Based on the literature presented in the previous sections, findings related to the importance of product attributes in the consumer decision process tend to differ based on context and apparel type (e.g., example, formal or casual). The following research objective (RO2), which is grounded in this literature, addresses the impact of product attributes among the pro-environment consumer.
RO2: To identify product attributes which are important to the pro-environment consumer amongst the following: fit, price, brand, country of origin, style, eco-friendly apparel, quality and durability.
Attribution of Responsibility
As stated by Yoon (2013), negative consumer experiences may adversely change a consumer’s perception of a particular product and can alter their purchase decisions. When
consumption experiences do not live up to expectations, consumers start attributing blame. Hence it becomes necessary to understand who consumers hold responsible for products or services which are not ethical. The literature suggests that consumers engage in spontaneous attributional activity. Therefore, consumer attributions are an extremely significant variable to study as they help predict consumers’ attitudes and purchase intentions (Folkes, 1984).
Moreover, Griffin, Babin and Attaway’s (1996) attribution based research points out that negative product information can have a relatively greater impact on cognition and affect as compared to positive product information.
responsible). Due to this ambiguity, consumers base their attributions on momentary contextual cues. Yoon carried out a study to understand if negative consumption experiences adversely affect the perception of consumers related to manufacturers and retailers. His findings reveal that analytical thinkers (i.e., westerners and people with an independent self-view) are more likely to attribute the blame on manufacturers while holistic thinkers (i.e., easterners and people with an interdependent self-view) may attribute the blame to retailers resulting in lowering of repurchase at the retailer side. Moreover, Yoon concludes that negative consumption experiences adversely impact consumer perceptions of manufacturers and retailers. Similar to the findings stated by Yoon, in an earlier study, Laufer (2002) suggests that consumers in individualistic societies may be more likely to attribute product failures to a company; whereas consumers in collectivistic societies may be more likely to consider situational factors external to the company.
and hence come under self-declaration claims. On the other hand, independent third party claims are based on compliance with predetermined criteria, which are independently verified by a competent authority.
Grankvist, Dahlstrand and Biel (2004) report that information about environmental outcomes provided by eco-labels influence consumer product preferences. This influence is more pronounced in consumers who attach more importance to environmental consequences. In the same study, Grankvist, Dahlstrand, and Biel also find that consumers pay attention to environmental labels if they value environmental protection and perceive buying environmentally friendly products as an effective means to achieve this goal. Harris, Grewal, Mohr, and Bernhardt (2006) report that online consumers tend to blame themselves more for service failures than offline consumers.
Connection between attribution of blame and demographics
Yoon’s (2013) findings state that demographics are related to consumer’s attribution
of blame. His studies observe that women blame a company more than men. Laufer and Gillespie (2004) found in two separate experiments that women blame a company more than men for a harmful product crisis even when it is unclear whether the company, consumers, or situational factors are responsible for the crisis. Laufer and Gillespie attribute this finding to the idea that women feel more vulnerable to crises that affect them.
as consumers are sensitive to environmental protection. In order to examine the attribution of blame within the context of this study, the following objective is stated.
RO3: To determine consumer attribution of responsibility for the sale of non-environment friendly products among multiple levels in the apparel supply chain (i.e., manufacturer, brand, retailer and consumer).
Future Purchase Intentions
Several studies have measured consumer willingness to purchase (WTP) organic apparel using different approaches. Mai and Hoffmann (2012) reveal that price is one of the main attributes upon which purchasing decisions are based. Gleim, Smith, Andrews, and Cronin (2013) state that consumers blame high prices as a barrier to green consumption. Although organic green products are generally perceived as being more expensive than conventional goods, statistics reveal that price does not play a significant role in purchasing eco-labeled goods (Grankvist and Biel, 2001). A recent study by Olson (2013) reports that consumers with environmental concerns are less sensitive to price and willing to accept trade-offs between higher expenditures and environmental benefits. Pedersen and Neergaard (2006) have found that environmental labels which assist consumers to make informed purchasing decisions create an environment which facilitates rather than inhibits green behavior.
reveal their involvement in acquiring apparel on a needs basis and extending apparel usage by using it for its entire lifetime. The second perceived eco-conscious apparel acquisition behavior mentioned by the participants is acquisition of apparel with attributes they deem as environmentally preferable.
Ha-Brookshire and Norum (2011) carried out a telephone survey to collect data from 500 respondents nationwide to understand consumers’ willingness to pay for socially
responsible products. They observe that more than half of the consumers are willing to pay more for responsibly produced cotton shirts. Over 57 per cent of respondents professed willingness to pay for cotton shirt made of 100 per cent US-grown cotton. Also, 55.1 per cent and 54.9 per cent of the respondents stated their willingness to pay more for an organic or a sustainable cotton shirt, respectively. An earlier survey analysis carried out with the same intention which formed a part of an unpublished thesis research by Wang (2007) observes that only 10 percent of consumers are not willing to pay a premium for organic cotton, while 30 percent are particularly willing to pay a premium. Among the survey respondents almost 52 percent of respondents were willing to pay a 50 percent premium and 25 percent of respondents were willing to pay a 100 percent premium (Wang, 2007).
Through their research, Ellis, McCracken, and Skuza, (2012) established that quality was found to be a significant variable that consumers consider during their purchase. Consumers who consider organic clothing to be higher quality than conventionally produced clothing indicate a higher WTP both conventional and organic cotton t-shirts, and also show their willingness to pay a premium for organic cotton.
In an examination of consumers’ ethical purchase decisions, Iwanow, McEachern,
branded apparel products prior to purchase, while 50 percent of consumers examine the label infrequently, and 11 percent examine the label frequently. In comparison, Hyllegard, Yan, Ogle, and Lee (2012) observe that only 8 percent of US consumers report that they never read hang tags when shopping for clothing. Twenty-three percent of consumers report that they read hang tags very frequently, 38 percent read them frequently, and 31 percent read them infrequently. The consumers who reported reading apparel hang tags do so most frequently to obtain information about brand name, care instructions, and fiber content.
However, it must be noted that price and quality have differential effects on perceived value for money. Some consumers perceive value when the price is low. Others perceive value when there is a balance between quality and price (North, De Vos & Kotzé, 2003).
Connection between Price and Product Attributes
Ha-Brookshire and Norum’s (2011) results indicate that age and gender are important demographic characteristics influencing consumers’ willingness to pay a premium for
organic and sustainable cotton shirts. Their research further suggests that younger consumers are willing to pay more for organic cottons shirts than the older. Consumers who look for simple care requirements on apparel and female consumers indicate that they are willing to pay more for sustainable cotton shirts. Moreover, consumers who emphasize color and fit when evaluating apparel products also indicate their willingness to pay more for US-grown cotton shirts.
also observe that female consumers are more likely than male consumers to read apparel hang tags and to use the information to guide their purchase decisions. Moreover, female consumers are more likely than male consumers to look for information about an apparel companies’ socially responsible business practices when reading apparel hang tags.
In their research, McGoldrick and Freestone (2008) found a weak relation between educational level and the WTP a price premium for ethically produced clothing. They conclude that demographics are poor predictors of consumers’ WTP a price premium. Similarly, Wang (2007) found no significant effect of gender, age, education level, income, or ethnicity on WTP a price premium for organic cotton. It is clear that the effect of demographic variables on a consumer’s propensity to purchase organic apparel is uncertain.
Based on the literature presented in the previous section, the following research objective is stated
CHAPTER 3
Research Methodology and Experimentation
Purpose of Research
The purpose of this research is to address the attitude-behavior gap in consumers who engage in pro-environment purchase behavior. It is aimed at profiling consumers who self-report pro-environment purchase behavior. The examination focuses on four main objectives: identifying consumer demographics, identifying the product attributes that consumers consider important, consumer attribution of responsibility and future purchase intentions. The study is designed to provide implications to practitioners and academics that will improve understanding and work towards bridging the attitude-behavior gap in the realm of green apparel purchasing.
Research Design
The research follows a quantitative approach to address the attitude-behavior gap. A secondary data set was used to provide sample data to investigate the study’s objectives. The data were provided by Cotton Incorporated’s Lifestyle Monitor which carried out
Data Collection and Sample
Using the Internet, Bellomy Research completes more than 500 interviews per month with U.S. consumers between the ages of 13 and 70. The Environment Survey which was collected over a twenty day period during spring 2013 resulted in a total of 2,000 responses. Bellomy Research designs their sampling approach to provide an accurate picture of the U.S. population by collecting monthly data from a representative set of respondents. The respondent profile is distributed across six main demographic categories (i.e., age, region, ethnicity, marital status, income and education). Specifically, Bellomy strives to model its sample as follows: Sixty percent female to better represent the textile consumer; a quarter (25%) of respondents have a household income of less than $35,000 and more than one-third (35%) with an income of $75,000 or more with a mean income for all respondents of approximately $60,000; twenty-eight percent of the respondents are college graduates. The sample data collected for the Environment Survey largely reflect this sampling approach (Survey Methodology). Prior to the analysis, an expedited review of the secondary data was approved by the NC State University Institutional Review Board for Human Subjects (Appendix B).
Measurement
The Environment Survey included a broad battery of questions related to environmental attitudes and behaviors as well as shopping preferences for apparel and demographic information. To address the study’s objectives demographic measures, a
importance continuum (0, not at all important - 10, extremely important). Attribution of responsibility was measured nominally, by simply asking respondents to indicate what party they hold responsible for non-ethical behaviors in the supply chain for apparel. Attribution of responsibility was further examined by a second nominal response question that asked subjects to select a response category that reflects their personal reaction. Future purchase intention was measured using two nominal questions which probe whether or not consumers are willing to pay more for green apparel/textiles and plan to purchase green apparel/textiles.
Statistical Analysis
The survey data was empirically investigated to address the study’s objectives.
Sample characteristics were first analyzed using descriptive statistics based on the measurement scales. The 2,000 initial responses were screened for respondents below the age of 18. Out of the 2,000 responses obtained, 152 were identified as below 18 years of age. These responses were deleted to reflect an adult population, and the new sample size was 1,848. Within these 1,848 respondents, two additional respondents were eliminated after being identified as outliers based on their level of education. Hence the final sample size obtained was 1,846. A proxy ‘behavior variable’ was further created to classify respondents based on their purchase behavior. Consumers were classified based on their purchase of apparel products labelled environmentally-friendly, recyclable and sustainable (Appendix A). Recoding of responses was performed to classify respondents who indicated pro-environment purchase behavior. The respondents who replied ‘yes’ to the purchase of either ‘environmentally-friendly’ or ‘recycled’ or ‘sustainable’ were classified as those who
not showing any pro-environment purchase behavior. There were 543 respondents who had indicated purchase of at least one of the following: environmentally-friendly, recycled or sustainable. This group constituted the pro-environment respondents. The remaining 1,303 respondents were classified as not pro-environment respondents. Thus, the proxy variable was formed and was used as the basis for the analysis.
Descriptive statistics were employed to evaluate sample characteristics. Inferential statistics including t-tests and chi-square tests were carried out to evaluate demographics, product attributes, attribution of blame and future purchase intentions. T-tests were used to evaluate the differences in the ‘pro’ and ‘not pro-environment’ behavior among continuously measured variables for demographics (RO1) as well as the importance of product attributes (RO2). Pearson’s chi-squares were used to examine the differences between pro and not
CHAPTER 4
Results
The results are presented in the following sections. Sample characteristics are first presented followed by the results of the test(s) associated with each research objective. The presentation of results concludes with a summary of the findings.
Sample Characteristics
a yearly household income of less than $35,000 while a little less than one-third (26.7%) of the respondents reported a yearly total household income of more than $ 75,000.
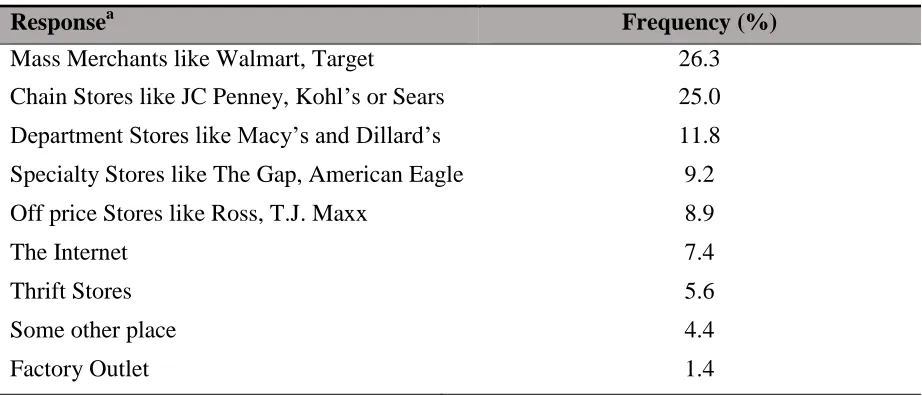
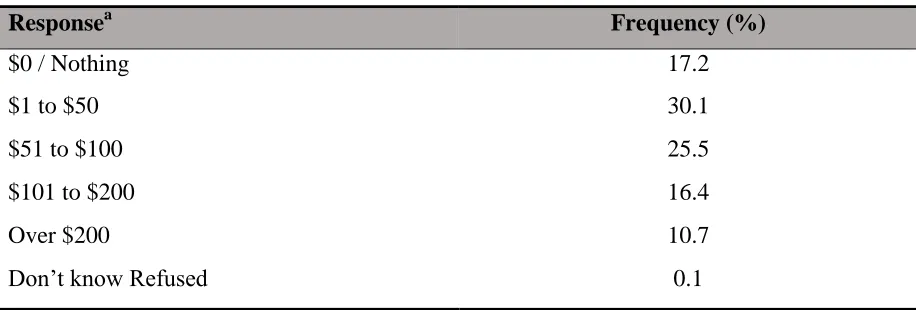
Among the sample, 17.2 percent of the respondents indicated that they had not purchased clothes for themselves in the past month. While, 52.7 percent indicated that they had spent $50 or greater on clothing for themselves in the past month, the remaining 30.1 percent of respondents had spent between $1-50 on the purchase of clothing for themselves. Also, a majority of participants (26.3%) indicated that they shopped for apparel patronizing mass merchants such as Walmart or Target. This was followed by 25 percent of participants who shopped at chain stores such as JC Penney, Kohl’s or Sears. A smaller percentage (11.8%) of participants preferred to shop in Department stores like Macy’s or Dillard’s. The
remaining participants indicated that they purchased clothes from catalogs (0.8%), off price stores (8.9%) factory outlets (1.4%), internet (7.4%) or some other place (4.4%).
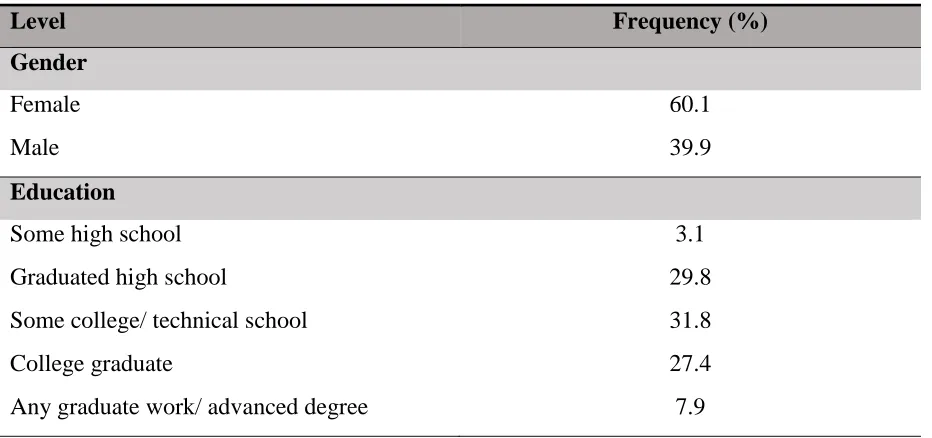
Table 1: Sample Characteristics
Level Frequency (%)
Gender
Female 60.1
Male 39.9
Education
Some high school 3.1
Graduated high school 29.8
Some college/ technical school 31.8
College graduate 27.4
Level Frequency (%) Employment Status
35 hours or more per week 48.2
Less than 35 hours per week 17.0
Retired 4.0
Not currently employed 30.8
Annual Household Income
Under $15,000 12.6
$15,000 to less than $25,000 12.3
$25,000 to less than $35,000 12.5
$35,000 to less than $50,000 16.7
$50,000 to less than $75,000 19.2
$75,000 to less than $100,000 13.1
$100,000 to less than $125,000 5.8
$125,000 to less than $150,000 2.8
$150,000 to less than $200,000 2.5
$200,000 and over 2.5
Table 2: Retail Patronage Choice
Responsea Frequency (%)
Mass Merchants like Walmart, Target 26.3
Chain Stores like JC Penney, Kohl’s or Sears 25.0 Department Stores like Macy’s and Dillard’s 11.8 Specialty Stores like The Gap, American Eagle 9.2
Off price Stores like Ross, T.J. Maxx 8.9
The Internet 7.4
Thrift Stores 5.6
Some other place 4.4
Factory Outlet 1.4
a
Table 3: Average Monthly personal Expenditure on Apparel
Responsea Frequency (%)
$0 / Nothing 17.2
$1 to $50 30.1
$51 to $100 25.5
$101 to $200 16.4
Over $200 10.7
Don’t know Refused 0.1
a
Single response question where consumers asked to choose an option which closely represents the average expenditure apparel purchase
Research Objective One: Demographics
The first objective of the research was to explore differences of demographics on respondent’s purchase of green apparel among consumers who behaved in
pro-environmentally friendly manner against those who did not behave in pro-pro-environmentally friendly manner. T-tests were carried out to analyze whether age, education, total yearly household income were different among the two groups (Table 4). The results suggest that all variables are significantly different at a .05 level of significance. Levene’s tests indicated no
Table 4: T-tests for Age, Education, Annual Household Income Mean based on
Behavior
Levene’s Test for Variance
t-test for equality of means
Not Pro Pro F p t df P
Age 39.64a 36.17 .035 .851 -6.611 1844 .000e
Education 4.02b 4.19 .643 .423 3.189 1844 .001 e Annual Household
Income
4.12c 4.64 3.505 .061 4.688 1844 .000 e
Expenditure on Clothing
2.50d 3.31 2.129 .145 13.583 1844 .000 e
Note: aAge reported in terms of years, mean sample age = 39 years, min = 18 years, max = 54 years
b
Education: 1-grade school, 2-some high school, 3-graduated high school, 4-some college/ technical school, 5-college graduate, 6-any graduate work/ advanced degree;
c
Annual Household Income: 1-under $15,000, 2 - $15,000 to less than $25,000, 3- $25,000 to less than $35,000, 4 - $35,000 to less than $50,000, 5 - $50,000 to less than $75,000, 6 - $75,000 to less than $100,000, 7 - $100,000 to less than $125,000, 8 - $125,000 to less than $150,000, 9 - $150,000 to less than $200,000, 10 - $200,000 and over;
d
Expenditure on Clothing: 1 - $0 / Nothing / None, 2 - $1 to $50, 3 - $51 to $100, 4 - $101 to $200, 5 - Over $200, 6 - Don’t know/refused
e
p<.05.
The chi-square test that examined the effect of gender on pro environmentally friendly behavior versus not pro environmentally-friendly behavior indicated a significant statistic (χ2
=45.285, p<.000) (Table 5). Interpretation of the contingency tables suggest that males are more likely to engage in pro-environment behavior (51.7%) compared to females (48.3%).
Table 5: Chi-square test for Gender
Behavior Chi-squaretest value
Not Pro Pro χ2 df p (2-sided)
Male 34.9% 51.7%
45.285 1 .000a
Female 65.1% 48.3%
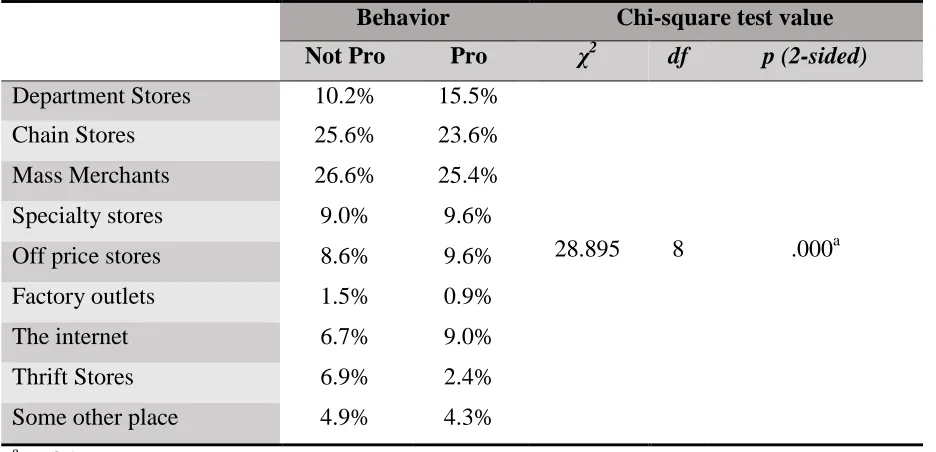
Similarly, the chi-square test that examined the differences in patronage choice between pro-environment behavior versus not pro-environment behavior groups (Table 6) indicated a significant statistic (χ2
=28.895, p<.000). Due to the complexity of the contingency table (i.e., 9 choices, 2 groups, 18 cells), post-hoc testing was performed to identify the source of differences among the two groups. Note that the post-hoc approach described in Chapter 3 employs a Bonferroni adjustment to mitigate Type I error. The post-hoc tests for retail patronage behavior among the two groups indicate that the differences arise among department store choice (χ2=10.24, p<.002) and thrift store choice (χ2
14.82, p<.000) (Appendix C, Table 1). Interpretation of the contingency table indicates that a larger proportion of pro-environment consumers choose department stores (15.5%) as a primary destination for their clothing purchases compared to the non-pro-environment consumers (10.2%). In contrast fewer pro-environment consumers appear to shop in thrift stores (2.4%) compared to the not pro-environment consumers (6.9%).
Table 6:Chi-square tests for Retail Patronage
Behavior Chi-square test value Not Pro Pro χ2 df p (2-sided)
Department Stores 10.2% 15.5%
28.895 8 .000a
Chain Stores 25.6% 23.6%
Mass Merchants 26.6% 25.4%
Specialty stores 9.0% 9.6%
Off price stores 8.6% 9.6%
Factory outlets 1.5% 0.9%
The internet 6.7% 9.0%
Thrift Stores 6.9% 2.4%
Some other place 4.9% 4.3%
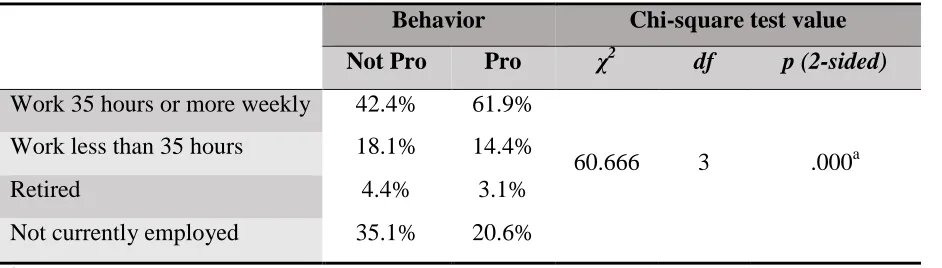
The chi-squaretest that examined employment status among pro environmental vs not pro environmental consumer groups indicated a significant statistic (χ2=60.666, p<.000) (Table 7). A post-hoc test was carried out to identify the source of differences among the two groups for employment status (Appendix C, Table 2). The results indicate that the differences arise between consumers who work 35 hours or more a week (χ2
=58.0644, p<.000) and respondents who are not currently employed (χ2
=37.5769, p<.000). Interpretation of the contingency table indicated that consumers who work more than 35 hours per week are more likely to depict pro-environment behavior (61.9%) compared to not pro-environment behavior (42.4%). In contrast consumers who are not currently employed are found to engage in purchase of not environmentally friendly green products (35.1%) compared to the purchase of pro-environment products (20.6%).
Table 7: Chi-square tests for Employment Status
Behavior Chi-square test value Not Pro Pro χ2 df p (2-sided)
Work 35 hours or more weekly 42.4% 61.9%
60.666 3 .000a
Work less than 35 hours weekly
18.1% 14.4%
Retired 4.4% 3.1%
Not currently employed 35.1% 20.6% a
p<.05
Research Objective Two: Product Attributes
environmental friendliness, fit, made in USA, durability and quality (Significant values represented graphically in Figure 3). The results suggested that there is a significant difference at a .05 level for the following product attributes: price (t=-5.789, p<.000), brand name (t=11.060, p<.000), style (t=5.550, p<.000), environmental friendliness (t=12.873, p<.000), made in USA (t=7.318, p<.000), durability (t=5.276, p<.000) and quality (t=5.286, p<.000) (Table 8). Levene’s tests indicated no evidence against homogenous subsets, therefore the tests were interpreted without adjustment. Results indicate that not environment consumers were more price sensitive (mean=8.82) compared to the pro-environment consumers (mean=8.33) for the purchase of apparel. Pro-pro-environment consumers considered brand name more important (mean=6.66) as compared to the not-pro-environment consumers (mean=5.00) for the purchase of apparel.
Table 8: T-test for Product Attributes Mean based on
Behaviora
Levene’s Test for Variance
t-test for equality of means
Not Pro Pro F P t df p
Price 8.82 8.33 25.062 .000 -5.789 1844 .000b
Brand Name 5.00 6.66 5.137 .024 11.060 1844 .000
Style 7.76 8.37 32.738 .000 5.550 1844 .000
Environmental
Friendliness 5.03 6.82 5.237 .022 12.873 1844 .000
Fit 9.17 9.11 0.006 .937 -0.768 1844 .443
Made in USA 5.53 6.65 0.399 .528 7.318 1844 .000
Durability 8.28 8.72 23.133 .000 5.276 1844 .000
Quality 8.44 8.87 33.199 .000 5.286 1844 .000
a
Likert scale of 0-10 where 0 – not at all important, 10 – extremely important bp<.05
Figure 3: Graph of Product Attributes
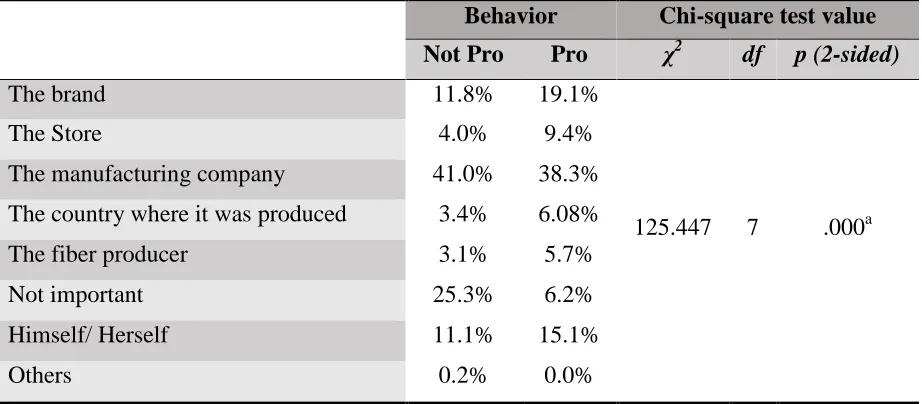
Research Objective Three: Attribution of Responsibility
The chi-squaretest to examine attribution behavior among the two groups upon the respondent’s recognition that an apparel item purchased was produced in a non-environmentally friendly way indicates a significant statistic (χ2
=125.447, p<.000) (Significant values represented graphically in Figure 4). A post-hoc test (Appendix C, Table 3) was carried out to identify the source of differences among the two groups in terms of attribution behavior.
The results indicated that the differences arise among consumers who blame the brand (χ2
=17.139, p<.000) and the store (χ2=21.252, p<.000). Also there is a difference among consumers who do not consider this issue important (χ2
Table 9: Chi-square test for Attribution of Responsibility
Behavior Chi-square test value Not Pro Pro χ2 df p (2-sided)
The brand 11.8% 19.1%
125.447 7 .000a
The Store 4.0% 9.4%
The manufacturing company 41.0% 38.3% The country where it was produced 3.4% 6.08%
The fiber producer 3.1% 5.7%
Not important 25.3% 6.2%
Himself/ Herself 11.1% 15.1%
Others 0.2% 0.0%
a p<.05
Figure 4: Graph of Attribution of Responsibility
The chi-square test that examined consumers’ reaction towards a purchased apparel product which is not environmentally friendly, indicates a significant difference among the groups (χ2
=172.239, p<.000) (Table 10) (Significant values represented graphically in Figure 5). For consumers’ reaction towards a purchased apparel item which is not environmentally
0% 5% 10% 15% 20% 25% 30%
The brand The Store Not important
F
re
qu
ency
Attribution of Responsibilty
Not Pro
friendly, post-hoc tests indicate that there is a significant difference among the groups for being extremely bothered (χ2
=148.108, p<.000) and for not being bothered at all (χ2=68.062, p<.000) (Appendix C, Table 4). Not surprisingly, the pro-environment consumers (32.6%) are extremely bothered over the purchase of apparel that is not environmentally-friendly and would likely take some action (e.g. complain to the retailer or manufacturer). On the other hand a small fraction of not pro-environment consumers (9.6%) indicate being extremely bothered about the event. In contrast, a major fraction of not pro-environment consumers mention that they would not be bothered in such an event (36.1%) while a smaller fraction of pro-environment consumers (16.76%) indicate that they would not be bothered.
Table 10: Chi-square test for Attribution of Responsibility (Reaction)
Behavior Chi-square test value Not
Pro Pro χ
2
df p (2-sided)
Extremely bothered and would take some sort of action like complain to the
retailer/manufacturer
9.6% 32.6%
172.239 2 .000a May be bothered but would probably not do
anything 54.3% 50.64%
Would not be bothered 36.1% 16.76%
a
Figure 5: Graph of Attribution of Responsibility (Reaction)
Research Objective Four: Future Purchase Intentions
The chi-square test to examine the willingness to pay a higher price for clothing or home textiles with different labels between the pro-environment group versus the not pro- environment group indicates a significant statistic for the following labels: Environmentally friendly (χ2=326.99, p<.000), made in USA (χ2=97.52, p<.000), compostable (χ2
=234.08, p<.000), recycled (χ2
=257.15, p<.000), sustainable (χ2=306.12, p<.000) (Table 11) (Figure 6). Within the willingness to pay more for clothing or home textiles with different labels, a post-hoc test was carried out to identify the source of differences among the two groups (Appendix C, Table 5). The results indicate that a higher percent of pro-environment consumers are willing to pay more for clothing or home textiles labelled ‘environmentally friendly’ (65.6%) in comparison to not pro-environment consumers (22.6%). Whereas, a
higher percent of not pro-environment consumers state that they are not willing to pay more 0%
5% 10% 15% 20% 25% 30% 35% 40%
Extremely bothered and would take some action
Would not be bothered
Reaction
Not Pro
for clothing or home textiles labelled ‘environmentally friendly’ (50.4%) in comparison to
pro-environment consumers (28.9%). In addition respondents who indicated ‘Don’t know’ were more likely to be among the not environment group (27.0%) compared to the pro-environment group (5.5%). Similar results are observed for products labelled ‘Made in USA’ where 69.6 percent pro-environment consumers indicate their willingness to pay more
in contrast to 46.1 percent of not pro-environment consumers. Moreover, higher percentages (37.1) of not environment consumers are unwilling to pay more in comparison to pro-environment consumers (25.8%). A considerable 16.8 percent of not-pro-pro-environment consumers were unsure and answered ‘don’t know’ in comparison to 4.6 percent environment consumers. For textile products labelled ‘compostable’ 41.3 percent
pro-environment consumers indicate their willingness to pay more in contrast to 10.8 percent not pro-environment consumers. A high 60.1 percent of not pro-environment consumers indicate that they are not willing to pay more for clothing or home textiles labelled ‘compostable’ in
comparison to 45.7 percent pro-environment consumers. Yet again, a considerable 29.1 percent of not pro-environment consumers were not sure and choose to respond ‘don’t know’ in comparison to 13.1 percent pro-environment consumers. For clothing or home textiles labelled ‘recycled’, 47.7 percent of pro-environment consumers indicate their willingness to
pay more in contrast to 14.0 percent not pro-environment consumers. A high 60.8 percent of not pro-environment consumers indicate that they are not willing to pay more for clothing or home textiles labelled ‘recycled’ in comparison to 44.2 percent pro-environment consumers.
indicate their willingness to pay more in contrast to not pro-environment consumers (21.7%). Moreover a higher percent of not pro-environment consumers (49.2%) are unwilling to pay more in comparison to pro-environment consumers (29.7%). Yet again, a considerably high 29.1 percent not pro-environment consumers replied a ‘don’t know’ indicating their lack of involvement in contrast to 7.4 percent pro-environment consumers.
Table 11: Chi-square test for Willingness to Pay More
Behavior Chi-square test value Not Pro Pro χ2 df p (2-sided)
Environmentally Friendly
Yes 22.6% 65.6%
326.995 2 .000a
No 50.4% 28.9%
Don’t know 27.0% 5.5%
Made in USA
Yes 46.1% 69.6%
97.521 2 .000
a
No 37.1% 25.8%
Don’t know 16.8% 4.6%
Compostable
Yes 10.8% 41.3%
234.086 2 .000a
No 60.1% 45.7%
Don’t know 29.1% 13.1%
Recycled
Yes 14.0% 47.7%
257.156 2 .000
a
No 60.8% 44.2%
Don’t know 25.2% 8.1%
Sustainable
Yes 21.7% 63.0%
306.120 2 .000
a
No 49.2% 29.7%
Don’t know 29.1% 7.4%
Figure 6: Graph of Willingness to Pay More
A second chi-square test to examine the future purchase intentions for clothing or home textiles with different labels among the pro environmental versus not pro environmental consumers indicates a significant statistic for the following labels: Environmentally friendly (χ2=412.573, p<.000), made in USA (χ2
=134.572, p<.000), compostable (χ2=365.432, p<.000), recycled (χ2
=370.606, p<.000), sustainable (χ2=398.218, p<.000) (Table 12) (Figure 7). For the future purchasing intentions for apparel or home
0% 10% 20% 30% 40% 50% 60% 70% 80% Yes No Do n 't K n o w Yes No Do n 't K n o w Yes No Do n 't K n o w Yes No Do n 't K n o w Yes No Do n 't K n o w
Sustainable Recycled Compostable Made in USA Environment
Friendly
Willingness to Pay More
Not Pro
textiles with different labels, a post-hoc test was carried out to identify the source of differences among the two groups (Appendix C, Table 6). The results indicate that a higher percent of pro-environment consumers intend to purchase apparel or home textiles labelled ‘environmentally friendly’ (80.7%) within the next year in comparison to not
pro-environment consumers (30.2%). Whereas, a higher percent of not pro-pro-environment consumers (20.6%) state that they do not intend to purchase apparel or home textiles labelled ‘environmentally friendly’ within the next year in comparison to pro-environment
consumers (11.8%). A major percent of not pro-environment consumers (49.2%) mention that they do not know if they will engage in purchase of apparel or home textiles labelled ‘environmentally friendly’ within the next year. Similar results are observed for clothing or
home textiles labelled ‘Made in USA’ where a major proportion of 82.1 percent pro-environment consumers indicate their intentions to purchase within the next year in contrast to 57.7 percent of not environment consumers. A good part of 31.1 percent of not pro-environment consumers mentioned that they do not know if they will engage in such purchases in the future. For apparel or home textiles labelled ‘compostable’ 51.6 percent
pro-environment consumers indicate their intentions to purchase in the near future in contrast to 12.6 percent not pro-environment consumers. Not much difference was observed between the two groups for intention to purchase textile products labelled ‘compostable’ as 29.3 percent of not pro-environment consumers indicated no intentions to purchase similar to 29.1 percent pro-environment consumers. A major proportion of not pro-environment consumers (58.1%) had not decided if they intended to purchase textile products labelled ‘compostable’ in
future in contrast to 18.6 percent not environment consumers. The percentage of not pro-environment consumers (28.6%) was higher compared to pro-pro-environment consumers (23.9%) for not intending to purchase such apparel in near future. Moreover, a high percentage (52.8%) of not pro-environment consumers said they did not know if they would buy apparel or home textiles labelled ‘recycled’ within the next year. Similar results are observed for apparel or home textiles labelled ‘Sustainable’ where a higher percent of
environment consumers (71.5%) indicate their intentions to purchase in contrast to not pro-environment consumers (23.6%). Moreover more not pro-pro-environment consumers (22.2%) indicate that they do not intend to purchase sustainable apparel or home textiles compared to pro-environment consumers (16.0%). A major proportion of not pro-environment consumers (54.2%) had not decided if they intended to purchase apparel or home textiles labelled ‘sustainable’ in contrast to pro-environment consumers (12.5%).
Table 12: Chi-square test for Future Purchase Intention
Behavior Chi-square test value Not Pro Pro χ2 df p (2-sided)
Environmentally Friendly
Yes 30.2% 80.7%
412.573 2 0.000a
No 20.6% 11.8%
Don’t know 49.2% 7.5%
Made in USA
Yes 57.7% 82.1%
134.572 2 0.000
a
No 11.2% 11.6%
Don’t know 31.1% 6.3%
Compostable
Yes 12.6% 51.6%
365.432 2 .000a
No 29.3% 29.1%