SIMULATION STUDIES
ON
ELECTROPHORETICALLY
DETECTABLE
GENETIC VARIABILITY IN A FINITE
POPULATION1
TOMOKO OHTA AND M O T 0 0 KIMURA
National Institute of Genetics,
Mishima,
JapanManuscript received May 30, 1973 Revised copy received October 17, 1973
ABSTRACT
Using a new model of isoalleles, extensive Monte Carlo experiments were performed to examine the pattern of allelic distribution in a finite population.
In this model it was assumed that the set of allelic states is represented by dis- crete points on a one-dimensional lattice and that change of state by mutation occurs
in
such a way that an allele moves either one step in the positive direc- tion or one step in the negative direction on the lattice. Such a model was con- sidered to be appropriate for estimating theoretically the number of electro- phoretically detectable alleles within a population. The evenness of allelic distribution was measured by the ratio of the effective to the actual number of alleles (n,/n,).
The results of the Monte Carlo experiments have shown that this ratio is generally larger under the new model of isoalleles than under the conventional KIMURA-CROW model of neutral isoalleles. In other words, the distribution of allelic frequencies within a population is expected to be more uniform i n the new model. By comparing the Monte Carlo results with actual observations, it was concluded that the observed deviation from what is pre- dicted under the new model with selective neutrality is not in the direction of conforming to the overdominance hypothesis but is, in fact, in the opposite direction.is now well known that abundant genetic variability exists i n natural popu-
‘?ations
at the enzyme level. I n analyzing theoretically the underlying mecha-
nism f o r the maintenance of such variability, the “infinite allele model” pro-
posed
by
KIMURA
and CROW (1964) has been used extensively.
In
this model,
every mutant allele that arises
at a locus represents a new allelic state not pre-
existing in the population. Recently, EWENS (1972) and
JOHNSON
(1972),
for
example, tried to test selective neutrality of protein polymorphisms by investi-
gating if observed allelic distributions deviate significantly
from
what is expected
from this model; if the observed distribution of allelic frequencies within a popu-
lation tends
to
be more uniform than expected, “balancing selection”
is
suggested.
I n such a n application, the model may be appropriate if the variability can be
detected
at
the level
of
amino acid
site o r
nucleotide site, since there are
so
many
ways
a
gene (cistron) can mutate to produce
a
new allele.
1 Contribution No. 968 from the National Institute of Genetics, Mishima, Shizuoka-ken, 411 Japan.
616
T. OHTA A N D M. KIMURAHowever, in the ordinary studies of variability using electrophoretic methods,
the basic assumption of the model may not be met completely, because these
methods can only detect a difference in the electric charges of molecules as
discrete bands on the gels.
If
a n amino acid substitution occurs in the molecule
which causes a charge difference the band usually moves one “step” in either
the positive or negative direction. For this reason we have recently proposed
a
new model of allelic mutation in which mutational change is represented as a
stepwise movement on
a
one-dimensional lattice
(
OHTA and
KIMURA
1973).
Simple as it might seem, this new model turned out
to
be mathematically much
less tractable than the previous
KIMURA-CROW
model. However, we have been
able to obtain a simple formula f o r the “effective” number of alleles maintained
in a finite population at equilibrium. From this it has been shown that the
effective number of alleles for this model is much smaller than expected from
the previous model when in both cases the product of mutation rate and the
population number is large.
In
the present paper we present some results of Monte Carlo experiments
showing that the pattern of allelic distribution is also different under the new
isoallelic model. Then we shall discuss the bearing of these results on actual
observations
of
the genetic variability a t the enzyme level.
The Model of stepwise produciion of alleles
It may be convenient to express the entire set of allelic states by integers. We assume that if an allele changes its state by mutation, the change occurs in such a way that it moves either one step i n the positive direction or one step in the negative drection in the state space. To
facilitate both the mathematical treatment and the Monte Carlo experiments, we regard the in- finite number of allelic states corresponding to the integers as a limit attained by making the number ( n ) of possible allelic states indefinitely large in the finite model where allelic states are arranged on a circle (Figure I ) , In our previous report we have shown that when n is suf- ficiently large, the effective number of neutral alleles maintained in a finite population, or the reciprocal of the sum of squares of allelic frequencies, is
n e = 1‘1 + 8 N e u , (1)
where N , is the effective population size and U is the mutation rate per gamete for neutral alleles
(OHTA and KIMURA 1973). By comparing this with the corresponding formula, i. e.
for the model of KIMURA and CROW (1964), we can see that the present model gives a much smaller number of alleles when Neu is large, although both formulae give similar results when
N,u is small. Also, in one of our previous reports (KIMURA and OHTA 1973) the essential feature of the new model was briefly explained in graphical form in our discussion of the sequential ar- rangement of rare and common electrophoretic alleles on the gels. In this model, it was assumed that one positive and one negative change i n charge cancel each other, leading the allele back to the original state. An actual example of such changes is given by the work of HENNINC and
YANOFSKY (1963) on the electrophoretic mobility of mutants of the A protein of tryptophan synthetase of E . coli: mutant protein AI 1 moves i n the negative direction; mutant A46 moves in the positive direction; but the mobility of the double mutant is identical to that of the wild- type protein.
S I M U L A T I O N O F VARIABILITY
61
7
order of the electrophoretic mobility. He claims that this observation is against the neutral hypothesis of
KIMURA
(1968). BothMAYNARD
SMITH
(1972) andKIMURA
andOHTA
(19731, however, pointed out thatBULMER’S
observation is compatible with the neutral theory if we con- sider a stepwise production of alleles.BULMER’S
observation suggests that this type of mutational scheme should be taken into account i n the theoretical analyses of electrophoretically detectable variability.More recently,
KING
(1 973) considered the possibility that the number of electrophoretically detectable alleles i n a large population is controlled by the number of finite variable sites in the molecule rather than by the finite population size. H e thinks that the osbserved pattern ofpolymorphisms agrees with this hypothesis.
In the present paper we shall investigate the effect of finite population size on the pattern
of allelic distribution using the model of stepwise production of alleles.
Monte Carlo Experiments
Since the mathematical form of the frequency distribution of alleles has not been obtained, we resorted to extensive Monte Carlo experiments t o find out several statistics relating to the distribution. In particular, the ratio of the effective to the actual (or average) number of alleles is investigated in detail, since this ratio semes as an index to represent evenness of allele dis- tribution.
Each generation of the experiment consisted of mutation and sampling. Mutational changes were carried out deterministically. Namely, if xi be the frequency of the i-th allele, then the change in zi by mutation is given by
U
A z i = - ( ( z i + , + ~ i ~ ~ - 2 2 2 , ) . 2
Since the allelic states are arranged on a circle (Fig. I ) , the first and the last states are neighbor- ing states and are connected by mutational change. The total number of allelic states assumed was either 50 or 80. These are sufficient t3 simulate the model, since the number of segregating alleles in each generation in our experiments turned out t o be a small fraction of the total num- ber of states assumed.
v/
2
‘3
618
T. O H T A A N D M. KIMURAThe sampling of gametes was performed following the scheme used by
HILL
and ROBERTSON (1966), i. e., one gamete with the i-th allele is sampled if the uniform random number falls inthe interval,
2
xi-
2
xi. The sampling was repeated 2N, times to produce the gene pool ofthe next generation. This is essentially a haploid model, but since no selection was practiced, pairing of gametes to produce zygotes was not required in our simulation of the distribution of allelic frequencies within a population.
We made three sets of experiments. In the first set, the average values of parameters such as the effective number ( n e ) and the actual number (n,) of alleles and their ratio (n,/n,) were cbtained. Each experiment started from a homogeneous population, and the allele numbers were counted from the 10lst generation onward until the 210c)th generation. Thus, each experimental outcome is the average of 2000 genereations.
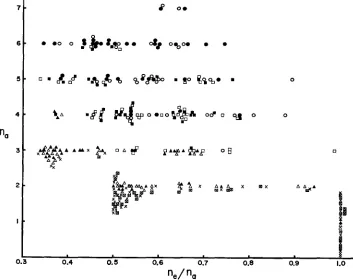
Figure 2 illustrates the outcome of this set of experiments and it shows the relationship be- tween the average of the actual number of alleles
(n,)
and the average of the ratio of the effec- tive to the actual number of alleles ( n e / n a ) . As mentioned already, this ratio serves as an indi- cator for the evenness of the allelic distribution: if this ratio is small, uneven distribution due to the presence of many rare alleles is suggested, whereas if the ratio is large, more uniform dis- tribution is suggested. Balancing selection such as overdominance will tend to make the allelic distribution more uniform. Each m i n t in the figure represents the result of one experimental run. Three levels of population size (50, 100 and 200) were employed, and a t each populationsize, the mutation rate ( U ) was varied to make 19 values of N,u (0.1, 0.2,
.
. .
0.9, 1.0, 2.0, 3.0,. .
.
,
10.0). So, there are 19x
3=
57 output points in all. Of these, circles are f o r N e=
50,squares are for N e
=
100 and triangles for N e=
200.From the figure, it can be seen that the average ratio, ne/na mostly stays around 0.6 and is relatively little influenced by the mean actual number of alleles, ,:n although there is a slight decrease a t the neighborhood of
ny=
5.0. This is in contrast to the conventional isoallele model of KIMURA and CROW, in whichn,/n,
is expected to decrease steadily with increasing<
(cf.i i-1
j=1 j=1
-
I
I 5 t
L .
0.5 0.6 0.7
“e /no
FIGURE 2.-Results of Monte Carlo experiments, showing the relationship between the aver- age of the actual number of alleles (ria) and the average of the ratio of the effective to the actual number of alleles (ne/nu). Each point is the average of 2000 generations. Circles represent the results for N e
=
50, squares for N e=
100 and triangles for N e=
200. The values of N,u range from 0.1 to 10.0 for each value of Ne.SIMULATION O F VARIABILITY
619
KIMURA
and CROW 1964; JOEENSON 1972). I t may also be noticed that this ratio is larger in the present model than in the model ofKIMURA
and CROW. In the latter, the average ratio is less than 0.5 ifny
is larger than 2.In the second set of experiments, allelic frequencies are counted starting from the generation 500 a t an interval of 500 generations and the results a t each counting, rather than the average values, are examined. A larger population size, i. e., N e
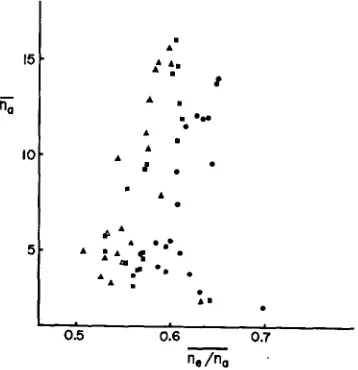
=
103, was assumed and at each counting a small sample of 100 was extracted. The sample statistics were calculated and compared with the population parameters. Four levels of mutation rate ( U=
10-3, 5x
le4,
10-4 and 5 X were used.Each experiment, starting from a homogeneous population, was continued until the genera- tion 10,000. Then, with the same mutation rate, the experiment was repeated, giving the total of
40 outputs.
Figure 3 shows the results of this set of experiments, illustrating directly the relationship between n,/n, and
n,.
Each point represents an individual outcome, circles for U=
10-3, squares for U=
5
x
10-4, triangles for v=
10-4 and crosses for v=
5
x
10-5. In the figure, solid (black) circles etc. represent those for the population, with open (white) circles etc. for the sample. Fort
!
4
"a
:
i
I
<
0
0 .0
0
0.4 0.5 0.6 0.7 0.8 0.9 1.0
ne/
"a620
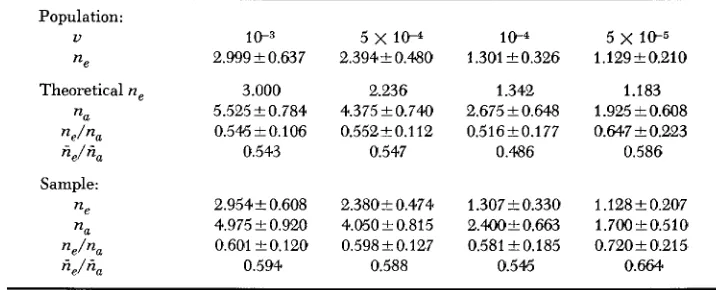
T. OHTA A N D M. KIMURATABLE 1
Summary of the results of the Monie Carlo experiment shown in Figure 3'
Population:
U 1 0 ' 3 5
x
1 0 - 4 10-4 5x
10-5ne 2.999 rfr 0.637 2.394+ 0.480 1.301 rfr 0.326 1.129 rfr 0.210
Theoretical ne 3.000 2.236 1.342 1.183
n, 5.525 rfr 0.784 4.375 & 0.744) 2.675 & 0.648 1.9% i 0.608 0.546 k 0.106 0.552t 0.1 12 0.516 rfr 0.177 0.647k 0.223
fi,/fi, 0.54-3 0.547 0.486 0.586
Sample:
ne 2.954t0.608 2 . 3 8 0 t 0.474 1.307t0.330 1.128k 0.207
nu 4.975t0.920 4.050rfr0.815 2.400rfr0.663 1.700+0.510
ne/% 0.601 rfr0.120 0.598k0.127 0.581k0.185 0.7201k0.215
f i e / % 0.594 0.588 0.545 0.664
~~~
*
The averages and the standard errors of n,, n, and n,/n, are shown.the case of U
=
5x
10-5, crosses represent population values and crossed squares the sample values. As expected, the ratio ne/nu is larger in the sample than in the population, since the population may contain rare variant alleles missed by a sample. Also there is negative correla- tion between n, and n,/n, for a given mutation rate. In other words, if the mutation rate is kept constant, the ratio is negatively correlated with nu. However, as seen from Figure 2, if the out- puts from a wide range of mutation rates are plotted together (simulating the cases when ob- servations from different gene loci are mixed) and the average values compared, little correla- tion appears between these two.Tables 1 and 2 present the results embodied in Figure 3 in more detail. The average and the standard error of ne, n, and ne/n, are listed in Table 1. All the figures are the averages of 40 ob- servations from simulation experiments. Theoretical values of n, (same for the population and the sample) are given for comparison and they agree quite well with experimental results. The average ratio, n,/n, is about 0.6 in the sample, whereas it is about 01.55 in the population. In Table 2 the observed ratio, ne/n, (given by the mean and the standard error), is listed for each value of n,, ranging from 1 to 7. The number in parenthesis is the number of observations. From the table, it can be seen that the average ratio decreases with increasing nu for each set of param- eters (except for nu
=
7, for which we have only four observations and therefore subject to large error). In other words, the ratio gets smaller when more alleles happen to be segregating merely by chance. For example, when nu=
3, the average ratio (ne/n,) in the sample is 0.473 for N,u=
0.1 but it is 0.677 for N,u=
0.5. Note here that the actual allele number of three ( n u=
3) represents the number above average for N,u=
0.1, hut below average for N,u=
0.5. The range of n, for a given mutation rate should also be noticed: we have, as n, values for the population, 4-
7, 3-
6, 1-
4 and 1-
3 corresponding to N,u=
1.0, 0.5, 0.1 and 0.05, respectively. These ranges are narrower than those observed under the KIMURA-CROW model (cf. KIMURA 1968).The third set of experiments was designed to examine the effects of population size while keeping the product N,u constant: Namely, assuming N,u
=
0.5, two levels of N , (200 and 2000) were chosen to find out the effect of change in population size. Population parameters such as ne,n, or n,/n, were examined at the interval of 5001 generations for the case of N e
=
20001 and of50 generations f o r N e
=
200. Simultaneously, a sample of size 100 was extracted to calculate sample statistics. The experiments were run for 20,000 generations with N ,=
2,000, and for 2,000 generations with N ,=
200. Table 3 shows the averages (with standard errors) of n,,n,and np/nu of these experiments. In both cases, the average ratio (n,/n,) for the sample turned out
to he about 0.56 and no significant effect of population size was detected. This ratio should also
-
-
SIMULATION O F VARIABILITY
621
0 0
0 0
13
0 0
.
.
.
.
.
.
.
.
.
.
.
.
622
T. OHTA AKD M. KIMLTRATABLE 3
Results of experiments showing the effect of population size'
~~~ ~~ ~
N, = 2000 N e = 200
Population Sample Population Sample
n e 1.94320.320 1.930+ 0.301 2.432k0.644 2.42420.673
na 3.950k 0.669 3.50020.592 4.40020.970 4.32520.877
n J n a 0.496L0.065 0.56ffL0.092 0.56020.119 0.563L0.120
*
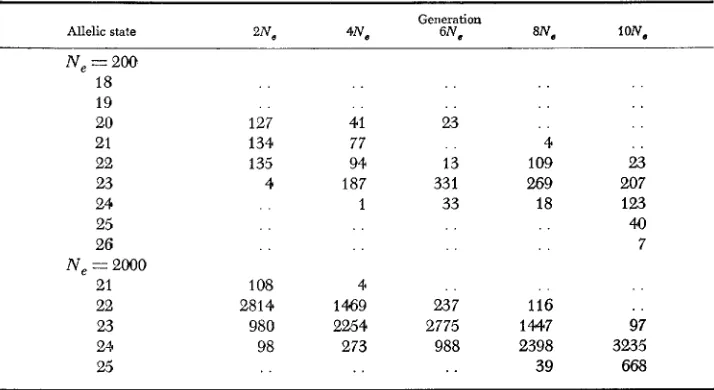
The averages and the standard errors are based on 40 outputs made every N,/4 generations continued total of lON, generations.TABLE 4
Pattern of allelic distribution
in
the third sets of experiments*Allelic state " N ,
Generation
6N, lON,
Ne
=
200 18 19 20 21 22 23 24 25 26 Ne=
2OQO21 22 23 244 25 127 134 135 4 . . 1 08 2814 980 98 41 77 94 187 1 4 1469 2254 273
. .
23 13 33 1 33 . . 237 2775 988 4 109 269 18 . . 116 1447 2398 39. .
23 207 123 40 7 . . 97 3235 668*
The experiments started from a single genotype (21st allele).be compared with the results of previous sets of experiments. I n all cases the average ratio falls in the range 0.5
-
0.6 for N,v=
0.2-
1 .O, with the exception of the case N e=
50.Table 4 gives some examples from the third set of experiments t o show the typical pattern of arrangement of the alleles. In almost all cases, the most common alleles are clustered in the
middle of the sequence flanked by less common alleles, and this pattern is identical with that of the observed protein polymorphisms (BULMER 1971).
DISCUSSION
One important conclusion drawn from the present study
is
that the ratio
n,/n,
SIMULATION O F VARIABILITY
623
the middle of the sequence. The observed values of
ne/na
lie somewhere around
0.5
-
0.6.
This pattern is identical with that predicted by KING (1973), who
assumes that the number of alleles is controlled by the number of finite accept-
able sites within a cistron. He lists the equilibrium frequency distribution with
various numbers of acceptable sites (Table 1 of KING 1973). The ratio
n,/n,,
assuming the sample size of
50,
turned out to be mostly about
0.55
from his table,
which is very close to our result. Thus, a very similar pattern of allelic distribu-
tion within a population is expected, whether the restriction is due to finiteness
of
variable sites in a cistron, or is due to finite population size with stepwise
production of alleles with infinite possible allelic states.
Compared with the present (step allele) model, the conventional model of
KIMURA
and
CROW
differs in three respects: first. in the K-C model, common
alleles are not necessarily in the middle of the sequence o n electrophoretic gels.
This is against BULMER’S
observation. Secondly, the ratio
ne/na
is smaller,
because a new mutant is produced from every member of allelic series currently
existing in the population, resulting in many rare alleles. Thus, the average ratio
is less than
0.5
if
n, 2
3 (KIMURA
and CROW
1964;
JOHNSON
1972).
Finally, the variation
of
the allele number
( n e
o r
n,)
for a given mutation rate
is less in the present model than in the KIMURA-CROW
model. For example,
n,
varied frcm 3 to 6 f o r
N,u
=0.5
in our experiments, whereas it varied from
2
to 10 for
N,u
=
0.25
in KIMURA’S
experiment, which used the KIMURA-CROW
model
(KIMURA
1970). Generally, in the present model the standard deviation
of n,
is likely to be less than 1 as shown in Table 1, but it is not so in the KIMURA-
CROW
model. I n fact, it is noted from Table
2
that
n,
seldom bacomes more than
3
when
N,u 5
0.1. Thus, under the step-allele model,
if
many alleles (e.g.,
nu
2
4)
are observed in a sample of about 100, it is unlikely that
N,v
is small
(e.g.,
N,v
i
0.1).
Do
the observed data agree with the new model? Unexpectedly. as shown by
KIRBY
and
HALLIDAY
(1973) and by YAMAZAKI
and MARUYAMA
(1973)
,
as far
as the ratio
(n,/n,)
is concerned, the observed values from enzyme polymor-
phisms seem to agree well with the conventional KIMURA-CROW
model. These
authors have made a n extensive compilation and statistical analysis of published
data on enzyme polymorphisms. They have shown that the average ratio
(n,/n,)
stays around 0.4
-
0.5
i€
n,
2
3. In other words, there exist more rare alleles
than would be expected from our new model, at least for the cases of
nu
2
4.
It
is possible that none
of
the above models
is
satisfactory to describe the real situa-
tion. Another possibility is that the observed polymorphisms are not equilibrium.
I n this event some of the rare alleles may be on their way to a n increase in their
frequency. Still another possibility is that some of the rare alleles are not selec-
tively neutral, but are very slightly disadvantageous and therefore no increase is
possible. In fact O’BRIEN, WALLACE
and MACINTYRE
(1972) reported that the
“null” allele
at
the a-glycerophosphate dehydrogenase-1 locus of
Drosophila
melanogaster
is deleterious.
624
T. OHTA A N D M. KIMURAdecreasing the ratio,
n,/n,.
Evidently very slightly deleterious mutations whose
selection coefficient
is
comparable with the mutation rate will decrease this ratio.
In
contrast with this type of selection, overdominance and other balancing selec-
tions will tend to increase the ratio. This is because these alleles spend longer
time in the middle range of their frequencies rather than in the extreme fre-
quencies, unless the equilibrium point itself lies in the extremities. Thus, unless
one assumes overdominance with extreme equilibrium frequencies, as a general
phenomenon, the observed deviation is in the opposite direction to what is
expected from the overdominance hypothesis. W e would like to add that this
inference applies to the average behavior of many polymorphisms; the presence
of overdominance o r other balancing selection is not excluded in particular cases.
Also,
“associative overdominance” due to linked selected loci is apparently not
effective in increasing the ratio.
As
pointed out by
OHTA (1973), it
probably
works only as an inertia against sudden local perturbation of gene frequencies,
although it can not create any directed pressure.
L I T E R A T U R E C I T E D
BULMER, M.
G.,
1971 EWENS, W. J., 1972HENNING,
U. and C. YANOFSKY, 1963HILL, W. G. and A. ROBERTSON, 1966
JOHNSON, G. B., 1972
KIMURA, M., 1968
Protein polymorphism. Nature 234: 410-411.
The sampling theory of selectively neutral alleles. Theoret. Pop. Biol. 3:
An electrophoretic study of mutationally altered A pro-
The effect of linkage on limits to artificial selection.
Evidence that enzyme polymorphisms are not selectively neutral. Nature 87-1 12.
teins of the tryptophan synthetase of Escherichia coEi. J. Mol. Biol. 6: 16-21.
Genet. Res. 8 : 269-294.
New Biology237: 170-171.
-,
1970 Stochastic processes in population genetics, with special reference to distribution of gene frequencies and probability of gene fixation. pp. 178-209. In: Mathematical Topics in Population Genetics. Edited by K. KOJIMA. Springer-Verlag, Berlin.
KIMURA, M. and J. F. CROW, 1964 The number of alleles that can be maintained in a finite population. Genetics 49: 725-738.
KIMURA,
M.
and T. OwrA, 1973 Mutation and evolution at the molecular level. Genetics 73:s19-35. KING, J. L., 1973
KIRBY, G. C. and R. B.
HALLIDAY,
1973MAYNARD SMITH, J.,
OBRIEN, S. J., B. WALLACE and R. J. MACINTYRE, 1972
Evolutionary rate at the molecular level. Nature 217: 624-626.
Isoallele frequencies i n very large populations. Genetics (In press.) Another view of neutral alleles in natural populations. Nature 241 : 463-464.
1972 Protein polymorphism. Nature New Biology 237: 31.
The a-glycerophosphate cycle in Dro-
a-glycerophosphate
Effect of linkage on behavior of mutant genes in finite populations. Theoret.
A model of mutation appropriate to estimate the number of
Evidence that enzyme polymorphisms are selectively
Corresponding editor: R. ALLARD sophila melanogaster. 111. Relative viability of ‘‘null’’ mutants a t the
dehydrogenase-I locus. Am. Naturalist
106:
767-771.Pop. Biol. 4: 145-162.
electrophoretically detectable alleles in a finite population, Genet. Res. 22 : 201-204.
neutral. Nature New Biology 245: 140-141. OHTA, T., 1973
OHTA, T. and M. KIMURA, 1973