ABSTRACT
KLIMSTRA, RYAN LAW. Wildlife Use of Native Warm-season and Non-native Cool-season Grass Forage Fields. (Under the direction of Christopher E. Moorman).
Concurrently, several small mammal and bird species associated with native early successional plant communities have declined. Establishment of native warm-season grass (nwsg) fields has been proposed as a strategy to provide wildlife habitat and diversify forage production, yet monocultures of nwsg may offer poor-quality habitat for birds and small mammals. Changes in small mammal and avian populations associated with changes in forage production systems could alter the ecological services they provide (e.g., seed dispersal and prey).
We measured territory density and reproductive effort for eastern meadowlark
(Scurnella magna), grasshopper sparrow (Ammodramus savannarum), field sparrow (Spizella pusilla), and indigo bunting (Passerina cyanea) in 7 nwsg forage fields (4 hayed and 3
Eastern meadowlark territory density was at least 2 times greater in csg grazed fields than other field types and increased with field size. Grasshopper sparrow territory density did not differ among field types but increased with field size. Field sparrow territory density was at least 2.5 times greater in wildlife fields than in all other field types, and indigo bunting territory density was greater in nwsg hayed and wildlife fields than in other field types and increased with field size. Cotton rat abundance estimates were greater in wildlife fields than in nwsg hayed and csg hayed fields. Abundance of white-footed mouse and house mouse did not differ among field types. Also, we radio-collared 12 cotton rats, of which 1 was killed by haying equipment and 2 died of predation following dispersal out of recently hayed fields. Visual obstruction near ground (<0.5 m) generally was greater in wildlife fields and nwsg fields than in csg fields. Forb coverage was greater in csg grazed and wildlife fields than in nwsg and csg hayed fields and leaf litter an thatch coverage were greater in csg hayed and wildlife fields than in nwsg fields.
Wildlife Use of Native Warm-season and Non-native Cool-season Grass Forage Fields
by
Ryan Law Klimstra
A thesis submitted to the Graduate Faculty of North Carolina State University
in partial fulfillment of the requirements for the degree of
Master of Science
Fisheries, Wildlife, and Conservation Biology
Raleigh, North Carolina 2013
APPROVED BY:
_______________________________ ______________________________ Christopher E. Moorman Craig Harper
DEDICATION
BIOGRAPHY
ACKNOWLEDGMENTS
This thesis would not have been possible without the guidance and support from countless individuals. I thank my committee chair, Chris Moorman, for taking a chance with me and helping me stick with this to the very end. Thanks to committee members Clyde Sorenson and Craig Harper for providing invaluable suggestions and comments throughout my entire graduate career. Jeff Marcus deserves special recognition for his help with funding, training, study design, and logistics. Johnny Riley was instrumental in gaining access to study fields and developing relationships with landowners. Lisa Gatens, Ben Hess, Bryan McLean, and Bianca Lopez from the NC Museum of Natural Science provided small
mammal trapping support. Without their help the small mammal portion of this study would not have been possible. Thanks go to Fikret Isik and Sarah Converse for statistical guidance and support.
I would like to thank my funding sources for this research, the North Carolina
My fellow graduate students provided the life-line to sanity and reality. Justin and Charlie, thank you! I look forward to our future adventures and reliving the past. Lastly, I thank my family for their unwavering love and support. Mom, Dad, Jon, Erin, without you all I would not be the person I am today and I certainly would not have been able to pursue my dreams. Mom and Dad, I love you with all my heart, and thank you for the sacrifices you have made to make my life better! Thank you for believing in me!
TABLE OF CONTENTS
LIST OF TABLES ... vii
LIST OF FIGURES ... ix
BREEDING SONGBIRD USE OF NATIVE WARM-SEASON AND NON-NATIVE COOL-SEASON GRASS FORAGE FIELDS Abstract ...1
Introduction ...2
Methods...4
StudyArea ...4
Bird Survey Methods ...5
Vegetation Sampling ...6
Statistical Analysis ...7
Results ...8
Discussion ...9
Management Implications ...11
Acknowledgments...12
Literature Cited ...13
SMALL MAMMAL USE OF HAYED NATIVE WARM-SEASON AND NON-NATIVE COOL-SEASON GRASS FORAGE FIELDS Abstract ...25
Introduction ...26
Methods...28
Study Area ...28
Small Mammal Trapping ...29
Telemetry...30
Vegetation Sampling ...31
Statistical Analysis ...32
Results ...34
Variation in Abundance ...34
Telemetry...34
Vegetation ...36
Discussion ...36
Management Implications ...39
Acknowledgments...39
LIST OF TABLES
BREEDING SONGBIRD USE OF NATIVE WARM-SEASON AND NON-NATIVE COOL-SEASON GRASS FORAGE FIELDS
Table 1. Model results from a generalized linear mixed model analysis of variance comparing songbird territory density among native warm-season grass hayed, native warm-season grass grazed, cool-season grass hayed, cool-season grass grazed, and wildlife fields (NC, 2009-2010) ...17 Table 2. Model results from binomial logistic regression comparing modified Vickery
index levels among native warm-season grass hayed, native warm-season grass grazed, cool-season grass hayed, cool-season grass grazed, and wildlife
fields (NC, 2009-2010) ...19 Table 3. Mean profile board (Nudds) vegetation density estimates (i.e., 1= 0-25%, 2=
26-50%, 3= 51-75%, 4= 76-100%) and an index of cover for native warm-season grass (nwsg), cool-warm-season grass (csg), and wildlife fields (NC, 2009-2010). Means in the same row followed by the same letter were not different
(p≥0.05). Standard errors are in parentheses ...20
SMALL MAMMAL USE OF HAYED NATIVE WARM-SEASON AND NON-NATIVE COOL-SEASON GRASS FORAGE FIELDS
Table 1. Total captures of cotton rat, white-footed mouse, and house mouse in native warm-season grass, non-native cool-season grass, and wildlife fields in NC,
2009 and 2010. Capture totals do not include re-captures ...43 Table 2. Cotton rat model results where D=mean density of individuals ha-1 across all
fields, N.tot=abundance estimate of individuals across all fields, b.dist=distribution, b.seas[1-3]=year and trapping period,
b.treatment[1]=warm-season grass, b.treatment[2]=cool-season grass, and
psi=y-intercept (wildlifefields) ...44 Table 3. White-footed mouse model results where D=mean density of individuals ha-1
b.dist=distribution, b.seas[1-3]=year and trapping period,
b.treatment[1]=warm-season grass, b.treatment[2]=cool-season grass, and
psi=y-intercept (wildlife fields) ...45 Table 4. House mouse model results where D=mean density of individuals ha-1 across
all fields, N.tot= abundance estimate of individuals across all fields, b.dist=distribution, b.seas[1-3]=year and trapping period,
b.treatment[1]=warm-season grass, b.treatment[2]=cool-season grass, and
psi=y-intercept (wildlife fields) ...46 Table 5. Radio-collar transmitter tracking histories for 12 hispid cotton rats captured in
hayed native warm-season grass (nwsg) and wildlife fields during summer of
2010 in the western piedmont of North Carolina, USA...47 Table 6. Mean profile board (Nudds) vegetation cover estimates (i.e., 1= 0-25%, 2=
26-50%, 3= 51-75%, 4= 76-100%) and percent cover indices for native warm-season grass (nwsg), non-native cool-warm-season grass (csg), and wildlife fields. Means in the same row followed by the same letter were not different
LIST OF FIGURES
BREEDING SONGBIRD USE OF NATIVE WARM-SEASON AND NON-NATIVE COOL-SEASON GRASS FORAGE FIELDS
Figure 1. Mean territory density (± SE) for eastern meadowlark (A), grasshopper sparrow (B), field sparrow (C), and indigo bunting (D) in native warm-season grass (nwsg), cool-season grass (csg), and wildlife fields based on a minimum of 8 visits per individual field (NC, 2009-2010). Means followed by the same
letter were not different (p≥0.05) ...22
SMALL MAMMAL USE OF HAYED NATIVE WARM-SEASON AND NON-NATIVE COOL-SEASON FORAGE FIELDS
Figure 1. Point estimates (Mode) and credible intervals for cotton rat (A), white-footed mouse (B), and house mouse (C) in native warm-season grass (WSG), non-native cool-season grass (CSG), and wildlife fields (Wild) based on two trapping period in NC, 2009 and 2010. Point estimates with overlapping
BREEDING SONGBIRD USE OF NATIVE WARM-SEASON AND NON-NATIVE COOL-SEASON GRASS FORAGE FIELDS
Abstract
Establishment of native warm-season grass (nwsg) fields has been proposed as a strategy to provide avian habitat and diversify forage production, yet monocultures of nwsg may offer poor-quality food and cover for some bird species. We measured territory density and reproductive effort for eastern meadowlark (Scurnella magna), grasshopper sparrow (Ammodramus savannarum), field sparrow (Spizella pusilla), and indigo bunting (Passerina cyanea) in 7 nwsg forage fields (4 hayed and 3 grazed), 7 non-native cool-season grass (csg) forage fields (4 hayed and 3 grazed), and 3 nwsg-forb fields managed for wildlife (“wildlife” fields) during May-August 2009 and 2010. Eastern meadowlark territory density was at least 2 times greater in csg grazed fields than other field types and increased with field size. Grasshopper sparrow territory density did not differ among field types but increased with field size. Field sparrow territory density was at least 2.5 times greater in wildlife fields than in all other field types, and indigo bunting territory density was greater in nwsg hayed and wildlife fields than in other field types and increased with field size. Monocultures of tall nwsg do not appear to be a better alternative than csg pastures for grassland songbirds, especially eastern meadowlarks; additionally, shrubland songbirds selected nwsg-forb fields managed with less frequent disturbance than nwsg and csg forage fields. We suggest moderate grazing strategies instead of high-intensity grazing and haying may increase
Introduction
Since the mid-1900s, native grasslands have declined as a result of fire suppression and conversion to other land-uses (Heard et al. 2000). Farming transitioned from ubiquitous small family-owned farms to fewer large, commercially operated farms (Lobao and Meyer 2001). As small family farms disappeared, so did the early successional vegetative cover provided by fallow fields; modern commercial farm operations generally double or triple-crop fields, providing substantially less early successional cover (Harper and Moorman 2006). Non-native, cool-season grasses (csg), especially tall fescue (Schedonorus phoenix), were widely established for livestock grazing and hay production through the mid-1900s (Ball et al. 1996). Additionally, recent afforestation in the eastern United States has led to a reduction in grasslands (Brennan and Kuvlesky 2005). As a result of the decline in native grasslands, grassland-associated wildlife populations have declined throughout North America (Brennan 1991, Hunter et al. 2001). Concomitantly, grassland birds have
experienced broad-scale and rapid population declines, in part a result of the practices used to establish and maintain pastures and hayfields (Knopf 1994, Giuliano and Daves 2002).
(Dactylis glomerata) offer poor quality habitat for wildlife species dependent on overhead cover and an open structure at ground-level (Barnes et al. 1995, Washburn et al. 2000, Harper and Gruchy 2009a, Harper and Gruchy 2009b). These grasses produce a dense thatch layer with little bare ground, limiting access for some wildlife (e.g., foraging northern bobwhite (Colinus virginianus) broods); however, dense thatch and shorter grass heights are favorable to some grassland songbirds [e.g., eastern meadowlark (Scurnella magna)].
Conversely, some varieties of nwsg [e.g., bluestems (Andropogon gerardii or Schizachyrium scoparium) and indiangrass (Sorghastrum nutans)] produce the majority of their biomass in June and can be optimally harvested after most birds have nested (Harper et al. 2007). Therefore, nwsg may provide habitat for some bird species, but may exclude species better adapted to the vegetation structure and thatch in csg pastures.
and grass density may be much less than desirable (Harper et al. 2007). Therefore, research is needed to compare breeding songbird use among csg forage fields, nwsg forage fields, and fields managed less for forage production and more for wildlife habitat.
We compared breeding songbird use among nwsg forage fields, csg forage fields, and nwsg-forb fields managed for early succession wildlife (hereafter, “wildlife fields”). We surveyed birds in hayed and grazed forage fields, and compared songbird territory density and an index of reproductive success among the field type and forage management combinations. We hypothesized grassland songbirds would have greater territory density in csg forage fields with lower vegetation height than in nwsg fields and wildlife fields, and shrubland songbirds would have greater territory density in nwsg forage fields and wildlife fields than in csg forage fields that lack tall vegetation.
Methods Study Area
We studied breeding songbird use of forage fields during 2009 and 2010 in the western Piedmont of North Carolina on privately owned land in Iredell, Davie, Rowan, and Lincoln counties. We surveyed songbirds in 4 hayed nwsg fields (1.89-9.06 ha, =5.97 ha), 3
grazed nwsg fields (2.12-3.43 ha, =2.69 ha), 4 hayed csg fields (1.54-7.85 ha, =5.1 ha), 3 grazed csg fields (3.23-12.58 ha, =9.05 ha), and 3 wildlife fields (2.91-3.32 ha, =3.07 ha). Of the 7 csg fields, 3 hayed and 3 grazed fields were dominated by tall fescue and 1 hayed field was dominated by orchardgrass. Of the 3 csg grazed fields, 2 were moderately grazed both years and 1 was intensively grazed both years. Prior use of planted csg fields was
stands; 1 hayed big bluestem, 1 grazed big bluestem, 3 hayed switchgrass (Panicum
virgatum), and 1 grazed eastern gamagrass (Tripsacum dactyloides). One nwsg grazed field was planted as a forage production stand with a mix of little bluestem, big bluestem, and indiangrass. Grazed nwsg fields were grazed moderately until average grass height was ~25cm, then rested until average grass height returned to ~76cm. Wildlife fields were managed to maintain a mix of native grasses and forbs and to provide food and cover
resources for a variety of wildlife. However, landowners were most interested in the benefits these fields provided to white-tailed deer (Odocoileus virginianus), eastern cottontail
(Sylvilagus floridanus), and northern bobwhite. Two of the wildlife fields were planted to indiangrass, little bluestem, sideoats grama (Bouteloua curtipendula), and partridge pea (Chamaecrista spp.), and 1 was planted to switchgrass and eastern gamagrass. The
switchgrass and eastern gamagrass field was mowed in alternating thirds every year and the other 2 were burned approximately every 3 years. All nwsg fields (forage and wildlife) were planted between 2002 and 2008; thus, fields varied from 1 to 8 years since planting. The csg fields were planted between 1999 and 2007.
Bird Survey Methods
We used spot mapping (Robbins 1970, Engstrom 1988, and Ralph et al. 1993) to determine territory densities of 4 focal bird species: eastern meadowlark, grasshopper sparrow (Ammodramus savannarum), field sparrow (Spizella pusilla), and indigo bunting (Passerina cyanea). We also recorded observations of loggerhead shrike (Lanius
sample sizes for analysis. Eastern meadowlark, grasshopper sparrow, and field sparrow are listed in the North Carolina Wildlife Action Plan (NC WAP) (NCWRC 2005) as species of concern. We conducted spot mapping from 15 April – 1 August 2009 and 2010.
Simultaneous locations of all target species were recorded on a single grid map (1:2500) during each of 8 visits, and later transcribed to individual species territory maps. We assigned territories that extended beyond the boundary of the field a fraction of a territory proportional to the amount of the territory contained in the field. Also, we recorded behaviors indicating stage of the breeding cycle and calculated an index of reproductive effort (Vickery et al. 1992). We ranked breeding cycle stage according to the reproductive index described by Vickery et al. (1992) as follows: 1) establishing a territory; 2) attracting a mate; 3) building a nest and (or) laying/incubating eggs; 4) feeding nestlings; 5) feeding fledglings; 6) one successful brood and a second nest; and 7) 2 successful broods. We surveyed the entire field during each visit, and all visits on a given day were completed before 11AM (Bibby et al. 1992). Walking routes of each field came within 50 m of all points within the field (Bibby et al. 1992). We walked each field at a slow pace and varied our routes and start and finish locations to diversify the direction and timing of site visits (Bibby et al. 1992).
Vegetation Sampling
the 17 fields. Each field was stratified into 3 equal-area units, and a single transect was randomly positioned in each unit. If a transect extended outside the field, it was discarded and a new transect position was generated. We used a vegetation profile board (2.0-m tall by 30.5-cm wide with alternating colors every 25-cm the length of the board) to measure visual obstruction from 2 positions (i.e., 0-m and 15-m mark) at each transect (Nudds 1977). An observer remained at each position while the board was placed 15 m away in each cardinal direction. The observer estimated and recorded the percentage (i.e., 1= 0-25%, 2= 26-50%, 3= 51-75%, 4= 76-100%) of vegetation obscuring their view of the profile board for all eight of the 25-cm sections. We recorded centimeters of vegetation coverage by species and presence of bare ground and leaf litter directly beneath the first 5 m of each transect. This approach resulted in multiple observations of vertical plant coverage in a fixed distance within each transect and produced values greater than 5 m that we treated as an index of cover. Density scores for each 25-cm section of the vegetation profile board, an index of
cover by plant species, bare ground, and leaf litter cover were averaged for each field. We grouped plant species into 4 categories (i.e., native grass, non-native grass, forb, and woody). Statistical Analysis
calculated with excessive zero values for higher index levels. To correct for low sample size at higher Vickery index levels, we combined grasshopper sparrow and eastern meadowlark as grassland birds, and field sparrow and indigo bunting as shrubland birds. We removed wildlife fields from the grassland bird Vickery index analysis because there were no
observations in this treatment type. We collapsed Vickery index levels into 2 categories (i.e., 1,2=0 and 3,4,5,6,7=1; 0 represents a male establishing a territory and attracting a mate and 1 represents nest building or egg laying and any further advanced reproductive behavior) and used a binomial logistic regression model to test the differences in probabilities of the dichotomous Vickery index among field types. For vegetation variables, we conducted a generalized linear mixed model analysis of variance to test for differences among field types (SAS Institute Inc. Cary, NC). Models for the vegetation data included field type as a fixed effect. Vegetation profile board data were log transformed and percent cover data were square root transformed. However, we report all values for vegetation variables in their original form. We considered statistical significance at P<0.05.
Results
grasshopper sparrow, and indigo bunting territory density increased with field size, but field sparrow territory densities did not vary with field size (Table 1).
Modified Vickery levels for grassland birds and shrubland birds did not differ among field types or between years, and were not correlated to field size (Table 2).
Visual obstruction varied among field types (Table 3). In general, visual obstruction was greatest in wildlife fields and least in grazed csg fields, especially at the lower heights on the vegetation profile board.
Forbs were more prevalent in csg grazed, nwsg grazed, and wildlife fields than in nwsg and csg hayed fields (Table 3). There was less bare ground in wildlife fields than in all other field types (Table 3). There was more leaf litter and thatch in csg hayed and wildlife fields than in all other field types, and nwsg and csg grazed fields had more leaf litter and thatch than hayed nwsg (Table 3). There were few woody species present and coverage did not differ among field types (Table 3).
Discussion
Native warm-season grass forage production fields did not provide the vegetation structure selected by eastern meadowlark, but grasshopper sparrows did not appear to use forage fields based on vegetation composition or structure. Eastern meadowlarks used csg grazed fields that had shorter grass heights than nwsg fields, a moderately dense thatch layer, no woody vegetation, and high percent coverage of forbs. Native warm-season grass species in hayed and grazed fields encouraged tall, dense vegetative structure less suitable for
The vegetation structure in wildlife fields favored field sparrows and indigo buntings, but not eastern meadowlarks or grasshopper sparrows. Wildlife fields had tall, dense native grasses, greater forb coverage, and dense thatch layers, and were relatively small patches located close to woody edges. In previous studies, eastern meadowlarks did not select fields with woody vegetation and avoided fields with woody edges (Larkin et al. 2001, Coppedge et al. 2008). Indigo bunting territory densities were greatest in wildlife fields and nwsg forage fields, where perches required for singing and territory defense and field-perimeter shrubs for nesting were present (Payne 1992). Similarly, field sparrows likely used the vegetation in wildlife fields and shrubs and trees adjacent to fields for nesting (Best 1978, 1979).
Eastern meadowlark and grasshopper sparrow territory densities increased with field size, indicating some level of area sensitivity. Grazed csg forage fields (3.23-12.58 ha,
=9.05 ha) were larger on average than other field types, which could explain why
The vegetation types surrounding wildlife fields provided nesting and perching substrates required by field sparrows and indigo buntings. Although we observed these species feeding in wildlife fields, we detected the core of their territories in adjacent cover, where they likely nested. We located one field sparrow nest in a clump of big bluestem within the perimeter of a wildlife field. However, specific grass type and structure within forage fields likely was less important to field sparrow abundance in fields than the brushy structure adjacent to fields (Best 1979).
Haying and mowing removes the vegetative structure necessary for grassland
Management Implications
Acknowledgments
Funding for the project was provided by the North Carolina Wildlife Resources Commission, State Wildlife Grants, and the Fisheries, Wildlife, and Conservation Biology Program at North Carolina State University. We thank Matthew Owen and Kevin Brown for their work as field technicians. Thanks to Johnny Riley who provided excellent logistical support in the field and fostered relationships with landowners. Thanks to Chris Kreh, Mark Jones, Chris McGrath, and LeAnne Bonner for valuable input and comments on a previous draft of the manuscript. Special thanks to the landowners who allowed us to conduct this study in their forage fields, and to the North Slope Borough Department of Wildlife Management for their encouragement in publishing this study.
Literature Cited
Ball, D. M., C. S. Hoveland, and G. D. Lacefield. 1996. Southern forages, 2nd edition. Potash and Phosphate Institute. Norcross, GA, USA.
Barnes, T. G., L. A. Madison, J. D. Sole, and M. J. Lacki. 1995. An assessment of habitat quality for northern bobwhite in tall fescue-dominated fields. Wildlife Society Bulletin 23(2):231-237.
Best, L. B. 1979. Effects of fire on a field sparrow population. American Midland Naturalist 101(2):434-442.
Best, L. B. 1978. Field sparrow reproductive success and nesting ecology. Auk 95:9-22. Bibby,C. J., N. C. Burgess and D. A. Hill. 1992. Bird census techniques. Academic Press
Inc., San Diego, California, USA.
Birkhead, J. L. 2012. Avian habitat response to grazing, haying, and biofuels production in native warm-season forages in the mid-south. Thesis submitted to The University of Tennessee, Knoxville 1-72.
Brennan, L. A. and W. P. Kuvlesky, Jr. 2005. North American grassland birds: An unfolding conservation crisis? The Journal of Wildlife Management 69(1): 1-13.
Coppedge, B. R., S. D. Fuhlendorf, W. C. Harrell, and D. M. Engle. 2008. Avian
community response to vegetation and structural features in grasslands managed with fire and grazing. Biological Conservation 141: 1196-1203.
Dale, B. C., P. A. Martin and P. S. Taylor. 1997. Effects of Hay Management on Grassland Songbirds in Saskatchewan. Wildlife Society Bulletin 25(3): 616-626.
Engstrom, Todd R. 1988. The Breeding Bird Census: A half century in review. Birdscope 2(1):1 3.
Fletcher, R.F. and R.R. Koford. 2002. Habitat and landscape associations of breeding birds in native and restored grasslands. Journal of Wildlife Management 66(4):1011-1022. Giuliano, W. M. and S. E. Daves. 2002. Avian response to warm-season grass use in pasture
and hayfield management. Biological Conservation 106:1-9.
Harper, C. A., G. E. Bates, M. P. Hansbrough, M. J. Gudlin, J. P. Grunchy, P. D. Keyser. 2007. Native warm-season grasses: Identification, establishment and management for wildlife and forage production in the mid-south. University of Tennessee, Knoxville, Tennessee, USA.
Harper, C.A. and J.P. Gruchy. 2009. Managing early successional habitat. In, Burger Jr., L.W. and K.O. Evans, Mississippi State University, editors, Managing working lands for northern bobwhite: The USDA NRCS Bobwhite Restoration Project. Washington, D.C.
Harper, C.A. and J.P. Gruchy. 2009. Eradicating tall fescue and other non-native perennial cool-season grasses for improved early successional wildlife habitat. In, Burger Jr., L.W. and K.O. Evans, Mississippi State University, editors, Managing working lands for northern bobwhite: The USDA NRCS Bobwhite Restoration Project. Washington, D.C.
Harper, C. A. and C. E. Moorman. 2006. Qualifying native warm-season grasses and early succession habitat. Proceedings of Triennial National Wildlife and Fisheries
Extension Specialists Conference 11:76-80.
Department of Agriculture, natural Resources Conservation Service, Wildlife Habitat Management Institute, Technical Report, USDA/NRCS/WHMI-2000.
Helzer, C.J. and D.E. Jelinski. 1999. The relative importance of patch area and perimeter-area ratio to grassland breeding birds. Ecological Applications 9(4):1448-1458. Herkert, J.R. 1994. The effects of habitat fragmentation on Midwestern grassland bird
communities. Ecological Applications 4(3):461-471.
Horn, D.J., R.R. Koford, and M.L. Braland. 2002. Effects of field size and landscape composition on grassland birds in South-Central Iowa. Journal Iowa Academy Science 109(1,2):1-7.
Hunter, W. C., D. A. Buehler, R. A. Canterbury, J. L. Confer, and P. B. Hamel. 2001. Conservation of disturbance-dependent birds in eastern North America. Wildlife Society Bulletin. 29:440-455.
Knopf, F. L. 1994. Avian assemblages on altered grasslands. Studies in Avian Biology 15: 247-257.
Labao, L. and K. Meyer. 2001. The great agricultural transition: crisis, change, and social consequences of twentieth century US farming. Annual Review of Sociology 27:103-124.
Larkin, J. L., T. G. Barnes, M. Depoy-Smith, and D. S. Maehr. 2001. A comparison of avian communities occupying native and exotic grasslands in Kentucky: A preliminary study. Proceedings 17th North America Prairie Conference: 201-205. McIntyre, N.E., and T.R. Thompson. 2003. A comparison of conservation reserve program
habitat plantings with respect to arthropod prey for grassland birds. American MidlandNaturalist 150:291-301.
North Carolina Wildlife Resources Commission. 2005. North Carolina Wildlife Action Plan. Raleigh, NC.
Nudds, T. D. 1977. Quantifying the vegetative structure of wildlife cover. Wildlife Society Bulletin 5(3): 113-117.
Ralph, J. C., G. R. Geupel, P. Pyle, T. E. Martin, and D. F. DeSante. 1993. Handbook of Field Methods for Monitoring Landbirds. USDA Forest Service General Technical Report. PSW-GTR-144.
Ribic, C. A., M. J. Guzy, and D. W. Sample. 2009. Grassland bird use of remnant prairie and Conservation Reserve Program fields in an agricultural landscape in Wisconsin. The American Midland Naturalist 161(1):110-122.
Robbins, C. S. 1970. Recommendations for an International Standard for a Mapping Method in Bird Census Work. Audubon Field Notes 24(6): 723-726.
Roseberry, J. L. and W. D. Klimstra. 1970. The nesting ecology and reproductive performance of the eastern meadowlark. The Wilson Bulletin 82(3): 243-267. Siegel, M. R., G. M. Latch, and M. C. Johnson. 1985. Acremonium fungal endophytes of
tall fescue and perennial ryegrass: significance and control. Plant Disease Feb: 179-183.
Stauffer, D. F. and L. B. Best. 1980. Habitat selection by birds of riparian communities: evaluating effects of habitat alterations. Journal of Wildlife Management 44(1): 1-15. Vickery, P. D. and M. L. Hunter Jr. 1994. Effects of habitat area on the distribution of
grassland birds in Maine. Conservation Biology 8(4):1087-1097.
Vickery, P. D., M. L. Hunter Jr., and J. V. Wells. 1992. Use of a new reproductive index to evaluate relationship between habitat quality and breeding success. The Auk 109(4): 697-705.
Walk, J. W. and R. E. Warner. 2000. Grassland management for the conservation of songbirds in the Midwestern USA. Biological Conservation 94: 165-172.
Wiens, J. A. 1969. An approach to the study of ecological relationships among grassland birds. The American Ornithologists’ Union. Ornithological Monographs, No. 8. 1-93.
Whitmore, R. C. 1981. Structural characteristics of grasshopper sparrow habitat. The Journal of Wildlife Management 45(3): 811-814.
Table 1. Model results from a generalized linear mixed model analysis of variance comparing songbird territory density among native warm-season grass hayed, native warm-season grass grazed, cool-season grass hayed, cool-season grass grazed, and wildlife fields (NC, 2009-2010).
Territory Density Model Results
Species Variable Den_df F-value P-value
Eastern meadowlark Field Type 27 8.99 <0.001
Year 27 0.08 0.78
Field size 27 10.26 0.004
Grasshopper sparrow Field Type 27 1.41 0.26
Year 27 2.53 0.12
Field size 27 17.69 <0.001
Field sparrow Field Type 27 47.69 <0.001
Year 27 3.88 0.06
Field size 27 2.37 0.14
Indigo bunting Field Type 27 44.42 <0.001
Table 1 Continued
Table 2. Model results from binomial logistic regression comparing modified Vickery index levels among native warm-season grass hayed, native warm-season grass grazed, cool-season grass hayed, cool-season grass grazed, and wildlife fields (NC, 2009-2010).
Vickery Index Model Results
Species Variable df Wald P-value Chi-Square
Grassland birds Field Type 3 0.84 0.84 Year 1 2.06 0.15 Field size 1 0.11 0.10 Shrubland birds Field Type 4 0.90 0.92 Year 1 0.64 0.42
Table 3. Mean profile board (Nudds) vegetation density estimates (i.e., 1= 0-25%, 2= 26-50%, 3= 51-75%, 4= 76-100%) and an index of cover for native warm-season grass (nwsg), cool-season grass (csg), and wildlife fields (NC, 2009-2010). Means in the same row
followed by the same letter were not different (p≥0.05). Standard errors are in parentheses.
Treatment
Variable nwsg csg wildlife
Grazed Hayed Grazed Hayed Nudds
25cm 4.00A (0.00) 4.00A (0.00) 3.64B (0.18) 3.50C (0.10) 4.00A (0.00) 50cm 3.69A (0.16) 3.94A (0.06) 2.5B (0.40) 1.00C (0.00) 4.00A (0.00)
75cm 2.92B (0.33) 3.71A (0.11) 1.53C (0.22) 1.00D (0.00) 3.97A (0.03) 100cm 2.17B (0.37) 2.54B (0.33) 1.04C (0.06) 1.00C (0.00) 3.53A (0.19) 125cm 1.39B (0.17) 1.58B (0.24) 1.00C (0.00) 1.00C (0.00) 2.61A (0.30) 150cm 1.03B (0.03) 1.04B (0.03) 1.00B (0.00) 1.00B (0.00) 1.61A (0.34) 175cm 1.00 (0.08) 1.00 (0.00) 1.00 (0.00) 1.00 (0.00) 1.14 (0.09) 200cm 1.00 (0.00) 1.00 (0.00) 1.00 (0.00) 1.00 (0.00) 1.00 (0.00) % Grass Cover
Table 3 Continued
(2.64) (3.54) (10.94) (7.39) (0.98) Forb Cover 45.20A 16.95B 49.49A 9.98B 54.40A
(15.87) (10.64) (11.78) (6.25) (12.10) Woody Cover 0.00 2.17 0.00 0.00 0.25
(0.0) (2.00) (0.00) (0.00) (0.61) Bareground Cover
8.82A 16.72A 12.78A 7.07A 0.00B (2.63) (7.14) (7.03) (3.26) (0.00) Leaf litter/ Thatch
Cover 23.04B 1.30C 32.49B 68.67A 78.84A (7.00) (0.94) (16.20) (7.10) (11.10)
A
B
A
C
B
B
C
D
A AB
B
C B
A
C C
SMALL MAMMAL USE OF HAYED NATIVE WARM-SEASON AND NON-NATIVE COOL-SEASON FORAGE FIELDS
Abstract
A recent emphasis to establish native warm-season grasses (nwsg) for forage
production may provide resources no better for small mammals than currently is available in non-native cool-season grass (csg) forage production fields. Additionally, changes in small mammal populations associated with changes in forage production systems could alter the ecological services they provide (e.g., seed dispersal and prey). We developed a hierarchical spatially-explicit capture-recapture model to compare abundance of hispid cotton rats
(Sigmodon hispidus), white-footed mice (Peromyscus leucopus), and house mice (Mus musculus) among 4 hayed csg fields, 4 hayed nwsg fields, and 4 nwsg-forb (“wildlife”) fields managed for wildlife during 2 summer trapping periods in 2009 and 2010. Cotton rat
abundance estimates were greater in wildlife fields than in nwsg and csg fields and greater in nwsg fields than in csg fields. Abundance of white-footed mouse and house mouse
Introduction
Widespread establishment of non-native, cool-season grasses (csg) as cattle forage, conversion of native grasslands to row-crops, and the recent intensifying of agricultural practices likely has reduced habitat quality for small mammals (Bowles 1981, Kaufman and Kaufman 1989). Non-native, grass forage fields planted as dense monocultures have low plant species diversity and limited structural diversity, which limits resource availability (Collins and Gibson 1990, Sietman et al. 1994). Furthermore, haying csg forage fields dramatically changes groundcover structure and temporarily can displace individual small mammals and potentially reduce long-term population densities (Lemen and Clausen 1984, Sietman et al. 1994, Kaufman and Kaufman 2008).
woodlands, croplands, and grasslands and likely are less sensitive to variation in structure and composition connected to forage field management (Kaufman et al. 2000).
Consideration of small mammal populations in forage production systems is warranted as they play a key role as predators and prey. Small mammals fulfill important ecological services such as seed predation and serve as a prey source for larger carnivores (Korpimäki 1984, Hulme 1994). Declines in small mammal populations could lead to reduced numbers of avian and mammalian predators and alterations in seed dispersal (French et al. 1976, Korpimäki et al. 2005). Korschgen and Stuart (1972) suggested that abundant small mammal populations provide a prey source to predators, thereby reducing alternative predation of desirable game species [e.g., eastern cottontail (Sylvilagus floridanus) and northern bobwhite (Colinus virginianus)]. Although small mammals are a key component of trophic dynamics, there is limited research on the effects of forage grassland management on these species. Specific management actions associated with forage systems could
summer months; and 2) small mammal abundance would be greater in nwsg hayed fields than in csg hayed fields because of the structure produced by nwsgs, especially at ground level.
Methods Study Area
During the summers of 2009 and 2010, we documented small mammal use of forage fields in the western piedmont of North Carolina on privately owned land in Iredell and Davie counties. In 2009, we captured small mammals in 4 hayed nwsg fields (1.89-9.06 ha,
=6.18 ha), 4 hayed csg fields (1.54-9.51 ha, =6.16 ha), and 4 wildlife fields (1.62-3.32 ha, =2.71). In 2010, we captured small mammals in 4 hayed nwsg fields (1.89-9.06 ha, =5.43 ha), 4 hayed csg fields (1.54-7.85 ha, =5.10 ha), and 4 wildlife fields (1.62-3.32 ha,
landowners were most interested in the benefits these fields provided to white-tailed deer (Odocoileus virginianus), eastern cottontail, and northern bobwhite. The nwsg fields and wildlife fields were planted between 2002 and 2008, so fields varied from 1 to 8 years since planting. The csg fields were planted between 1999 and 2007, so fields varied from 2 to 11 years since planting. One wildlife field was mowed in alternating thirds every year and the other 3 were burned in 2007 and then approximately every 3 years.
Small Mammal Trapping
We captured small mammals using 50 Sherman live traps (7.6 X 8.9 X 22.9 cm)
spaced 15 m apart in a 5X10 rectangular grid (11,250 m2) at each of the 14 sites. The short side of the rectangular trapping grid was placed along the edge in all fields with the longer side extending towards the field interior. If field shape did not permit this configuration, traps were spaced evenly throughout. During both 2009 and 2010, we trapped 6 of 12 fields at a time in each of 2 trapping sessions, with ~1 week between sessions and ~3 weeks before trapping the same fields a second time. All fields, with the exception of 1 nwsg and 1 csg fields not available for trapping during 2010 and the 2 fields used as their replacements, were trapped twice May-July in 2009 and 2010. We used a combination of peanut butter and oatmeal to bait traps for 5 consecutive nights. Traps were set each afternoon and checked before 10:00 am the following morning to limit trap mortality. All captured individuals were ear tagged, weighed, and sexed. Recaptures only were identified and weighed. After
processing, we released individuals as quickly as possible. We closed traps until late
and marking of small mammals were conducted in accordance with the North Carolina State University Institutional Animal Care and Use Committee (protocol #09-071-0)
Telemetry
Vegetation Sampling
We sampled vegetation during July and August 2010. All csg and nwsg fields were hayed after seedheads were produced. We were unable to record exact haying dates because management occurred without notice when weather and the schedule of the farmer permitted. Therefore, vegetation sampling sometimes occurred after a recent haying event. We
measured vegetation structure and composition along 3 30-m transects in each of the 12 fields. Each field was stratified into 3 equal-area units, and a single transect was randomly positioned in each unit. If a transect extended outside the field, it was discarded and a new transect position was generated. We used a vegetation profile board (2.0-m tall by 30.5-cm wide with alternating colors every 25-cm the length of the board) to measure visual
Statistical Analysis
We developed a hierarchical spatial capture-recapture (HSCR) model that allowed integrated estimation and modeling of abundance. Spatial capture-recapture models (Efford 2004, Borchers and Efford 2008, Royle and Young 2008) were developed to formally account for the problem – common to many capture-recapture experiments – that the area to which abundance estimates apply is unknown. Royle and Converse (In Review) developed a formulation of SCR models to account for replicated capture-recapture experiments, in which the purpose is to model variability in abundance over space and/or time. The state-space model includes both an observation component (probability of detection) and a process component (abundance). More details can be found in Royle and Converse (In Review; see also Converse and Royle 2012).
The HSCR model includes a component that describes variation in abundance across g groups, in which N(g), the population size for group g, has a Poisson distribution with mean λ(g). Then a log-linear model of the λ(g) can be developed, such as:
log (λ(g)) = β0 + β1*X(g)
Mlogit(p(i,j,k)) = α0+ α1*d[i,k]
Where Mlogit() is the multinomial logit transform which forces p(i,j,k) to sum to one across traps and d(i,k) is the distance between the individual’s latent activity center, say s(i), and the trap location. The activity centers are assumed to have a uniform distribution over the state-space enclosing the trap array. Additional individual and/or time-specific covariate that may influence detection may also be included.
Our abundance model included fixed effects of trapping period (i.e., season) and field type. Our detection model included only the distance portion of the HSCR model (such that probability of capture in a trap is a function of distance between the trap and the individual’s latent activity center).
The implementation of the HSCR model requires specification of a region around each trapping grid which defines where individual activity centers may be located (the “state-space”). We fit the model via Markov chain Monte Carlo methods in JAGS (Plummer 2009; use of trade or product names does not imply endorsement by the US government) using the R2Jags library in the R programming environment (R Core Team 2012) using standard vague
priors for parameters. We assessed convergence based on R< 1.05 as recommended by Gelman et al. (2004).
all values for vegetation variables in their original form. We considered statistical significance at P<0.05.
Results
Variation in Abundance
A total of 6,000 trap-nights of sampling during 2009-2010 yielded 379 individual captures representing 3 small mammal species. More individuals were captured in 2009 than in 2010 (Table 1). Hispid cotton rats were the most captured species during 2009, and white-footed mice were the most captured species during 2010. House mice had the least captures in both years.
Field type had an effect on cotton rat abundance, which was greater in wildlife fields than in nwsg and csg fields and greater in nwsg fields than csg fields (based on 95% credible intervals for the 2 treatment effects not overlapping 0, and on non-overlapping 95% CIs between the 2 treatment effects; Table 2). Also, cotton rat abundance was markedly greater during trapping period 2 in 2009 (Table 2 and Figure 1A). Overall density of cotton rats was approximately 4.2 individuals ha-1.
White-footed mouse abundance was lower in wildlife fields than in both nwsg and csg (Table 3, Figure 1B). Abundance estimates in nwsg and csg fields were not different from each other. Overall density of white-footed mice was 1.2 individuals ha-1.
Telemetry
Because of management activities or predation events, we were unable to collect enough location data for individual cotton rats to determine home range or territory size. However, we suggest or determined the fate of 9 of the 12 individuals (Table 5). Of the 12 collared individuals, 6 presumed mortalities occurred. One individual (Table 5, ID 322) in a nwsg field was tracked to the belly of a black rat snake (Elaphe obsoleta obloleta) 2 days after haying (Table 5). The black rat snake was located and observed in the canopy surrounding the field for 10 consecutive days until the transmitter was passed. Another individual (Table 5, ID 460) in a nwsg field traveled to the edge of the field the same day it was hayed, and then traveled 818 m over 5 days to a drainage ditch within a 12-ha corn field where it remained for 27 days (Table 5). The transmitter was recovered 274 m away from the drainage ditch beneath a snag, which suggested avian predation. Remains from another individual (Table 5, ID 458) in a nwsg field were found torn apart by a discbine or hay tedder (Table 5). The remaining 3 confirmed mortalities occurred in a wildlife field. One
individual (Table 5, ID 442) was found 14 days after transmitter attachment with
roundworms (Nematoda) in the gut, and the other 2 individuals (Table 5, ID 495 and430) were found 15 and 18 days after attachment, partially eaten next to coyote (Canis latrans) scat.
found 8 days after attachment in a wildlife field, presumably chewed off (Table 5). The remaining 2 individuals (ID 150 and 171) survived for 22 days in a wildlife field (Table 5). Their fate is unknown because the field season ended.
Vegetation
Visual obstruction was greater in nwsg and wildlife fields than in csg fields (Table 6). Native warm-season grass and wildlife fields had less visibility from 25 cm to 125 cm than csg fields, and wildlife fields had less visibility from 75 cm to 175 cm than all other fields (Table 6). Vegetation at 150 cm and 175 cm was not different in nwsg and csg fields and there was no difference in vegetation among field types above 175 cm (Table 6).
Coverage of native grass was greater in nwsg and wildlife fields than in csg fields, and coverage of non-native grass was greater in csg fields than in nwsg and wildlife fields (Table 6). Coverage of forbs was 2.5 times greater in wildlife fields than in nwsg and 4 times greater than in csg fields (Table 6). Amount of bare ground was greater in nwsg and csg fields than in wildlife fields (Table 6). Coverage of leaf litter and thatch was greater in csg and wildlife fields than in nwsg fields (Table 6). Very little woody vegetation was present and coverage did not differ among field types (Table 6).
Discussion
Similar to wildlife fields, native warm-season grasses in forage fields provided tall, dense vegetative cover and a food source commonly selected by cotton rats; however, vegetation was never hayed in wildlife fields, so food and cover remained more continuously.
Similarly, Moorman et al. (2013) reported large numbers of cotton rat captures in field borders planted with nwsg and wildflowers that retained food and cover throughout the growing season and no captures in mowed borders where resources where removed.
House mice and white-footed mice are omnivorous and largely considered habitat generalists; therefore, plant community composition likely is of less importance to these species than it is to herbivorous cotton rats (Whitaker 1966, Randolph et al. 1991). After vegetation was hayed and little overhead cover remained in csg and nwsg fields, house and white-footed mice continued to be captured along woody field edges where they likely fed on insects and various seed-bearing plants and used the adjacent shrubs and trees for cover and travel corridors (Whitaker 1966, Baker 1968, Wegner and Merriam 1979). Moreover, nearby anthropogenic features (e.g., row crops, barns, or houses) likely supplemented both species’ diets and cover requirements and may help explain a lack of difference in abundance
estimates between forage field types. Unlike cotton rats, mice were not directly dependent on the species of grasses or forbs present in forage fields and were able to use other food and cover resources before and after fields were hayed (Whitaker 1966, Wegner and Merriam 1979, Kaufman and Kaufman 2008).
with our lack of captures of other grassland-associated small mammals that we expected to be present [e.g., meadow jumping mouse (Zapus hudsonius) and meadow vole (Microtus pennsylvanicus)]. Kaufman and Kaufman (2008) reported low or no cotton rat captures in nwsg (e.g., big bluestem, indiangrass, and little bluestem) fields before and after haying. Similarly, we estimated low cotton rat abundance in nwsg and csg hayed fields compared to wildlife fields that never were hayed. Moreover, we located the shredded remains (i.e., by mechanical means) of 1 cotton rat that we had radio-collared in a recently hayed nwsg field, which suggests direct mortality from forage harvest (Klimstra 2013). Additionally, 2 predation events on cotton rats were observed after forage harvest in nwsg fields, indicating an increased mortality risk for individual small mammals that disperse from hayed fields (Klimstra 2013). Because of the ecological value of small mammals in grassland systems, more studies are needed to directly address changes in their population dynamics caused by haying.
One important caveat to our results is that low initial capture and recapture rates made it impossible for us to model variation in detection probability across fields. In particular, our models do not account for the possibility that field type may affect the catchability of
animals, rather than or in addition to their abundance. Future research in these systems should focus on extending trap density and/or trapping period length to produce larger sample sizes of captured individuals.
Management Implications
Although it is impractical to expect producers to alter forage production systems to accommodate small mammals, a majority of the forage producers we worked with had an interest in wildlife, especially game animals, such as cottontails and northern bobwhite. Wildlife managers working with forage producers can explain the ecological role of small mammals and encourage producers to manage fields with consideration of the small mammal community. Moderately grazing forage fields as an alternative to haying can increase forb diversity and provide structure selected by some grassland songbirds, and similarly may benefit grassland small mammals (Birckhead 2012, Klimstra 2013). Incorporating both native warm-season and cool-season forage as separate but adjacent units or fields in the same forage production system will provide a continual high-quality forage resource and provide small mammals with nearby escape cover as the 2 field types should be hayed at different times. Additionally, leaving small fields or field borders unharvested will create refugia for small mammals after cover is removed from forage fields (Moorman et al. 2013).
Acknowledgments
Funding for the project was provided by the North Carolina Wildlife Resources Commission, State Wildlife Grants, and the Fisheries, Wildlife, and Conservation Biology Program at North Carolina State University. We thank Matthew Owen and Kevin Brown for their work as field technicians, the North Carolina Museum of Natural Sciences for their volunteer hours and logistical support, and the numerous volunteers who assisted in small mammal trapping. Thanks to Johnny Riley who provided excellent logistical support in the field and fostered relationships with landowners. Special thanks to the landowners who allowed us to conduct this study in their forage fields, and to the North Slope Borough Department of Wildlife Management for their encouragement in publishing this study.Any use of trade, product, or firm names is for descriptive purposes only and does not imply endorsement by the U.S. Government.
Literature Cited
Baker, R. H. 1968. Habitats and distribution. Biology of Peromyscus. (Ed. by J. A. King), Pages 98-126. Special Publication No. 2 American society of Mammalogists, Stillwater, Oklahoma, USA.
Birckhead, J. L. 2012. Avian habitat response to grazing, haying, and biofuels production in native warm-season forages in the mid-south. Thesis submitted to The University of Tennessee, Knoxville 1-72.
Borchers, D. L. and M. G. Efford. 2008. Spatially explicit maximum likelihood methods for capture-recapture studies. Biometrics 64: 377-385.
Bowles, J. B. 1981. Iowa’s mammal fauna: an era of decline. Proc. Iowa Acad. Sci., 88:38-42.
Converse, S. J. and J. A. Royle. 2012. Dealing with incomplete and variable detectability in multi-year, multi-site monitoring of ecological populations. Pages 426-442 in R.A. Gitzen, J.J. Millspaugh, A.B. Cooper, and D.S. Licht. Design and Analysis of Long-term Ecological Monitoring Studies. Cambridge University Press.
Efford, M. G. 2004. Density estimation in live-trapping studies. Oikos 106: 598–610. French, N. R., W. E. Grant, W. Grodziński, and D. M. Swift. 1976. Small mammal
energetic in grassland ecosystems. Ecological Monographs 46: 201-220.
Gelman, A., Carlin, J.B., Stern, H.S. & Rubin, D.B. (2004) Bayesian Data Analysis, Second edn. Chapman & Hall/CRC, Boca Raton, Florida, USA.
Hulme, P. E. 1994. Post-dispersal seed predation in grassland: Its magnitude and sources of variation. Journal of Ecology 82(3): 645-652.
Kaufman, D. W. and G. A. Kaufman. 1989. Nongame wildlife management: implication of small mammal use of fencerows, fields, and prairie. Transactions of the Kansas Academy of Science 92:198-205.
Kaufman, G. A. and D. Kaufman. 2008. Effects of haying on small mammals in mixed grass prairie of central Kansas. Transactions of the Kansas Academy of Science 111(3): 275- 282.
Kaufman, D. W., G. A. Kaufman and, B. K. Clark. 2000. Small mammals in native and anthropogenic habitats in the Lake Wilson area of North-Central Kansas. The Southwestern Naturalist 45(1):45-60.
Kincaid, W. B. and G. N. Cameron. 1982. Variation in three sympatric rodents on the Texas coastal prairie. Journal of Mammalogy 63(4):668-672.
Klimstra, R. L., C. E. Moorman, J. F. Marcus, C. A. Harper, and C. E. Sorenson. 2013. Breeding songbird use of native warm-season and non-native cool-season grass forage fields. Thesis. North Carolina State University, Fisheries, Wildlife, and Conservation Biology.
Korpimäki, E. 1984. Population dynamics of birds of prey in relation to fluctuations in small mammal populations in western Finland. Ann. Zool. Fennici 21: 287-293.
Korschgen, L. J. and H. B. Stuart. 1972. Twenty years of avian predator-small mammal relationships in Missouri. The Journal of Wildlife Management 36(2): 269-282. Lemen, C. A. and M. K. Clausen. 1984. The effects of mowing on the rodent community of
a native tall grass prairie in eastern Nebraska. Prairie Naturalist 16:5-10.
Moorman, C. E., C. J. Plush, D. Orr, C. Reberg-Horton, and B. Gardner. In Press. Small mammal use of field borders planted as beneficial insect habitat. Wildlife Society Bulletin.
Nudds, T. D. 1977. Quantifying the vegetative structure of wildlife cover. Wildlife Society Bulletin 5(3): 113-117.
Plummer, M. 2009. JAGS: just another Gibbs sampler. Version 1.0.3. Available at: http://mcmc-jags.sourceforge.net.
R Development Core Team. 2012. R: A language and environment for statistical computing. R Foundation for Statistical Computing, Vienna, Austria. ISBN 3-900051-07-0. Available at: http://www.R-project.org/.
Randolph, J. C., G. N. Cameron, and J. A. Wrazen. 1991. Dietary Choice of a Generalist Grassland Herbivore, Sigmodon hispidus. Journal of Mammalogy 72(2):300-313.
Royle, J. A., and K. V. Young. 2008. A hierarchical model for spatial capture-recapture data. Ecology 89(8): 2281-2289.
Royle, J. A., and S.J. Converse. In Review. Hierarchical Spatial Capture-Recapture Models: Modeling Population Density from Replicated Capture-recapture Experiments. Methods in Ecology and Evolution.
Sietman, B. E., W. B. Fothergill, and E. J. Finck. 1994. Effects of haying and old-field succession on small mammals in tallgrass prairie. The American Midland Naturalist 131(1):1-8.
Su, Y-S, and M Yajima. 2012. R2jags: a package for running jags from R. Available at: http://cran.r-project.org/web/packages/R2jags/index.html
Table 1. Total captures of individual cotton rat, white-footed mouse, and house mouse in native warm-season grass forage fields, non-native cool-season grass forage fields, and wildlife fields in NC, 2009 and 2010. Capture totals do not include re-captures.
Total Captures
Year Cotton Rat White-footed mouse House Mouse
Table 2. Cotton rat model results where D=mean density of individuals ha-1 across all fields, N.tot=abundance estimate of individuals across all fields, b.dist=distribution, b.seas[1-3]=year and trapping period, b.treatment[1]=warm-season grass, and b.treatment[2]=cool-season grass.
Model Results
Model Effects Mode Mean C.I.
Lower Upper D 4.17 4.22 3.43 5.15 N.tot 646.85 654.68 533.00 800.00 b.dist -1.32 -1.32 -1.56 -1.08 b.seas [1]a -0.17 -0.18 -0.59 0.21 b.seas [2]a 2.04 2.07 1.82 2.34 b.seas [3]a -0.79 -0.81 -1.29 -0.36 b.treatment [1] -1.79 -1.79 -2.16 -1.44 b.treatment [2] -3.48 -3.54 -4.38 -2.83
a
Table 3. White-footed mouse model results where D=mean density of individuals ha-1 across all fields, N.tot=abundance estimate of individuals across all fields, b.dist=distribution, b.seas[1-3]=year and trapping period, b.treatment[1]=warm-season grass, and
b.treatment[2]=cool-season grass.
Model Results
Model Effects Mode Mean C.I.
Lower Upper D 1.19 1.20 1.04 1.39 N.tot 128.03 128.92 112.00 150.00 b.dist -1.76 -1.79 -2.10 -1.51 b.seas [1]a 0.35 0.34 0.01 0.67 b.seas [2]a 0.21 0.20 -0.15 0.54 b.seas [3]a -0.09 -0.12 -0.51 0.24 b.treatment [1] 2.05 2.17 1.34 3.13 b.treatment [2] 1.42 1.51 0.66 2.50
a
Table 4. House mouse model results where D=mean density of individuals ha-1 across all fields, N.tot= abundance estimate of individuals across all fields, b.dist=distribution, b.seas[1-3]=year and trapping period, b.treatment[1]=warm-season grass, and b.treatment[2]=cool-season grass.
Model Results
Model Effects Mode Mean C.I.
Lower Upper D 0.00 1.23 -0.73 2.02 N.tot 235.24 259.12 153.00 427.00 b.dist -1.05 -1.03 -1.52 -0.57 b.seas [1]a -0.08 -0.09 -0.55 0.73 b.seas [2]a 1.36 1.40 0.92 1.96 b.seas [3]a 0.22 0.27 -0.32 0.88 b.treatment [1] 3.84 4.32 2.31 7.21 b.treatment [2] 2.26 2.56 0.42 5.51
a
Table 5. Radio-collar transmitter tracking histories for 12 hispid cotton rats captured in hayed native warm-season grass (nwsg) and wildlife fields during summer of 2010 in the western piedmont of North Carolina, USA.
Tracking History
Individual ID Sex Field Type Dates Collared Date Hayed Fate
322 F nwsg 6/16-7/6 6/23 predation by black rat snake 460 M nwsg 6/19-7/26 6/20 avian predation
458 M nwsg 6/18-6/22 6/20 mortality by harvest equipment 451 M nwsg 6/18-7/1 6/20 collar found in nearby brush 430 F wildlife 7/1-7/15 n/a found 1 m from coyote scat 495 F wildlife 7/2-7/13 n/a predation/half eaten
391 F wildlife 6/28 n/a collar not attached securely 392 F wildlife 7/2-7/15 n/a unknown
442 F wildlife 6/29-7/12 n/a gut filled with round worms 456 F wildlife 7/1-7/3 n/a collar chewed off
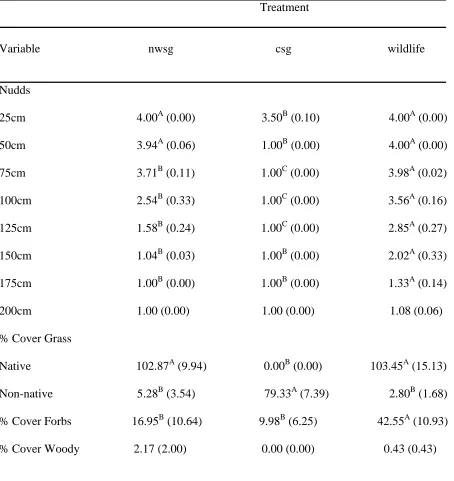
Table 6. Mean profile board (Nudds) vegetation cover estimates (i.e., 1= 0-25%, 2= 26-50%, 3= 51-75%, 4= 76-100%) and percent cover indices for native warm-season grass (nwsg), non-native cool-season grass (csg), and wildlife fields. Means in the same row followed by the same letter were not different (p≥0.05). Standard errors are in parentheses.
Treatment
Variable nwsg csg wildlife
Nudds
25cm 4.00A (0.00) 3.50B (0.10) 4.00A (0.00) 50cm 3.94A (0.06) 1.00B (0.00) 4.00A (0.00) 75cm 3.71B (0.11) 1.00C (0.00) 3.98A (0.02) 100cm 2.54B (0.33) 1.00C (0.00) 3.56A (0.16) 125cm 1.58B (0.24) 1.00C (0.00) 2.85A (0.27) 150cm 1.04B (0.03) 1.00B (0.00) 2.02A (0.33) 175cm 1.00B (0.00) 1.00B (0.00) 1.33A (0.14) 200cm 1.00 (0.00) 1.00 (0.00) 1.08 (0.06) % Cover Grass
Table 6 Continued % Cover
Bare ground 16.72A (7.14) 7.07A (3.26) 0.00B (0.00) % Cover