ISSN (Online) : 2319 - 8753
ISSN (Print) : 2347 - 6710
I
nternationalJ
ournal ofI
nnovativeR
esearch inS
cience,E
ngineering andT
echnologyAn ISO 3297: 2007 Certified Organization, Volume 2, Special Issue 1, December 2013
Proceedings of International Conference on Energy and Environment-2013 (ICEE 2013)
On 12th to 14th December Organized by
Department of Civil Engineering and Mechanical Engineering of Rajiv Gandhi Institute of Technology, Kottayam, Kerala, India
PAVEMENT DISTRESSES AND ROUGHNESS
MODELING
–
A CASE STUDY
Saranya Ullas, Sreelatha T, B.G Sreedevi
M Tech Scholar, RIT, Kottayam India Asst.Professor, RIT Kottayam India Director, NATPAC, Thiruvananthapuram, India
ABSTRACT
Pavement deterioration is very complex. It involves structural fatigue as well as functional distresses. It results from the interaction between traffic, climate, material and time. Deterioration is the term used to represent the change in pavement performance overtime. The ability of the road to satisfy the demands of traffic and environment over its design life is referred to as performance. Due to the great complexity of the road deterioration process, performance models are the best approximate predictors of expected conditions.
In this study main distresses were identified from the selected road stretches. Regression models are then developed using SPSS (Statistical packages for social sciences) package.
1. INTRODUCTION
It is necessary to provide a good road network for the development of any country. India has the second largest highway and road networks system on the world. Thetotal length of roads in the country exceeds 3.01 million kilometers. There is a great need for the effective and efficient management and maintenance of the road network. The funding available for periodic maintenance and management system is limited. In order to determine the most economical strategies, most essential input is development of deterioration models for structural and functional conditions of flexible pavements. Pavement performance is a function of its relative ability to serve traffic over a period of time (Highway Research Board,1962). Due to the great complexity of the road deterioration process, performance models are the best approximate predictors of expected conditions.
2. OBJECTIVES OF THE STUDY
Evaluate the functional condition of flexible pavements;
To develop performance prediction models using SPSS package;
To test the reliability of model using T- test;
To develop a model for determination of Riding Comfort Index (RCI);
3. LITERATURE REVIEW
Large numbers of studies have been conducted globally for developing pavement performance models. Pavement performance models are of three types namely distress characteristics based models, pavement performance rating models and models based on environmental factors. Regression can be either linear or non linear. When more than one variable is included in the deterioration model, multiple linear regression or non-linear regression is resorted to (Gupta et al.).
Different techniques available for developing pavement deterioration models were reviewed. Regression technique is empirical in nature and it tries to build a relationship between the pavement condition and its causative factors. The reliability of a regression model is measured by its goodness of fit, in terms of co-efficient of determination ( R2 value).
Mathew et al.(2008) developed deterioration models for ravelling initiation and progression, pothole progression, roughness progression and edge failure using neural network and regression techniques. The ANN models were compared and found to be more suitable to the rural roads as compared with the conventional empirical statistical models.
Sreedevi et al.(2011) conducted Field performance indicators for NRMB in a tropical setting. Pavement performance indicators for road sections constructed using Natural Rubber Modified Bitumen and Ordinary bitumen operating under identical conditions has been derived from periodic field data collection and analysis.
Study on decision support system for performance based maintenance management of highway pavements was done by Muralikrishna and Veeraragavan(2011). Deterioration models were developed for deflection progression and roughness progression. One set of data was used for the validation process, done by chi-square test.
Reddy et al (2005) developed flexible pavement preservation framework for an integrated asset management. In this study methodology integrates pavement condition data management, pavement performance and its standards to generate pavement preservation program. Riding Comfort Index (RCI) has been established to determine the preservation needs. Various maintenance management tools were derived as part of this study.
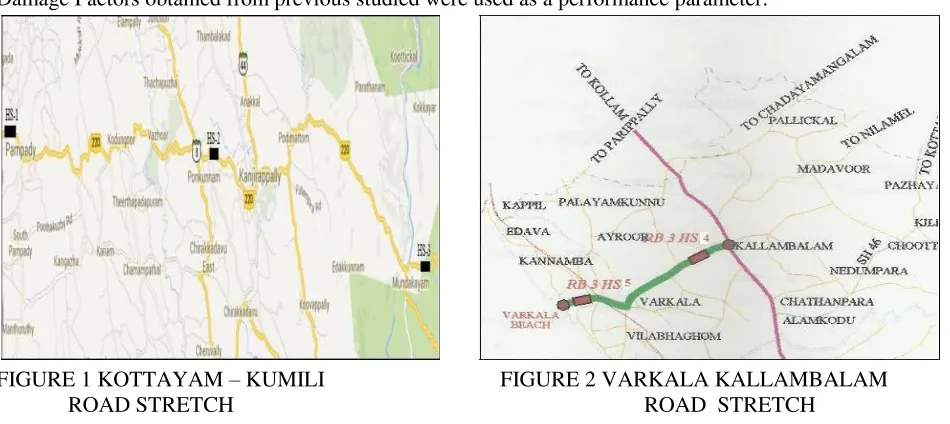
4. STUDY AREA
TABLE 1
DETAILS OF STUDY STRETCHES
Sl Name of Cate No of Terrain No the Road gory Homogenous
Sections with chainage
1 Kottaya NH HS-1(118-119) Plain m- HS-2(141-142) Plain Kumili HS-3(180-181) Hilly 2 Kallamb ODR HS-4 Plain
alam- HS-5 Plain
Varkala
5.DATA COLLECTION
Data collection was done by taking out five representative sections each of length 1km from the study roads. Eleven sets of data were already available from previous studies. Additional one set was collected in this year.
5.1 Pavement Construction History Data
Pavement history data collected in this study include Pavement layer details, time of maintenance or strengthening etc. The surface layer details during the first set of data collection are shown in the Table 2:
5.2 Structural Condition Data
The structural condition data collected for the study include road inventory data and CBR value. Vehicle Damage Factors obtained from previous studied were used as a performance parameter.
FIGURE 1 KOTTAYAM – KUMILI FIGURE 2 VARKALA KALLAMBALAM
TABLE 2 PAVEMENT LAYER DETAILS OF STUDY ROADS
Study Stretch
Pavement Layer details in the year
2003
Kottayam –
250mm WBM + 50mm BM + 40 mm
Kumili Road BC
Varkala –
200mm WBM + 70mm BM + 40mm
Kallambalam BC
5.3 Road inventory data: In the road inventory data details of pavement type, terrain, carriage way
width, pavement drainage characteristics, land use etc are taken.
5.4 California Bearing Ratio : Field investigation andlaboratory tests were conducted on the sub grade
soil in order to determine CBR value. Soil samples were taken to laboratory in sealed containers for moisture content determination and for conducting CBR tests.
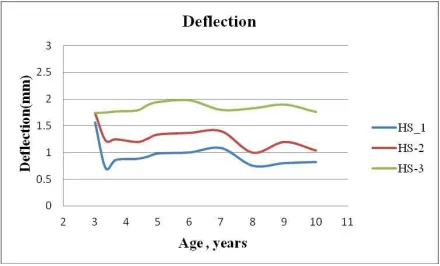
5.5 Benkelman Beam Deflection Method : Benkelmanbeam is a device used to measure the rebound
deflection of pavement. It is the most commonly used instrument and is simple and cheap. Deflections were measured at 20 points in each kilometre, staggered at 50 meter interval in both directions with truck having rear axle load of 8.17 tonnes and tyre pressure of 5.6 kg/cm2. The measurements are taken as per the procedure given in IRC:81-1997. The deflection progression of Kottayam Kumili road is shown in the Figure 2.
FIGURE 2 DEFLECTION PROGRESSION OF KOTTAYAM – KUMILI ROAD
5.5 Functional Condition Data
5.5.1 Condition Survey : Functional condition data were collected by walk survey associated with
not considered as major distress, therefore it gets eliminated. The distresses were measured in terms of their severity. The length and width of each were measured with tape. Analysis was carried out by converting it in to percentages of total carriageway affected.
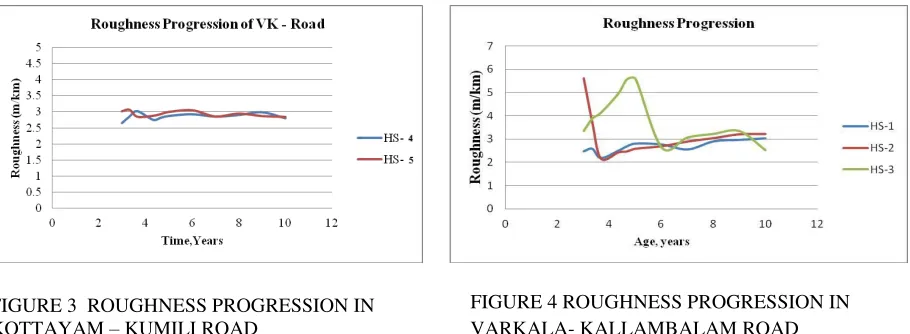
5.5.2 Roughness survey : Roughness of pavement is an indication of its riding quality and level of
service. The fifth wheel bump integrator was used for the roughness measurement. The vehicle was driven through the test sections and bumps were measured. With the fifth wheel bump integrator the value obtained is in mm/km. The data obtained from fifth wheel bump integrator is converted to standard roughness value (IRI in m/km) using calibration equation. The roughness progressions in Kottayam Kumili road and Varkala Kallambalam road during last ten years were shown in the Figure 3 and 4 below.
FIGURE 3 ROUGHNESS PROGRESSION IN KOTTAYAM – KUMILI ROAD
The basic statistics of performance parameters are shown in the Table 3 below. The performance parameters along with minimum, maximum, mean and standard deviation of each parameter are listed below.
TABLE 3 STATISTICS OF PERFORMANCE PARAMETERS Parameter Minim Maxim Mean Standa
um um rd
deviati on Cracking area(%) 0.000 5.800 0.133 0.790
Pothole area(%) 0.000 0.976 0.160 0.310
Roughness(m/km
) 2.160 5.601 3.077 0.754 Ravelling 0 6.097 0.753 1.326 MSN 2.531 5.595 4.279 0.960 VDF 1.292 4.612 2.590 1.250
Age 3 10 5.816 2.293
6. ANALYSIS AND RESULTS
Total eleven sets of data were used for the modeling purpose. One set was collected as part of the present work. Remaining sets were available from previous study. Detailed structural and functional data collected were analyzed. Main distresses were identified and models were developed.
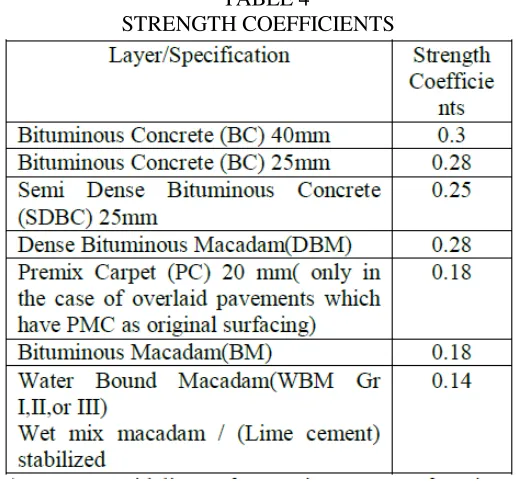
6.1 Modified Structural Number
Pavement strength was expressed in terms of Modified Structural Number (MSN). The concept of structural number was first introduced as a result of the AASHO Road test. It is a measure of total
thickness of the road pavement weighted according to the ‘strength’ of each layer and calculated as
follows:
(1) i = summation over layers
ai = a strength coefficient for each layer
di = is the thickness of each layer measured in inches
The strength coefficients suggested for different pavement materials are shown in the Table 4 below:
TABLE 4
STRENGTH COEFFICIENTS
(Source: Guidelines for maintenance of primary, secondary and urban roads)
The AASHO Road Test was constructed on a single uniform subgrade therefore the effect of different subgrades could not be estimated and the structural number could not include a subgrade contribution. Pavements of a particular structural number but built on different subgrades will therefore not carry the same traffic to a given terminal condition. To overcome this problem and to extend the concept to all subgrades, a subgrade contribution was derived by Hodges et al.,and a modified structural number defined as follows:
6.2 Riding Comfort Index
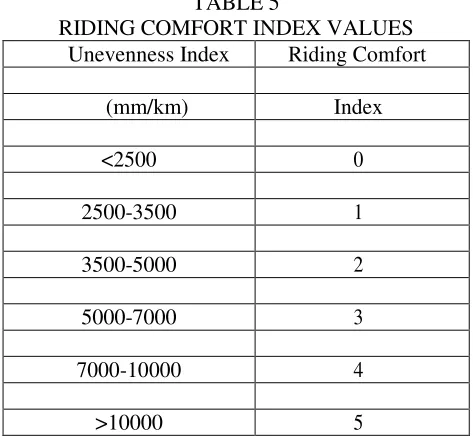
In order to determine the riding quality of pavement an index called riding quality index was developed. The first step was to classify the unevenness values different range. Range selection was based on the data collected. RCI is primarily a function of pavement unevenness and is measured on a scale of 0 to 5(Table 5). RCI of zero indicates well constructed new pavement and five represents an extremely rough pavement. If the unevenness index value of a particular pavement stretch is known, the RCI value can be obtained directly.
TABLE 5
RIDING COMFORT INDEX VALUES Unevenness Index Riding Comfort
(mm/km) Index
<2500 0
2500-3500 1
3500-5000 2
5000-7000 3
7000-10000 4
>10000 5
6.3 Regression Models
Regression models are empirical models and were developed using Statistical Packages for Social Sciences (SPSS). Models were developed for
Cracking progression : A common defect in thickbituminous surfaces is formation of cracks. Oxidation
of binder makes the bituminous surface brittle and cause cracking on the surface of the pavement. Cracks on pavement surface weaken the pavement structure. The various factors influencing cracking progression were identified as cracking initiation, deflection, vehicle damage factor and modified structural number (Eqn. (3)).
R2 = 0.977 SE = 0.367
Pothole Progression : Pothole is defined as any localized loss of material or depression in the
Roughness progression : Roughness was modeled as a function of roughness initiation, raveling area, pothole area, vehicle damage factor, modified structural number and pavement age(Eqn.(5)).
RidingComfort Index Model : The assessment of riding quality is considered to be the most
important component of pavement surface condition. Here riding quality of pavements in the form of Riding Comfort Index (RCI) has been correlated with the unevenness index values and an equation was developed.
Cr = cracking area in percentage at time t Cri = Initial cracking area in percentage Def = Deflection at time t in mm MSN = Modified Structural Number Pt = Pothole area in percentage at time t Pti = Initial pothole area in percentage RCI = Riding Comfort Index(RCI) RGi = Initial roughness in m/km RGt = Roughness at time t in m/km RV = Ravelling area in percentage at time t u = Unevenness in mm/km
VDF = Vehicle damage factor
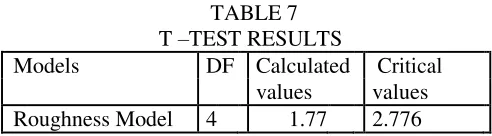
Validation of the models
Developed roughness progression model was validated with one set of data collected. The final set of data collected was used for the validation purpose (Table 6). It was not possible to validate the distresses models due to periodic maintenances. T- test was done to check the reliability of the model. The T-values observed at 5% level of significance is well below critical values hence the models are reliable (Table 7).
TABLE 6 COMPARISON OF ACTUAL AND REGRESSION PREDICTED VALUES
Study stretches Roughness (m/km) Actual Regression
model
(Predicted)
HS -1 3.02 2.99
HS -2 3.25 3.01
HS-3 2.92 2.71
HS-1 VK 2.86 2.84
TABLE 7 T –TEST RESULTS
Models DF Calculated Critical values values
Roughness Model 4 1.77 2.776
7. DISCUSSIONS
Detailed pavement condition survey on all the study stretches showed that the main distresses were pothole, ravelling and craking. Rutting was absent on these roads. Percentage of fretting was high on all road stretches. But fretting is not considered as a major distress. It may further leads to ravelling. It is very difficult to distinguish between fretting and ravelling. Thus fretting may be sometimes noted as ravelling.
Roughness values were getting lowered after maintenance works.
8. CONCLUSIONS
Detailed literature review and pavement evaluation studies were conducted on selected road stretches. The different parameters affecting the pavement performance were identified. It includes Modified Structural Number (MSN) and Vehicle Damage Factor (VDF). Non linear regression models were formulated for ravelling initiation, cracking progression, pothole progression and roughness. SPSS predicted values are nearer to observed values. Hence these models are suitable for the performance predictions of selected roads. The reliability of roughness progression models was checked by T-test.
The authors are acknowledged to Salini P.N (Scientist B,NATPAC), Wilson K.C (Scientist B, NATPAC) for their valuable suggestions and supports during the work. The authors wish to thank Dr. Padmini A.K (H O D, Civil Engineering Dept, RIT, Kottayam), Dr Bino I Koshy (Professor, RIT, Kottayam), for their overall guidance and support. Authors profusely thank the staff of NATPAC for their assistance in data collection.
REFERENCES
[1] Gupta, A., Praveen, K., and Rajat, R., 2012. “A Critical Review of Flexible Pavement Performance Models Developed for Indian
perspective”, Indian
Highways, Indian Road Congress, 40(3), pp.41-60.
[2] IRC:81-1997, Guidelines for Strengthening of Flexible Road Pavements Using Benkelman Beam Deflection Technique, Indian Road Congress.
[3] Mathew, B.S., Reshmy, D.S., and Issac, K.P., 2008. “Performance Modelling of Rural Road Pavements Using Artificial Neural
Network”, IndianHighways, Indian Roads Congress, 36(1), January, pp.31-39.
[4] Muralikrishna, P., and Veeraragavan, A., 2011.“ Decision Support System for Performance Based Maintenance Management of Highway
Pavments”, Journal of Indian Road Congress, 22(5), October – December, pp.155-167.
[5] Reddy, B.B, Sharma, R.S., and Veeraragavan, A., 2005. “Development of flexible pavement preservation framework for an integrated
Asset management.”, Journal of Indian Roads Congress, 66(1) , April , pp.383-418