Fire safety simulation of cable fire in nuclear power plant room based on
flammability database of cables
Akihiro Matsuda1
1Faculty of Engineering, Information and Systems, University of Tsukuba, Tsukuba, Ibaraki, JAPAN
INTRODUCTION
To evaluate risk of fire accidents in nuclear power plants, cable-fire accidents should be investigated significantly. Fire safety evaluation and development of fire safety evaluation method in nuclear plants have been important issues.
In this paper, the electrical safety characteristics of electric cables in nuclear plant fire were performed by flammability tests and CFD analysis. In the flammability tests, the electric power and control cable specimens of the polyethylene sheathed cables were applied. These cables were same as which had been used in the established nuclear plants.
The cable specimens of which length were 600mm, were fixed on a cable tray specimen. The temperature of the cable specimens was raised to from room temperature to over 600°C using the cone-type electrical heater. Electrical resistance and surface temperature were measured. As the results, the relationships between short-circuit time and temperature of nuclear plants cables were clarified and stored in the flammability database.
For CFD analysis, thermal configurations of a nuclear power plant room in a fire accident was calculated using the Fire Dynamics Simulator Ver. 5 (FDS5).
In the numerical simulation, an electrical switchgear rooms in nuclear plants were applied as an evaluation room model. Fire in motor control cabinet in the switchgear room on nearby cable tray was applied to the fire source. From numerical results, the heat configuration and temperature in the switchgear room was evaluated and radiation heat from fire to the cable trays was calculated.
FLAMABILITY TESTS
Flammability test machine for electrical cables was shown in figure 1. The flammability test machine was modified from the cone-calorie meter machine (Toyo Seiki Seisaku-sho, Ltd.).
Flammability test of control and power cables which were applied to the nuclear plants were conducted by the combustion test machine shown in figure.1. The small cable tray specimen with electrical cables, was able to apply to the flammability test. The capacity of load-cell device was increased from general cone-calorie meter machine to apply heavy cable tray specimens to the flammability tests. The heat chamber and cable tray specimen and state of flammability test were shown in figure 2. The diameter and maximum temperature of cone-calorie heater were 180mm and 750Υ, respectively.
Two cable specimens were installed to the cable tray specimen. Both ends of cable were fixed by plastic bands. The clearance between cable-surface and bottom of cone-heater was kept as 35mm in the flammability test.
For these tests, 4 kind of electrical cables were applied to the flammability tests. The name of cables and specification are shown in table 1. The special specifications for nuclear plans were applied to the cable specimens in Table 1. The cable specimens which include 2 conductor were applied to the tests. The
hyper electrical insulation machines is able to measure insulation resistance from 2.5MΩ to 107 MΩ.
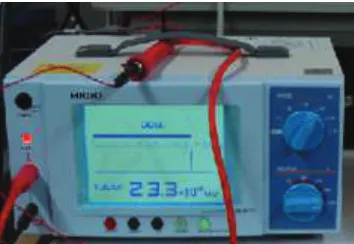
In the flammability tests, temperature of cone-heater was experimental parameter and it was kept constant for 2 hours. The surface temperatures of cable-specimen were measured by laser thermometer and thermocouples. The electrical insulations between copper conductors of cables were measured by the hyper electrical insulation machine SM-8215( Hioki E. E. Corp., in figure 3).
Flammability test results of SHCVV are shown in figure 5. From the test results of SHCVV, the insulation resistance decreases along with cable temperature going up. Sudden change of insulation resistance and electrical short were carried out, according to the high cable temperature. Safety temperature of SHCVV for 2 hours was 200Υ. When the surface temperature of the electrical cable SHCVV was higher than 200 Υ, cable specimen showed short-circuit in 2 hours. The flammability test results of SPVV, FR-STP and CCSHV are shown in figure 6, 7 and 8.
From the flammability test results of SPVV, FR-STP and CCSHV, safety temperature of these cables for 2 hours are 220Υ, 310Υ and 340Υ, respectively. Relationships between short circuit time and temperature were approximated by following equation,
(
b)
exp(
At)
s =q + q -q
-q ¥ ¥ , (1)
and experimental results and approximated results are plotted in figure 9. Here A is material parameter,
¥
q
is safe temperature,q
b is ignition temperature and t is time. Also,q
¥ andq
b of each cables are shown in table 2.Relationships between time( the short-circuit time, time the insulation resistance were 10MȐ and 100M Ȑ ) and temperature were plotted in figure 10 as the Arrhenius plots for SHCVV and SPVV.
CFD ANALYSIS OF NUCLEAR PLANTS BY FDS5
Computational fluid analysis of nuclear plant room were conducted using Fire Dynamic Simulator Ver.5 (FDS5). The dynamics of fire accident in FDS code is represented by solving a transport equations. Thermal radiation is modelled by solving the radiative transport equation.
A switchgear room in a BWR was selected for the numerical simulation. This room was supposed to locate in the reactor building of a BWR. Geometry of switchgear room and FDS modelling are shown in figure 11. The cable tray was filled with polyethylene insulated cables. Diameter of these cables was 10mm.
Fire source was supposed in motor control cabinet. The fire grown with t-squared curve to 702kW in 12 minutes and remained steady in 8 minutes, consistent with NUREG/CR-6850(2005). Relationships between heat release rate and time was shown in figure 12.
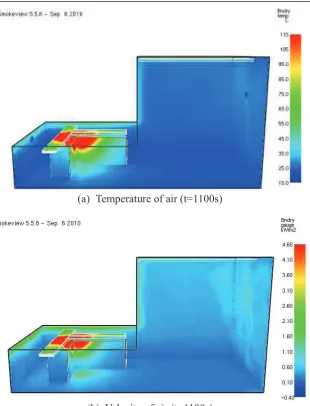
Temperature and velocity of air calculate by FDS code are shown in figure 13. Temperature distribution of cable tray was visualized by CFD simulation. Relationships between cable temperature and distance from fire source is shown in figure 14. From the simulated results, cables which loss the electrical insulation were able to estimated.
CONCLUSION
Relationships between safety temperature and time of cables for nuclear plants were investigated by flammability test results.
From the CFD analysis using FDS5, the temperature distribution of switchgear room in cabinet fire was calculated.
ACKNOWLEDGEMENT
This research were supported by a consigned research fund from the Japan Nuclear Energy Safety Organization (JNES).
Figure 1 Flammability test machine for electrical cable
Figure 3 SM-8215 by Hioki E. E. Corp.
Table 1 Specification of cables
Name of cable Sheath Insulator Number of
conductor Diameter
SHCVV HR-vinyl HR-vinyl 8 14mm
SPVV Polyvinyl chloride
Polyvinyl
chloride 2 9mm
FR-STP FR-EP rubber FR-HR vinyl 2 10.5mm
CCSHV Cross linked
polyethylene Vinyl 2 9mm
FR: Fire- resistant, HR: Heat-resistant
101 102 103 104 105 106 107 108
Insul
ati
on re
sis
tanc
e (
M
Ȑ
)
120 100
80 60
40 20 0
Time (min)
䢢䢴䢲䢲䰳 䢢䢴䢴䢲䰳 䢢䢴䢶䢲䰳 䢢䢴䢺䢲䰳 䢢䢵䢶䢲䰳 䢢䢶䢲䢲䰳 䢢䢶䢸䢲䰳 䢢䢷䢷䢲䰳
101 102 103 104 105 106 107 108
Insul
ati
on re
sis
tanc
e (
M
Ȑ
)
120 100 80 60 40 20 0Time (min)
䢢䢴䢴䢲䰳 䢢䢴䢶䢲䰳 䢢䢴䢸䢲䰳 䢢䢵䢴䢲䰳 䢢䢵䢺䢲䰳 䢢䢶䢶䢲䰳 䢢䢷䢵䢲䰳Figure 6 Relationships between insulation resistance and time of SPVV
101 102 103 104 105 106 107 108
Insul
ati
on re
sis
tanc
e (
M
Ȑ
)
120 100 80 60 40 20 0Time (min)
䢢䢵䢳䢲䰳 䢢䢵䢵䢲䰳 䢢䢵䢻䢲䰳 䢢䢶䢷䢲䰳 䢢䢷䢶䢲䰳 Figure 7 Relationships between insulation resistance and time of FR-STP101 102 103 104 105 106 107 108
Insul
ati
on re
sis
tanc
e (
M
Ȑ
)
120 100 80 60 40 20 0Time (min)
䢢䢵䢶䢲䰳 䢢䢵䢸䢲䰳 䢢䢵䢺䢲䰳 䢢䢶䢲䢲䰳 䢢䢶䢻䢲䰳 䢢䢷䢶䢲䰳700 600 500 400 300 200 100 0 Cable t empe rat ure ( Υ ) 1
2 3 4 5 6 7 8 9
10
2 3 4 5 6 7 8 9
100
2
Short circuit time (min) SHCVV SPVV FR-STP CCSHV
Figure 9 Relationships between cable temperature and electric short circuit time
Table 2 Temperature q¥ and qb
Cable SHCVV SPVV FR-STP CCSHV
¥
q (Υ) 200 220 310 340
b
q (Υ) 550 440 590 540
6 5 4 3 2 1 0 -1 ln( TR ) 2.5 2.0 1.5 1.0
1/ȟ (10-3/K)
䣕䣪䣱䣴䣶䢯䣥䣫䣴䣥䣷䣫䣶 10MȐ 100MȐ SHCVV 5 4 3 2 1 0 -1 -2 -3 ln( TR ) 2.5 2.0 1.5 1.0
1/ȟ (10-3/K)
䣕䣪䣱䣴䣶䢯䣥䣫䣴䣥䣷䣫䣶
10MȐ 100MȐ SPVV
Figure 11 Geometry of switchgear room for CFD analysis
1000
800
600
400
200
0
Heat r
ele
ase r
ate
(kW
)
2500 2000
1500 1000
500 0
Time(s)
(a) Temperature of air (t=1100s)
(b) Velocity of air (t=1100s)
Figure 13 Simulated result of cabinet fire in switchgear room
800
600
400
200
0
Temper
atur
e(
䜪
C
)
70 60 50 40 30 20 10
Distance from fire source(cm)
REFERENCES
Collins, H.E., Moore, V.A., Levine, S., Panciera,V. W., Minners,W., Seyfrit, K.V., Hanauer, S.H., (1976).
“Recommendations to Browns Ferry Fire,” NUREG-0050, U.S. Nuclear Regulatory Commission
Dobbernack, R. and K. Muller, (1993). “Integral Fire Tests with Oil and Cable in a Nuclear-Power-Plant,” Makromolekulare Chemie-Macromolecular Symposia 74, pp. 209-217
Kassawara, R. P. and Hyslop, J.S., (2005). “Fire PRA Methodology for Nuclear Power Facilities,” EPRI 1011989/NUREG/CR-6850, Electric Power Research Institute/ U.S. Nuclear Regulatory Commission
McGrattan, K., Hostikka, S., Floyd, J., Baum, H. and Rehm, R.,(2009). “Fire Dynamics Simulator (Version 5)
Technical Reference Guide”, National Institute of Standards and Technology (NIST), NIST Special Publication
1018-5
McGrattan, K., Klein, B., Hostikka, S. and Floyd, J., (2009).”Fire Dynamics Simulator (Version 5) User's Guide,” National Institute of Standards and Technology (NIST), NIST Special Publication 1019-5
Nowlen, S.P., (1991). “The impact of thermal aging on the flammability of electric cables,” NUEG/CR-5619, Sandia national laboratories
Nowlen, S.P., (1991). “An Investigation of the effects of thermal aging on the fire damageability of electric cables,” NUEG/CR-5546, Sandia national laboratories
NRC, (2008). “Cable Response to Live Fire (CAROLFIRE),” NUREG/CR-6931
Pryor, A.J., (1997). “The Browns Ferry nuclear plant fire”, SFPE Technical Report 77-2, Society of fire protection engineers