| INVESTIGATION
Inferring Recent Demography from Isolation by
Distance of Long Shared Sequence Blocks
Harald Ringbauer,*,1Graham Coop,†,‡and Nicholas H. Barton* *Institute of Science and Technology Austria, A-3400 Klosterneuburg, Austria,†Department of Evolution and Ecology, and‡Center for Population Biology, University of California, Davis, California 95616 ORCID IDs: 0000-0002-4884-9682 (H.R.); 0000-0001-8431-0302 (G.C.); 0000-0002-8548-5240 (N.H.B.)
ABSTRACTRecently it has become feasible to detect long blocks of nearly identical sequence shared between pairs of genomes. These identity-by-descent (IBD) blocks are direct traces of recent coalescence events and, as such, contain ample signal to infer recent demography. Here, we examine sharing of such blocks in two-dimensional populations with local migration. Using a diffusion approximation to trace genetic ancestry, we derive analytical formulas for patterns of isolation by distance of IBD blocks, which can also incorporate recent population density changes. We introduce an inference scheme that uses a composite-likelihood approach tofit these formulas. We then extensively evaluate our theory and inference method on a range of scenarios using simulated data. Wefirst validate the diffusion approximation by showing that the theoretical results closely match the simulated block-sharing patterns. We then demonstrate that our inference scheme can accurately and robustly infer dispersal rate and effective density, as well as bounds on recent dynamics of population density. To demonstrate an application, we use our estimation scheme to explore thefit of a diffusion model to Eastern European samples in the Population Reference Sample data set. We show that ancestry diffusing with a rate of s50 100 km=pffiffiffiffiffiffiffiffigenduring the last centuries, combined with accelerating population growth, can explain the observed expo-nential decay of block sharing with increasing pairwise sample distance.
KEYWORDSdemographic inference; identity by descent; isolation by distance; dispersal rate; effective population size
T
HERE has been a long-standing interest in estimating demography, as migration and population density are key parameters for studying evolution and ecology. Demo-graphic models are essential for disentangling the effects of neutral evolution from selection, and are crucial to under-standing local adaptation. Moreover, the inference of demo-graphic parameters is important for conservation and breeding management. Given the intensive nature of obtain-ing such parameters by direct observations, which are more-over necessarily limited to short timescales, the increasing availability of genetic markers has spurred efforts to develop inference methods based on genetic data.This work focuses on estimating dispersal rate and pop-ulation density in two-dimensional habitats by analyzing the
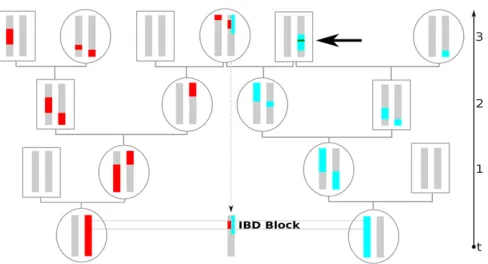
geographic distribution of so-called identity-by-descent (IBD) blocks, which are commonly defined as co-inherited segments delimited by recombination events (see Figure 1). It has now become feasible to detect long regions of excep-tional pairwise similarities from dense SNP or whole
ge-nome sequences (Gusev et al. 2009; Browning and
Browning 2011). For regions longer than a few cM, the bulk mostly consists of a single IBD block unbroken by recombination, at least when inbreeding is rare (Chiang et al. 2016). This yields novel opportunities for inferring recent demography, as one can study the direct traces of coancestry.
Moreover, the length of shared blocks contains information about their age. That is, the longer the time to the most recent common ancestor, the shorter the expected IBD length, as recombination has more chances to break up ancestral genetic material. The probability that no recombination occurs in a block of a given map length decays exponentially, going back in time. Hence, long IBD blocks originate mostly from very recent coancestry and provide insight into the recent history of a population. Shared long blocks between pairs of populations Copyright © 2017 by the Genetics Society of America
doi: 10.1534/genetics.116.196220
Manuscript received September 24, 2016; accepted for publication January 13, 2017; published Early Online January 19, 2017.
Supplemental material is available online atwww.genetics.org/lookup/suppl/doi:10. 1534/genetics.116.196220/-/DC.
can be used to infer the distribution of recent coalescence times (Ralph and Coop 2013), andfitting deme and island models can yield information on recent population sizes (Palamaraet al.2012; Browning and Browning 2015) and migration patterns (Palamara and Pe’er 2013). These works are complementary to the analysis of short identical seg-ments, which are informative about deeper timescales (Li and Durbin 2011; Harris and Nielsen 2013), and they show-case the utility of long IBD blocks for inferring recent demography.
Here, we focus on a pattern of isolation by distance of IBD blocks within populations extended in two dimensions with local migration. For such populations, the classical Wright– Malécot formula describes an increase of mean pairwise genetic diversity with increasing geographic separation (Wright 1943; Malécot 1948). Several inference methods use such classical isolation by distance patterns as signals to infer the parameters of recent demography. For exam-ple,fitting increasing pairwise genetic diversity with geo-graphic distance is widely used (Rousset 1997, 2000; Vekemans and Hardy 2004), and approximate-Bayesian-computation methods have been applied (Joseph et al. 2016). Similarly, the extent of geographic clustering of rare frequency alleles can be used as a signal for inference (Novembre and Slatkin 2009). While the signal of locally decreased pairwise genetic diversity mostly stems from re-cent times (Leblois et al.2004), such patterns can be se-verely confounded by deeper, often unknown, ancestral patterns (Meirmans 2012). Moreover, such methods can usually only infer the neighborhood size 4pDes2; which
is proportional to the product of dispersal rate s2 with
effective density De:Usually, these important parameters cannot be estimated separately, as the underlying signal is mostly based on a short-term equilibrium between local drift and dispersal. An exception is quickly mutating or-ganisms such as viruses, for which phylogeographic diffu-sion approaches yield separate estimates ofs(Lemeyet al. 2010). However, the mutation rates are usually too low to provide significant additional information on recent de-mography (Barton et al. 2013). In summary, inference schemes based on pairwise genetic diversity suffer from several fundamental limitations.
To overcome these problems, this work builds upon the ideas of Bartonet al.(2013), who observed that the anal-ysis of long shared IBD blocks would, in principle, allow one to estimate dispersal and population density sepa-rately. They argued that such an inference scheme would be robust to confounding by ancestral structure, since long IBD blocks mostly originate from not long ago. Here, we introduce a practical inference scheme based on this idea. We first expand the theoretical results of Barton et al. (2013). We use a model of spatial diffusion of ancestry, which yields analytical formulas for block-sharing patterns. We then fit these results using a composite-likelihood framework, similar to Ralph and Coop (2013). This approach allows one to readily include error estimates for block de-tection, such as limited detection power or wrongly inferred block lengths, which are problems that usually arise when IBD segments are called from genotype data (Browning and Browning 2012; Ralph and Coop 2013). Recently, Baharian et al.(2016) independently derived similar equations for block sharing under the diffusion approximation and used them for demographic inference byfitting binned data. We extend this work in several ways. We additionally deal with growing and declining populations, and our composite-likelihood method offers several significant advantages overfitting binned data. Importantly, as a major part of this article, we extensively evaluate our estimation scheme on simulated data. We test its power to recover demographic parameters for several geo-graphic models and we investigate how model deviations, such as nearby habitat boundaries, affect inference. This yields valuable novel insight into the validity of the underlying ide-alized diffusion model and examines the scope of the inference scheme.
Currently, large IBD block data sets are available, mainly for humans. To showcase a practical application of our inference scheme, we use it on a subset of the Population Reference Sample (POPRES) data set, which Ralph and Coop (2013) previously analyzed for long IBD blocks. Al-though human demography is without doubt very com-plex, the diffusion model provides a good fit to the data, which allows us to draw conclusions about the extent of human ancestry spread in continental Europe during the last centuries. We also infer a rapidly increasing popula-tion density, which stresses the importance of accounting for rapid population growth when analyzing human IBD sharing.
Methods
The model
To describe block sharing in two spatial dimensions with local migration, we use two basic model assumptions to approxi-mate a wide range of scenarios. Obviously, the true demo-graphic history of a population is more complex than any such simple model. Thus, the aim is not to have a mathemati-cally rigorous model, which is often formally problematic (Felsenstein 1975; Nagylaki 1978) and only holds exactly in specific settings, but to have an accurate approximation that captures general patterns that can be used for robust inference of basic demographic parameters. In the following, we outline these two central modeling assumptions.
Poisson recombination:We approximate recombination as a homogeneous Poisson process,i.e., crossover events are as-sumed to occur at a uniform rate along a chromosome. Throughout this work, the unit of genetic distance will there-fore be the Morgan, which is defined as the distance over which the expected average number of intervening chromo-somal crossovers in a single generation is one. Small-scale processes, such as gene conversion, are not captured by the Poisson approximation, but for the large genomic scales of typically several cM considered here this can be neglected (Lynchet al.2014). Similarly, we ignore the effect of inter-ference, which is reasonable when describing the effects of recombination over several generations. Since the female and male recombination rate can be markedly different, for our purposes we use the sex-averaged rater¼rmþrf=2:In
every generation, loci on autosomes have an equal chance to trace back to a female or male ancestor. Thus, the female and male Poisson processes together are described by a single Poisson process with the averaged recombination rate. Gen-eralizing this line of thought, any individual differences in map length can be modeled by a single Poisson process with the population-averaged rate.
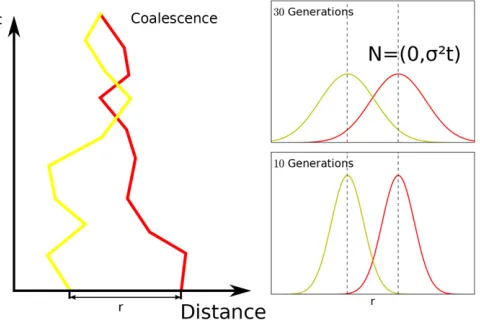
Diffusion approximation:Following a long tradition of mod-eling individual movement in space with diffusion (Fisher 1937; Wright 1943; Malécot 1948; Nagylaki 1978), we ap-proximate the spatial movement of genetic material back in time using a diffusion process. The position of ancestral ma-terial at some timetin the past is the sum of the migration events until then, which are often correlated only on small timescales. Therefore, using the central-limit theorem, the probability density for the displacement of a lineage can be approximated using a Gaussian distribution with axial vari-ance ofs2t(Figure 2). This approximation does not depend
on details of the single-generation dispersal kernel, provided its variance isfinite. It seems plausible that diffusion of an-cestry is often an accurate approximation on recent to inter-mediate timescales (Bartonet al.2002), which are important for the sharing of long IBD blocks.
If consecutive single-generation dispersal events are uncorrelated, s2 is the average squared axial
parent-offspring distance (Rousset 1997). Even with small-scale spatial or temporal correlations between dispersal events, one can model the spread of ancestry using the diffusion approximation (Robledo-Arnuncio and Rousset 2010). In this case,s2 has to be interpreted as a
param-eter that describes the rate of the spread of ancestry back in time (Barton et al. 2002), which can differ markedly from the single-generation squared axial parent-offspring distance.
Here, we will need to describe the chance that pairs of lineages of homologous loci come into close proximity. For this, we assume that the two lineages diffuse independently. In this case, the sum of their movements can be described using a two-dimensional Gaussian distribution with twice the variance of a single lineage. The probability density that two lineages that were initially separated byðx0;y0Þhave a
pairwise distance of zero along each axis at timet, or equiv-alently, that the sum of the movements is ð2x0;2y0Þ;is
therefore:
1
4pts2exp 2 x20þy20
4ts2
!
¼ 1
4pts2exp 2 r2 4ts2
!
; (1)
where r¼
ffiffiffiffiffiffiffiffiffiffiffiffiffiffiffi
x2 0þy20 q
is defined as the initial Euclidean dis-tance between the two lineages.
This ignores the fact that once coalesced, lineages re-main at a pairwise distance of zero. Wilkins (2004) gave recursions and approximate formulas (formulas A15 and A17) that account for this interference of lineages in two spatial dimensions. They show that complex interference terms can be neglected as long as previous coalescence is sufficiently rare. Thus, for describing the chance of pair-wise coalescence in the relatively recent past, Equation 1 usually represents an accurate approximation, particu-larly for well-separated samples. Other causes of correla-tions of movements are often of local geographic nature, as in the cases of densityfluctuations or local barriers. Such small-scale heterogeneities often average out when viewed on larger scales, and the approximation that line-ages move independently remains accurate on these scales (Bartonet al.2002).
IBD sharing in the model
Using similar assumptions, Bartonet al.(2013) calculated the probability that two individuals a certain distance apart share an IBD block longer than a minimum length starting from a specified locus. For this specific purpose they could directly apply the Wright–Malécot formula by replacing mutation with recombination. For practical in-ference from IBD blocks, more general formulas describ-ing the total number of shared blocks of a specific lengthLare advantageous. In this section, we derive such equations.
IBD blocks of age t:Following Ralph and Coop (2013), we
for a given pair of samples, into NL;t the number of blocks coalescing at timet:
E½NL ¼ Z N
0 ENLt
dt: (2)
Throughout this article, such terms are always understood as a density with respect to block length and time. Following the ancestry of two chromosomes back in time, a change of genealogy only occurs when there is a recombination event somewhere along the lineage. Between these discrete jumps, genetic material can be traced as a single locus. This allows us to further split E½NLt into the product of the expected number of blocks of lengthLobtained by splitting the two chromosomes according to the Poisson recombina-tion over time t with the probability that a single locus coalesces time tago. We denote thefirst factor byE½KtL; and the second factor, commonly known as the coalescence time distribution, bycðtÞ:
ENLt
¼ EKtL
cðtÞ: (3)
Number of candidate blocks:Under our model assumptions, the position of all recombination events on two independent chromosomes traced back until timetis given by a Poisson process with rate 2t:The expected number of all block pairs overlapping at an intersection lengthLcan then be calculated as follows. A recombination event occurs in a small region of map lengthDLwith a probability of 2tDL;and the probability that a region of length L does not recombine follows the exponential distribution expð22LtÞ: For chromosomes of
map length G, summing the possible start sites yields the expected total number of blocks of lengthL:
EKtL
¼22texpð22LtÞ þ ðG2LÞ4t2expð22LtÞ; (4)
where thefirst term describes the blocks starting at either edge and the second term the fully interior blocks, which require two delimiting recombinations. Neglecting the effects of chro-mosome edgesðGLÞ;this is approximated by:
EKLt
G4t2expð22LtÞ: (5)
We will use Equation 5 to derive an approximate formula for capturing the qualitative behavior of mean IBD sharing. The slightly more complex result, including edge effects used for inference, is derived analogously (see Appendix B).
Single locus coalescence probabilities:The probabilitycðtÞ that two homologous loci have their last common ancestor timetago depends on their pairwise sample distancerand the parameters of the demographic model. We can follow Barton et al. (2002) and approximate the probability of a recent coalescence as the product of the probability of the pairwise sample distance being zero (Equation 1) and a rate of local coalescence which, following Bartonet al.(2013), we shall denote by 1=2De:In Appendix A, we justify this approx-imation and give a formal definition of this so-called effective densityDe:To describe a globally growing or declining pop-ulation, which is particularly important for the human case studied in this article, we letDedepend on timet. Together, this yields:
cðtÞ ¼ 1 2DeðtÞ
1
4pts2exp 2 r2 4ts2
!
: (6)
Full formula:Substituting Equations 5 and 6 into Equation 3 gives:
ENtL
¼ Gt
2DeðtÞps2exp 2 r2 4ts222Lt
!
: (7)
To determine the total number of expected shared blocks, we have to integrate all possible coalescence timest. For the class of power density functions, where
DeðtÞ ¼Dt2b D.0;b2ℝ; (8)
the integral yields explicit formulas. The important case of b¼0 models a constant population density, whileb.0 and b,0 describe populations with a growing or declining den-sity, respectively. Withb.0;the density approaches infinity fort¼0;which corresponds to a negligible chance of coales-cence in the present. However, since we effectivelyfit block sharing on intermediate timescales (see Figure 9), this obvi-ous problem of the model is not very limiting in practice. This class of functions has been used to fit human demographic
Figure 2 Diffusion model visualized in one spatial dimension. Our model is in fact two dimensional, but is qualitatively similar. Left panel: One realization of the movement of ancestry of two homolo-gous loci initially separated by distance r. In our model, there is a chance that they coalesce every time they come close, which is in-directly proportional to the local effective density parameterDe(see
Appendix A). Right panel: In our model, the probability density func-tion of having moved distanceDxat timetgenerations back spreads out as a Gaussian distributionNð0;s2tÞwith linearly increasing
growth (Von Foersteret al.1960). Importantly, linear com-binations of such terms can be used to build more complex density functions, including polynomials for the special case b2ℕ; which then also yield analytical formulas.
Performing the integral of Equation 2 gives the main result:
E½NL ¼2 23b
223 G pDs2
r
ffiffiffi
L p
s
!2þb
K2þb pffiffiffiffiffiffi2L sr
!
: (9)
Integrating this formula with respect to the block length gives the expected number of shared blocks longer than the thresh-old lengthL0:
E½N.L0 ¼
Z N
L0
E½NLdL
¼225223b G pDs2
r
ffiffiffiffiffi
L0 p s
!1þb
K1þb ffiffiffiffiffiffiffiffi 2L0 p r s ! ; (10)
whereKgdenotes the modified Bessel function of the second
kind of degreeg(Abramowitz and Stegun 1964). We analyze Equations 9 and 10 qualitatively in the Discussion section, and Figure 3 depicts their accuracy on simulated data.
For a widely used functional form of population-density change, an exponential growth with rateb, the integral con-verges only for blocks of length 2L.b:Otherwise, the expo-nential rate at which the long blocks are broken up is slower than the exponentially increasing chance of local coales-cence, and the expected number of blocks does not vanish for larget. However, we can approximate exponential growth on intermediate timescales by approximating it by using the standard Taylor expansion up to a certain term, and then using our results for the power density functions. Again, this effectively fits a population density up to the intermediate timescales, where the Taylor approximation is accurate, while circumventing the pathological behavior of the distant past.
Inference scheme
To learn about recent demography, wefit the observed block sharing between a set of samples to Equation 9. Here, we use a likelihood method in which we approximate the likelihood functionf :u/PrðxjuÞof the observed dataxfor a given set of parameters u(s,D,b) with a composite likelihood~fðuÞ: This allows us to estimate the approximate standard devia-tions and confidence intervals from the empirical Fisher information matrix. One can use standard numerical optimi-zation techniques tofind the maximum likelihood estimates ^
uMLE:In our analysis we use the Nelder–Mead method, as
implemented in the class GenericLikelihoodModel of the Py-thon package statsmodels, which proved to be numerically robust and quick.
Poisson model:We can construct an approximate likelihood of observed block sharing by using an approach that follows Ralph and Coop (2013). First, for every pair of samples, we
bin block sharing with respect to shared block length into small length bins. Then, we model the number of shared blocks within each of these bins as independent Pois-son distributions around expected rates li; which, for a small enough bin ½Li;LiþDL can be approximated using Equation 9:
liðr;uÞ ¼E½NLiðr;uÞDL: (11)
Using this equation, we can calculate a composite likelihood of the observed data given the demographic parametersu(see Appendix C).
Block detection errors: The detection of IBD blocks from genetic data is not a trivial task. In practice, one often has to deal with erroneous detection (Browning and Browning 2012). Blocks might be called in the absence of true IBD blocks (false positives), and only a fraction of true IBD blocks of a given length are detected (limited power), and there is a probability of assigning them the wrong length (error). Fol-lowing Ralph and Coop (2013), we can include these errors into our likelihood framework. Careful analysis allows one to estimate block detection errors (Ralph and Coop 2013), and the expected rates per bin can be updated accordingly (see Appendix D).
Assumption of independence: This Poisson approximation assumes that all shared blocks are the outcomes of indepen-dent processes. This is obviously an oversimplification. Block sharing can be correlated along chromosomes and among different sample pairs because of the initially shared move-ment of genetic material. Taking all these correlations into account would go beyond the simple pairwise diffusion model. However, maximizing the likelihood of actually correlated observations (composite likelihood) is a widely used practice in inference from genetic data (e.g., Fearnhead and Donnelly 2002). It still gives consistent and asymptotically normal es-timates, although the errors calculated from the curvature of the maximum likelihood surface at its maximum (Fisher in-formation matrix) will be too tight when the observations are actually correlated (Lindsay 1988; Coffman et al. 2016). Moreover, in many cases, correlations among blocks can be expected to remain fairly weak, since initial correlations in spatial movement are broken up quickly by recombination. When analyzing well-separated samples, sharing of long blocks is a rare event and, thus, most of the observed block sharing will originate from independent coalescent events.
significantly inflate the number of observed IBD blocks of a given length beyond the true value, especially for shorter IBD segments (Chianget al.2016).
If adjacent IBD blocks happen to be neighbors, the error estimation model by Ralph and Coop (2013), which is based on introducing artificial IBD segments of known length, partly accounts for this effect. However, this does not esti-mate the effect of short inbreeding loops where ancestral genetic material that was broken up by a recombination fuses together again quickly (Figure 1), rendering the IBD block ending recombination event ineffective (Bartonet al.2013). Intuitively, for a large neighborhood size (a parameter pro-portional to the product ofs2 and effective density 4ps2DeÞ
short inbreeding loops that significantly extend a recent IBD block by quick recoalescence are rare, and our approach re-mains valid. However, for a population with small neighbor-hood size, ineffective recombination events can potentially confound observed block-sharing patterns and the estimates based on them. This effect is driven mostly by coalescence within a few generations, before the blocks migrate away from each other. Hence, local dispersal and breeding patterns are important; however, the diffusion of ancestry usually only becomes accurate on intermediate timescales. Therefore, a generally applicable theoretical treatment of this issue is not feasible. In this article, we study the effects of this model inac-curacy using simulations, and show that the inference scheme is not greatly affected in the simulated scenarios.
Simulations
To test our equations and inference scheme, we simulated the sharing of IBD blocks in a set of samples by tracing the ancestry of the chromosomes back in time for a variety of spatial population models. Simulations were mostly done on a two-dimensional torus that was large enough that IBD sharing over more than half of the torus was very unlikely; thus we effectively simulated a two-dimensional population without
boundary effects. Since sharing of long IBD blocks is very unlikely to originate far back in time, we ran the simulations up to a maximal time tmax:If not otherwise stated, we
ana-lyzed the sharing of true IBD blocks, in which every recom-bination event was assumed to be effective.
Grid models:In our grid models, the nodes of a rectangular grid were occupied by a prespecified number of pairs of homologous chromosomes to mimic diploid individuals. Similar to the classic Wright–Fisher model of panmictic pop-ulations, for every chromosome, a parent was chosen inde-pendently for every discrete generation back, with the probabilities described by a prespecified dispersal kernel. Poisson recombination events along the chromosome in-duced a switch between the two parental chromosomes. Whenever the ancestral material of the two distinct initial chromosomes fell on the same chromosome and overlaps for longer than a given threshold chromosome length, we stored the resulting IBD block. We simulated the dispersal following discretized uniform, Gaussian, and Laplace proba-bility densities along each axis to have representatives of dispersal kernels with low, intermediate, and high kurtosis. To analyze the effects of a growing or declining population density, we simulated a varying number of multiple pairs of homologous chromosomes per node. A chromosome then
first picks an ancestral node as before, and subsequently a random diploid ancestor from this node. The grid model was also easily modified to simulate a classic nearest neighbor stepping stone model (Kimura and Weiss 1964). Nodes were grouped into demes, and each chromosome either chose its parent uniformly from within its own or one of the neighbor-ing demes.
Continuous model: spatial l-Fleming-Viot process: We additionally simulated a model in which each individual occupied a position in continuous space. For this, we used
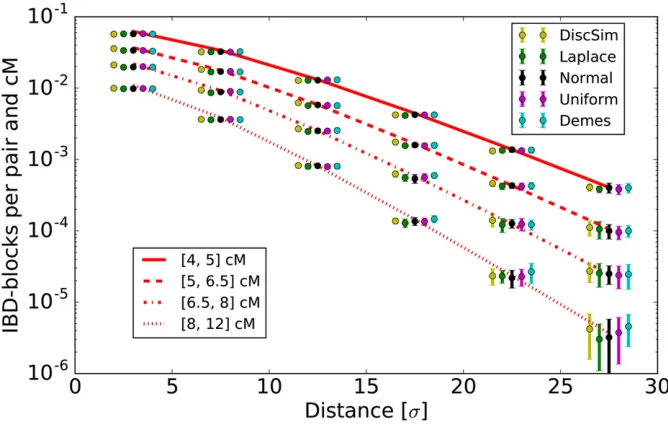
Figure 3 Simulated IBD block sharing com-pared with theoretical expectations. We show values normalized to give rates per pair and cM. Theoretical expectations are calculated for each length bin using Equation 10. For thefive mod-els described in theMethodssection, we kept the population density constant atDe¼1;with
a dispersal rate ofs¼2 on a torus of size 180, and simulated IBD sharing between 150-cM chromosomes spread out on a subgrid with nodes two distance units apart. (For a full set of specific simulation parameters, seeFile S1.) For every model, we ran 20 replicate simula-tions. Distances are measured in dispersal units
DISCSIM, a fast implementation (Kelleheret al.2014) of the recently introduced spatiall-Fleming-Viot process. Summa-rizing briefly, this model introduced by Bartonet al.(2010) follows lineages backward in time and events are dropped randomly with a certain rate parameter and uniform spatial density. In each such event, every lineage within radiusRis affected with the probabilityuby this event. A prespecified number of parents, here two, are dropped uniformly within the disc, and every affected lineage jumps to them, switch-ing parents accordswitch-ing to the recombination rate. Given an initial set of loci, DISCSIM generates their coalescence tree up to a specified time. The output contains a list of all co-alescent nodes, which we further analyzed to detect IBD sharing.
Application to Eastern European data
Currently, population genomic data sets which allow one to analyze long IBD blocks are available mainly for humans. To test the inference scheme, we applied a data set of blocks shared between Europeans, which was generated previously by Ralph and Coop (2013), and includes detailed error esti-mates for IBD block detection. They reported significant dif-ferences in patterns of block sharing between Eastern and Western European populations. Therefore, we concentrated our analysis on block sharing in the Eastern European subset, as diffusion should be a better approximation for modeling the spread of ancestry in continental regions. Moreover, East-ern European countries are on average geographically more compact and, thus, the position data at the country level is expected to be more accurate.
The data:The detection method and error analysis of the IBD block data were described in detail by Ralph and Coop (2013). Summarizing briefly, IBD blocks were called for a subsample of the POPRES data set (Nelsonet al.2008) and genotyped at 500;000 SNPs using the fastIBD method, as implemented in Beagle version 3.3 (Browning and Browning 2011). Every sample used in the analysis was required to have all reported grandparents from the same country. We analyzed block sharing between 125 Eastern European sam-ples (see Supplemental Material,File S1). We followed the geographic classification of Ralph and Coop (2013), but excluded the six Russian and one Ukrainian samples, as location data at the country level are likely very inaccurate for these two geographically extended countries. We ana-lyzed shared blocks .4 cM. Within our subsample, 1824 such blocks were reported (Figure 9). We set the position of each country to its current demographic center, defined as the weighted mean location (File S1). In our analysis, we used sex average map lengths of autosomes given by the deCODE map (Kong et al. 2002), consistent with Ralph and Coop (2013).
Data analysis:Throughout the analysis, we worked with block length bins ranging from 0 to 30 cM with a bin width of DL¼0:1 cM, and applied the error function estimates reported by Ralph and Coop (2013). For maximizing the likelihood, we calculated the likelihood of block sharing in the bins from 4 to 20 cM ; which is informative about the last few centuries (see Figure 9). We excluded the longer shared blocks from our analysis since these blocks
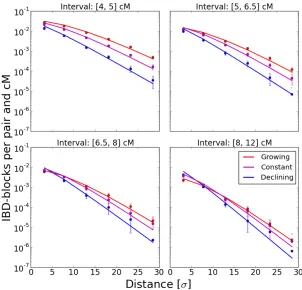
Figure 4 Various population density scenarios. Simulated IBD block sharing per pair and cM in various density sce-narios was compared to theoretical expectations based on Equation 9. The block sharing of a subset of 150-cM chromosomes four distance units apart placed on an ini-tial grid was analyzed. Along each axis, dispersal was modeled by a Laplace distribution with s¼1;and the number of diploid individuals per nodeneither remained constant at n¼10; grew as nðtÞ ¼t; or declined as
have a considerable chance of originating in the last few generations, which is not expected to be accurately cap-tured in the diffusion model. Longer shared blocks are also confounded by the sampling scheme that excluded individuals with reported grandparents from different countries.
We used our inference scheme tofit several specific models of past densityDas follows:
1. For a constant population:D¼C:
2. For a population growing at accelerating rate:D¼C=t: 3. For a growth model where the growth rate isfitted as well:
D¼Ct2b:
In each case,tmeasured time back in generations. To learn about the certainty of estimates, in addition to using the curvature of the likelihood surface (Fisher information ma-trix), we bootstrapped the data. Since we suspected strong correlations and systematic deviations from the model, we resampled different units. We bootstrapped on the level of blocks by redrawing each block a number of times following a Poisson distribution of mean 1, and similarly over country pairs, since we suspected systematic correlations on this level.
Furthermore, we analyzed the deviation of pairwise block sharing between pairs of countries from the expected
value predicted by the bestfit model. For this, we assumed that the observed block sharing was Poisson distributed around the predicted block sharing. Transforming the block count data x/2pffiffiffix converts these Poisson distributions into approximately Gaussian distributions with an SD of 1, which helped visual inspection of the statistical signifi -cance of residuals.
Data availability
We implemented the described methods to simulate and analyze IBD sharing data in Python. The source code was uploaded to the freely available Github repositoryhttps://git. ist.ac.at/harald.ringbauer/IBD-Analysis. The preprocessed human IBD block-sharing data, including the detection-error estimates used here, were the result of the analysis of Ralph and Coop (2013), and can be freely accessed athttp://www. github.com/petrelharp/euroibd.
Results
Block sharing in simulated data
We compared simulated block-sharing patterns with the the-oretical expectations. For each bin, we depicted rates per pair and normalized for a rate per cM.
Constant population density: For a constant population density, the theoretical expectation (Figure 3) is given by Equation 9:
E½NL ¼ G 8pDs2
r
ffiffiffi
L p
s
!2
K2 pffiffiffiffiffiffi2L r s
!
;
whereK2denotes the modified Bessel function of the second
kind of degree two (Abramowitz and Stegun 1964). This formula predicts that block sharing approaches exponential decay with distance, as Bessel functionsffiffiffiffiffiffiffiffiffiffiffiffiffiffiffiffiffiffiffiffiffiffiffiffiffiffiffiffiffi KgðxÞ converge to
p=2rexpð2rÞ
p
forr1 (Abramowitz and Stegun 1964). This decay then dominates the polynomial terms in front of the Bessel functions, and the slope of this exponential decay (on a log scale) converges topffiffiffiffiffiffi2L=sasp2ffiffiffiffiffiffiLr=s.1:For the long blocks considered here, this quick decay is approached for pairwise sample distances of a fews. In all simulations, block-sharing patterns were very similar among thefive dif-ferent simulated models, and closely followed the theoretical expectation (Figure 3).
Growing and declining populations: We simulated block sharing for three scenarios of a growing, declining, and constant population with growth parameters b¼1;0;21: Figure 4 shows that the results are again in good agreement with the-ory. We depicted the result for the simulated Laplace dispersal; the other dispersal kernels yielded almost identical results. In all scenarios, the decay of block sharing with distance approached exponential decay with rate pffiffiffiffiffiffi2L=s; where the specific density scenario determined the speed of convergence.
Inference in simulated data
We tested our parametric inference scheme and analyzed its ability to recover the underlying demographic parameters from simulated block-sharing data. For every simulated block data set, we numerically computed the maximum likelihood estimatesuMLE for shared blocks between 4 and 20 cM, put
into bins of width 0.1 cM.
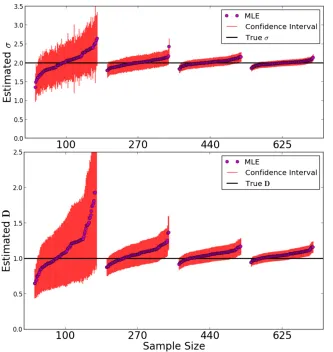
Constant population density:Results for the parameter in-ference for a population of constant density are depicted in Figure 5. We simulated a varying number of samples on a grid, consisting of one chromosome each, to test the behavior of the inference scheme with respect to limited sample size. Naturally, the variance of estimates increased with decreas-ing sample size, but the bias remained small. Moreover, the estimated SEs captured the true estimator variance relatively well (see File S2). This confirms that most of the shared blocks were the result of uncorrelated coalescence events, as heuristically argued above. The typical log-likelihood sur-face for a single simulated IBD block-sharing data set was found to be smooth (Figure S2), and in all cases, numerical maximization did not result in spurious maxima, even for initial estimates orders of magnitudes off. Moreover, esti-mates of density and dispersal rate were only slightly corre-lated in the scenario considered here (File S2).
Varying population density:We also tested the ability of the inference scheme to detect recent changes in population densities. For this, we simulated three scenarios of a growing, declining, and constant population with growth parameters
b¼1;0;21:Results are depicted in Figure 6. The estimates of the demographic parameters allowed us to robustly distin-guish these three scenarios. Interestingly, accurate estimates of the dispersal rate were feasible in all these demographic scenarios; even whenfitting a model with constant popula-tion size to the other two scenarios of a recently, quickly changing, population size (Figure S1). This can be explained by the fact that the eventual rate of decay, the main signal for estimatingsfromfitting Equation 9, remains the same, in-dependent of the specific population density scenario. The speed of convergence varies, but in all cases the eventual rate is approached relatively quickly within several dispersal dis-tances (Figure 4).
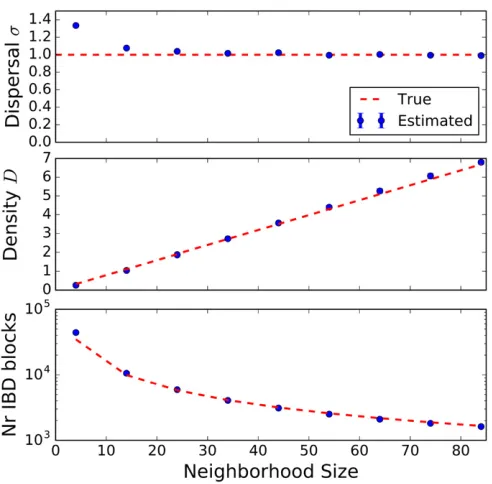
True vs. detectable IBD blocks: In Figure 7, the effect of undetected recombination events on estimates of demo-graphic parameters and overall IBD block number is depicted. This was investigated with simulations in the DISCSIM model, as it allowed easy and continuous tuning of the neighborhood size 4ps2De through the parameter
describing the probability that an event hits an individual within its range (Bartonet al.2013). Pairwise coalescence times for all pairs of loci along the chromosome were extracted, but now only the effective recombination events were counted, which were defined as jumps of coalescence
times between adjacent pairs of loci with at least one co-alescence time older than a preset time threshold of 1000 gen-erations back, the time at which the backward simulations were run. This would capture most short recombination-coalescence loops, while still being well below the bulk of ancestral coalescence times. The effect of the nondetect-able recombination events became significant only for very low neighborhood sizesð,15Þwhen the detected number of IBD blocks of a certain length was inflated by wrongly inferring multiple shorter blocks as a single longer block. While estimates for density remained almost unbiased, the inferred dispersal rates increased significantly, likely due to an excess of block sharing for distant samples. However, even for very low neighborhood sizes, when the effective density of individuals measured in dispersal units was about one (for neighborhood size 4pDes212:6Þ;the upward
bias remained,50%.
Sampling guidelines
Edge effects: In practice, populations are not extended
in-finitely beyond the sampling area, but have range boundaries. This forces lineages to deviate from the simple diffusion model, as they cannot wander out of the species range (Wilkins and Wakeley 2002; Wilkins 2004). This might be a common violation of our model assumptions. We assessed how much our inference method was affected using simu-lated data from habitats of limited size. In these simulations, we assumed that the lineages were reflected once they reached a range boundary.
Our results (File S3) indicated that, in cases when the boundaries were close to the samples such that the distance to the nearest samples was on the same order of magnitude as s, the estimates for the dispersal ratesand densityDbecome biased downward; an effect also observed for the inference method of Novembre and Slatkin (2009) which is based on the sharing of rare alleles. Similarly, we observed that the estimates forDandsbecome biased downward for habitats of width10s:Therefore, we recommend to always check whether most of the samples are collected far from the hab-itat edgesð.sÞand whether the habitat is sufficiently large ðdiameter .10sÞ:
For the special case of rectangular habitats with reflecting boundaries, the method of images described by Wilkins (2004) gives a simple way of calculating the coalescence probabilities for two spatially diffusing lineages (Equation 6). In principle, it is straightforward to update our formulas for expected block sharing accordingly. One simply has to add terms describing the expected block sharing with ghost sam-ples reflected at the edges. However, we did not implement this correction, as this approach cannot be extended to more irregularly shaped habitats and boundary edges, as usually encountered in reality.
Clumped sample distribution: In practice, samples are not always evenly distributed, but are often clumped due to sampling constraints. To investigate how such clustered
sampling affects our inference scheme, we compared the results of various scenarios of clumping (File S3). The esti-mates and their inferred uncertainty were not affected sub-stantially; only in the cases of very asymmetric clumping did we observe a small upward bias of dispersal estimates. This overall robustness is not surprising as the distribution of pair-wise sampling distances is not changed much as long as the clumping is not overly pathogenic (i.e., a very low number of sample clusters).
Inference in POPRES data
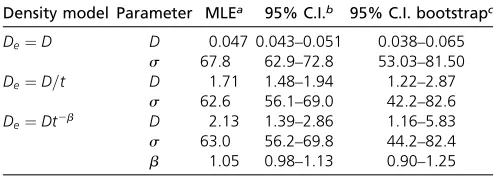
Whenfitting our models to the Eastern European subset of the POPRES IBD data, the model of quick population growth with a population densityDeðtÞ ¼1=tfit markedly better than a model of constant population size, which underestimated sharing of short blocks (Figure 8) at the maximum likelihood parameters. In the more complex model,DeðtÞ ¼t2b;the growth rate parameterbwas esti-mated to be close to one. The increase of likelihood was small ðDL¼1:1Þ;especially when considering that there are correlations in the data that make the difference of true likelihood even smaller (Coffmanet al.2016). Simi-larly, fitting several, more complex, density functions as sums of power terms did not significantly increase the likelihood. In all three models, the estimates for dispersal swere60—70 km=pffiffiffiffiffiffiffiffigen;even under the likely misspe-cified constant population size model (Table 1), and
boot-strapping on the country-pair level yielded 95% confidence intervals that ranged from 45—80 km=pffiffiffiffiffiffiffiffigen:
The estimated parameter uncertainty when bootstrapping over single blocks was only slightly larger than was estimated from the curvature of the likelihood, but bootstrapping over country pairs gave markedly increased confidence intervals (Figure S3), which implies that there are systematic correla-tions at this level in the data. This was further confirmed by the analysis of the residuals for the country pairs, which yielded a gradient toward the Balkans for more block sharing than predicted by the best fit models. The deviations were statistically most significant for short blocks because of the increased power due to the higher number of shared blocks (Figure 5); however, the overall pattern also held for longer blocks (Figure S4).
Discussion
The main goal of this article was to develop a robust in-ference scheme for populations extended in two spatial dimensions that uses pairwise shared long IBD blocks to reliably estimate the dispersal ratesand the effective pop-ulation density Deseparately. For this, we derived analyt-ical formulas for block sharing under a model of diffusion of ancestry that extended the previous work of Barton et al. (2013), andfit these results by maximizing a com-posite likelihood similar to that used by Ralph and Coop
(2013). Using extensive tests on data simulated under a variety of scenarios, we demonstrated that our method could robustly perform this task.
Baharianet al.(2016) recently independently arrived at similar formulas for block sharing under a model of spatial diffusion, which theyfit by regressing block sharing data binned according to pairwise geographic distance and block length. Our work is conceptually similar, but pro-vides several important extensions. We additionally de-scribed the effect of recent population density changes, which seems especially relevant for human populations. For the special case of a constant population size, our re-sults matched an equivalent result of Baharian et al. (2016), and our approach allowed us to additionally in-corporate chromosomal edge effects. Moreover, our likeli-hood framework offers several advantages over regressing binned data because it makes use of the information con-tained in the lengths of shared blocks. It can also be used to quantify the uncertainty of the parameter estimates, and can readily include error estimates for block detection. Another major contribution is our extensive testing on sim-ulated data. These simulations yielded insights into the general accuracy of the underlying idealized model as-sumptions. They also helped us to investigate how several deviations from the model that might occur in practice; including ineffective recombination events, wrongly spec-ified growth models, irregular sample distribution, and nearby habitat boundaries; affect inference.
Exponential decay of IBD sharing with distance and block length
The derived formulas for sharing long IBD blocks under dif-fusion of ancestry are structurally similar to the Wright– Malécot formula (Bartonet al.2013) which describes allelic identity by state using similar approximations. A polynomial factor is multiplied with a Bessel function of the second kind,Kg ffiffiffiffiffiffip2lsr
;for allelic correlationl¼m(the mutation rate), while herel¼L(the IBD block map length). For long blocks,Lis much larger than typical mutation ratem. This allows us to probe the tail of the Bessel function ðpffiffiffiffiffiffi2lr=s.1Þ;where it approaches exponential decay that dominates the polynomial factor. This exponential decay
occurs with both an increasing block length pffiffiffiLand an in-creasing geographic distancer. The theory predicts that for long blocks, this decay can be over orders of magnitude when pairwise geographic sample distance increases multi-ple dispersal distances (Figure 3), which is observed in the human data (see Figure 8). This pattern persists even in the case of recent population density changes (see Figure 4). When global density changes can be modeled as the sums of power terms of the form in Equation 8, the result for expected block sharing will be given by the sums of the corresponding Bessel functions (Equation 9). Each of those approaches exponential decay with rate pffiffiffiffiffiffi2L=s;thus, also their sum does. Therefore, estimates of the dispersal rates that use the decay rate in the exponential regime can be expected to be relatively robust with respect to recent de-mographic history (see alsoFigure S1).
Implications for demographic inference
The fast rate at which long blocks are broken up and the ability to probe the exponential regime of decay offer several significant advantages for demographic inference, which our inference scheme can use. First, long blocks typically stem from very recent times (see Figure 9). This is clearly advantageous for populations that have been in equilibrium for only a relatively short time, as is likely often the case. Inference methods that rely on allelic cor-relations probe recent timescales as well (Barton et al. 2013). They similarly pick up locally increased identity by state by recent coancestry. However, this is often only a small signal on top of a majority of identity by state stemming from ancient times. Thus, these methods are much more susceptible to confounding by ancestral struc-ture (Meirmans 2012), and have stringent, often unrealis-tic, equilibrium time requirements (Leblois et al. 2003), which our method can avoid. For instance, in the human case, the bestfit model predicts that most long blocks stem from within the last 50 generations (Figure 9). Second, quick exponential decay, both with sampling distance and block length, offers a very robust signal for demo-graphic inference. As demonstrated, the expected number of blocks that are multiple cM long decays by orders of magnitude over a geographic scale of several dispersal dis-tance units. This pattern should be relatively robust with respect to small-scale heterogeneities of habitat or dis-persal. Such quick decay also aids robust inference, as shown by the accuracy of the inference method on simu-lated data. This is in contrast to inference that is based on classic measures of pairwise genetic similarity. Such mea-sures usually only decay with the logarithm of distance (Bartonet al.2002), which causes low and often problem-atic signal-to-noise ratios (Wattset al.2007). Third, using the logarithmic regime of the Wright–Malécot formula only allows one to infer the neighborhood size propor-tional to the product of density and dispersal. Naturally, however, their separate values are of interest. As demon-strated, inference based on long IBD blocks allows one to
Table 1 Maximum likelihood estimates for Eastern European IBD data
Density model Parameter MLEa 95% C.I.b 95% C.I. bootstrapc
De¼D D 0.047 0.043–0.051 0.038–0.065 s 67.8 62.9–72.8 53.03–81.50
De¼D=t D 1.71 1.48–1.94 1.22–2.87
s 62.6 56.1–69.0 42.2–82.6
De¼Dt2b D 2.13 1.39–2.86 1.16–5.83
s 63.0 56.2–69.8 44.2–82.4
b 1.05 0.98–1.13 0.90–1.25
MLE, maximum likelihood estimate.
aAll units so that distances are measured in km and time in generations. bCalculated from Fisher information matrix.
obtain robust separate estimates of these two important demographic parameters.
Analysis of human data
The analysis of human data nicely demonstrates our inference scheme. The true demographic scenario is doubtless more complex, including heterogeneous, time-dependent migration rates and large-scale migrations. However, qualitatively the patterns of IBD sharing appear tofit well with our diffusion model. Despite several sig-nificant deviations, the bestfit model explains the overall broad trends in the empirical data (Figure 8), such as the decay of the number of shared blocks with both increasing geographic distance and block length. Using our inferred model, we predicted most of the shared blocks we used (.4 cM) and hence our signal originates within the last 50 generations (Figure 9), which corresponds to the past 1450 years (assuming 29 years per generation; Fenner 2005). This mostly postdates the period of large-scale migrations in Europe (“Völkerwanderung”; Davies 2014). Our inferred demographic parameters seem to be plausible. There is a clear signal for rapidly accelerating recent pop-ulation growth, which is in agreement with historical esti-mates (McEvedy and Jones 1978) and previous genetic studies based on the allele-frequency spectrum (Keinan and Clark 2012; Gao and Keinan 2016). Historical dis-persal estimates infer values of typical migration distances per generation ranging from a few to several dozen kilo-meters (Wijsman and Cavalli-Sforza 1984; Pooley and Turnbull 2005). While agreeing on orders of magnitude, these are somewhat lower than our estimates ðs502 100 km=pffiffiffiffiffiffiffiffigenÞ:However, there is also evidence that pre-industrial individual human migrations over large dis-tances are rare, but occur at a significant rate (Pooley and Turnbull 2005).
We detected a systematic, large-scale deviation from a simple diffusion model with uniform population density, as there is a clear gradient for higher block sharing in the direction of the Balkan countries (Figure 5). This was al-ready observed by Ralph and Coop (2013). They hypoth-esized that this could be due to the historic Slavic expansion, a hypothesis supported by admixture analysis
(Hellenthalet al.2014). However, the pattern of increased block sharing also holds for longer, typically younger, blocks, which could hint additionally at a consistently lower population density in these regions. Such systematic regional deviations from the diffusion model also imply that care should be taken when estimating parameters and their uncertainty ranges.
Outlook
Our inference scheme based on long IBD blocks requires large amounts of data, as it needs dense genotype data from a few dozen individuals, spatial information of the samples, and a linkage map. However, the novel opportu-nities and advantages for inference of recent demography should justify the effort. The possibility to accurately estimate dispersal distances and past effective population densities could yield interesting novel insights for a whole range of organisms. The necessary data sets are within reach for several systems, and they will become even more accessible in the near future with increasing genotyping capacities.
A salient extension of our model would be to address complications such as anisotropy (Jay et al. 2013) and large-scale heterogeneities in migration patterns or pop-ulation densities across the landscape. For classic mea-sures of genetic similarity, elaborate computational techniques have been recently applied for inference within such complex demographic scenarios (Duforet-Frebourg and Blum 2014; Petkovaet al.2016). As argued above, analysis of IBD blocks would be even more suited to this task, as the length of shared blocks gives additional information. However, analytical solutions, which hugely facilitate inference, are likely no longer feasible. Infer-ence will have to be based on numerical predictions, al-though using block sharing of different lengths will be even more computationally intensive than extracting in-formation from a single genetic similarity matrix. Conse-quently, this challenge is beyond the scope of this article. We hope that future work will help to fully use the po-tential of shared IBD blocks, and that our inference scheme marks only one step in a new era of demographic inference.
Figure 9Left panel: Age of shared IBD blocks. Density of blocks of certain length originating
Acknowledgments
We thank Melinda Pickup, Himani Sachdeva, Tiago Paixao, Srdjan Sarikas, Julia Huber, and members of the Coop laboratory for helpful comments on previous drafts of this article. We thank the two anonymous reviewers for help-ful feedback. The research leading to these results has received funding from the European Research Council (ERC) under the European Union’s Seventh Framework Pro-gramme (FP7/2007-2013)/ERC grant agreement number 250152 (N.H.B.).
Literature Cited
Abramowitz, M., and I. A. Stegun, 1964 Handbook of Mathemat-ical Functions: With Formulas,Graphs,and Mathematical Tables. Number 55. US Department of Commerce/National Bureau of Standards.
Baharian, S., M. Barakatt, C. R. Gignoux, S. Shringarpure, J. Errington et al., 2016 The great migration and African-American genomic diversity. PLoS Genet. 12: e1006059. Barton, N. H., F. Depaulis, and A. M. Etheridge, 2002 Neutral
evolution in spatially continuous populations. Theor. Popul. Biol. 61: 31–48.
Barton, N. H., J. Kelleher, and A. M. Etheridge, 2010 A new model for extinction and recolonization in two dimensions: quantifying phylogeography. Evolution 64: 2701–2715.
Barton, N. H., A. M. Etheridge, J. Kelleher, and A. Véber, 2013 Inference in two dimensions: allele frequencies versus lengths of shared sequence blocks. Theor. Popul. Biol. 87: 105–119.
Browning, B. L., and S. R. Browning, 2011 A fast, powerful method for detecting identity by descent. Am. J. Hum. Genet. 88: 173–182.
Browning, S. R., and B. L. Browning, 2012 Identity by descent between distant relatives: detection and applications. Annu. Rev. Genet. 46: 617–633.
Browning, S. R., and B. L. Browning, 2015 Accurate non-parametric estimation of recent effective population size from segments of identity by descent. Am. J. Hum. Genet. 97: 404–418.
Chiang, C. W., P. Ralph, and J. Novembre, 2016 Conflation of short identity-by-descent segments bias their inferred length distribution. G3 (Bethesda) 6: 1287–1296.
Coffman, A. J., P. H. Hsieh, S. Gravel, and R. N. Gutenkunst, 2016 Computationally efficient composite likelihood statistics for demographic inference. Mol. Biol. Evol. 33: 591–593. Davies, N., Europe: a history. Random House, 2014.
Duforet-Frebourg, N., and M. G. Blum, 2014 Nonstationary pat-terns of isolation-by-distance: inferring measures of local ge-netic differentiation with Bayesian kriging. Evolution 68: 1110–1123.
Fearnhead, P., and P. Donnelly, 2002 Approximate likelihood methods for estimating local recombination rates. J. R. Stat. Soc. Series B Stat. Methodol. 64: 657–680.
Felsenstein, J., 1975 A pain in the torus: some difficulties with models of isolation by distance. Am. Nat. 109: 359–368. Fenner, J. N., 2005 Cross-cultural estimation of the human
gen-eration interval for use in genetics-based population divergence studies. Am. J. Phys. Anthropol. 128: 415–423.
Fisher, R. A., 1937 The wave of advance of advantageous genes. Ann. Eugen. 7: 355–369.
Gao, F., and A. Keinan, 2016 Inference of super-exponential hu-man population growth via efficient computation of the site
frequency spectrum for generalized models. Genetics 202: 235–245.
Gusev, A., J. K. Lowe, M. Stoffel, M. J. Daly, D. Altshuler et al., 2009 Whole population, genome-wide mapping of hidden re-latedness. Genome Res. 19: 318–326.
Harris, K., and R. Nielsen, 2013 Inferring demographic history from a spectrum of shared haplotype lengths. PLoS Genet. 9: e1003521.
Hellenthal, G., G. B. Busby, G. Band, J. F. Wilson, C. Capelliet al., 2014 A genetic atlas of human admixture history. Science 343: 747–751.
Jay, F., P. Sjödin, M. Jakobsson, and M. G. Blum, 2013 Anisotropic isolation by distance: the main orientations of human genetic differentiation. Mol. Biol. Evol. 30: 513–525.
Joseph, T., M. Hickerson, and D. Alvarado-Serrano, 2016 Demographic inference under a spatially continuous coalescent model. Heredity (Edinb). 117: 94–99.
Keinan, A., and A. G. Clark, 2012 Recent explosive human pop-ulation growth has resulted in an excess of rare genetic variants. Science 336: 740–743.
Kelleher, J., A. Etheridge, and N. Barton, 2014 Coalescent simu-lation in continuous space: algorithms for large neighbourhood size. Theor. Popul. Biol. 95: 13–23.
Kimura, M., and G. H. Weiss, 1964 The stepping stone model of population structure and the decrease of genetic correlation with distance. Genetics 49: 561–576.
Kong, A., D. F. Gudbjartsson, J. Sainz, G. M. Jonsdottir, S. A. Gudjonsson et al., 2002 A high-resolution recombination map of the human genome. Nat. Genet. 31: 241–247. Leblois, R., A. Estoup, and F. Rousset, 2003 Influence of
muta-tional and sampling factors on the estimation of demographic parameters in a“continuous”population under isolation by dis-tance. Mol. Biol. Evol. 20: 491–502.
Leblois, R., F. Rousset, and A. Estoup, 2004 Influence of spatial and temporal heterogeneities on the estimation of demographic parameters in a continuous population using individual microsatellite data. Genetics 166: 1081– 1092.
Lemey, P., A. Rambaut, J. J. Welch, and M. A. Suchard, 2010 Phylogeography takes a relaxed random walk in contin-uous space and time. Mol. Biol. Evol. 27: 1877–1885.
Li, H., and R. Durbin, 2011 Inference of human population history from individual whole-genome sequences. Nature 475: 493– 496.
Lindsay, B. G., 1988 Composite likelihood methods. Contemp. Math. 80: 221–239.
Lynch, M., S. Xu, T. Maruki, X. Jiang, P. Pfaffelhuber et al., 2014 Genome-wide linkage-disequilibrium profiles from sin-gle individuals. Genetics 198: 269–281.
Malécot, G., 1948 Les Mathematiques de l’heredite. Masson et Cie, Paris.
McEvedy, C., and R. Jones, 1978 Atlas of World Population History. Penguin Books, London.
Meirmans, P. G., 2012 The trouble with isolation by distance. Mol. Ecol. 21: 2839–2846.
Nagylaki, T., 1978 A diffusion model for geographically struc-tured populations. J. Math. Biol. 6: 375–382.
Nelson, M. R., K. Bryc, K. S. King, A. Indap, A. R. Boyko et al., 2008 The population reference sample, popres: a resource for population, disease, and pharmacological genetics research. Am. J. Hum. Genet. 83: 347–358.
Novembre, J., and M. Slatkin, 2009 Likelihood-based inference in isolation-by-distance models using the spatial distribution of low-frequency alleles. Evolution 63: 2914–2925.
Palamara, P. F., T. Lencz, A. Darvasi, and I. Pe’er, 2012 Length distributions of identity by descent reveal fine-scale demo-graphic history. Am. J. Hum. Genet. 91: 809–822.
Petkova, D., J. Novembre, and M. Stephens, 2016 Visualizing spatial population structure with estimated effective migration surfaces. Nat. Genet. 48: 94–100
Pooley, C., and J. Turnbull, 2005 Migration and Mobility in Britain Since the Eighteenth Century. Routledge, London.
Ralph, P., and G. Coop, 2013 The geography of recent genetic ancestry across Europe. PLoS Biol. 11: e1001555.
Robledo-Arnuncio, J., and F. Rousset, 2010 Isolation by distance in a continuous population under stochastic demographicfl uc-tuations. J. Evol. Biol. 23: 53–71.
Rousset, F., 1997 Genetic differentiation and estimation of gene
flow from f-statistics under isolation by distance. Genetics 145: 1219–1228.
Rousset, F., 2000 Genetic differentiation between individuals. J. Evol. Biol. 13: 58–62.
Vekemans, X., and O. Hardy, 2004 New insights fromfine-scale spatial genetic structure analyses in plant populations. Mol. Ecol. 13: 921–935.
Von Foerster, H., P. M. Mora, and L. W. Amiot, 1960 Doomsday: Friday, 13 November, 2026. At this date human population will approach infinity if it grows as it has grown in the last two millenia. Science 132: 1291–1295.
Watts, P. C., F. Rousset, I. J. Saccheri, R. Leblois, S. J. Kemp
et al., 2007 Compatible genetic and ecological estimates of dispersal rates in insect (Coenagrion mercuriale: Odo-nata: Zygoptera) populations: analysis of ‘neighbourhood size’ using a more precise estimator. Mol. Ecol. 16: 737– 751.
Wijsman, E. M., and L. L. Cavalli-Sforza, 1984 Migration and ge-netic population structure with special reference to humans. Annu. Rev. Ecol. Syst. 15: 279–301.
Wilkins, J. F., 2004 A separation-of-timescales approach to the coalescent in a continuous population. Genetics 168: 2227– 2244.
Wilkins, J. F., and J. Wakeley, 2002 The coalescent in a continu-ous,finite, linear population. Genetics 161: 873–888.
Wright, S., 1943 Isolation by distance. Genetics 28: 114–138.
Appendix A: Effective Density
We use diffusion to model the separation of two lineages backward in time. Letrðx;tÞdenote the probability density of the vector x of pairwise distances along each axis at timetback. In our model, two lineages coalesce instantaneously at an average coalescence ratenðxÞdepending onx:For the probability of coalescing at timetago, we get:
cðtÞ ¼
Z
R2rðx;tÞnðxÞdx:
In cases where only discrete sample distancesxare possible, such as the stepping stone model, the integral has to be replaced with a sum. The key observation is thatnðxÞis usually negligible outside a small area around the origin, since in most models only very close samplesðjxj sÞhave an appreciable chance to coalesce. Within such small areas around the origin, fort1 we approximaterðx;tÞwithrð0;tÞand get:
cðtÞ rð0;tÞ
Z
R2
nðxÞdx¼rð0;tÞ 1 2De;
(A1)
where we have defined 1 2De:¼
R
R2nðxÞdx:It can be shown that stepping stone models asymptotically converge to this model
when rescaling appropriately (Bartonet al.2002, 2013). With demes separated by one distance unit,Decorresponds to the number of diploid individuals per deme, which motivates the name effective density. Here we give this more general definition ofDeto allow one to directly calculate its value in various scenarios we simulated above (seeFile S2).
Appendix B: Chromosomal Edge Effects
Here, we give the full result for block sharing that includes chromosomal edge effects, which we use for inference. We shall denote the Equation 9 withfixedG¼1M withnLðbÞ;where the dependencies other thanbare suppressed for ease of notation. Then, integrating Equation 4 yields:
E½NL ¼ ðG2LÞnLðbÞ þnLðb21Þ;
the formula for one chromosome of lengthG. For multiple chromosomes of different lengths, one has to sum this formula over all chromosomes. For pairs of diploid individuals, the resulting formula also has to be multiplied by a factor of four, since for every pair of individuals four pairs of chromosomes are compared.
Appendix C: Likelihood
Using the Poisson approximation (Equation 11), the likelihood of a pair of samplesðjÞat distancersharing blocks of length L
! ¼L1;L2;. . .;Ln falling into a set of binsi1;i2;. . .;inis given by:
e
fj¼Pr
L
!r;u ¼
Cli1li2⋯linexp 2 X
i
li !
; (C1)
where Cabsorbs all constants that do not depend on the model parametersu—this constant can be dropped when doing likelihood-based analysis. Continuing to assume independence, we take the product over all pairwise likelihoodsefjto get the total composite likelihood:
~f!L;u ¼ Y Pairs j
e
fj
Lj !
;rj;u ;
where!Lj denotes the shared blocks of thejth pair.
for every individual pair. Denoting the length bins of blocks shared over all pairs byi1;i2;. . .;inand the number of pairwise
comparisons bykyields:
Pr
L !r;u;
k ¼Cknli1li2⋯linexp 2k X
i
li !
;
where the factorCkndoes not depend on the model parameters and can be dropped when maximizing the likelihood.
Appendix D: Block Detection Errors
The probability densityl~ðyÞof actually observing a pairwise shared block of lengthycan be calculated from the theoretical probabilitylðxÞof sharing true blocks of lengthx:
~
lðyÞ ¼fðyÞ þ
Z G
0
Rðy;xÞcðxÞlðxÞdx; (D1)
wherefðyÞdescribes the false-discovery-rate function depending on block lengthy,cðxÞis the power to detect a block of length x, and Rðy;xÞ is the probability of detecting a block of true length xas block of lengthy. Doing a careful analysis using techniques such as manually inserting shared blocks and rerunning the IBD block detection allows one to estimate these error functions (Ralph and Coop 2013).