ABSTRACT
FU, SHA. High Efficiency Ultra-Deep Dyeings of Cotton via Mercerization and Cationization. (Under the direction of Dr. David Hinks and Dr. Peter Hauser).
Cotton has been a major textile fiber for centuries due to its unique comfort, good dyeability, ease of production, biodegradability, and relatively low cost. To satisfy consumers aesthetically, cotton products, like garments and household textiles, must have a large color gamut and satisfactory fastness. One of the most popular “colors” is black. However, obtaining deep shades, especially black, on cotton with good colorfastness properties in an environmentally responsible way is difficult since all kinds of blacks dyes have their own limitations, such as the environmental toxicity of sulfur dyes, poor wash fastness of direct dyes and large amount of dye and salt in the dye bath effluent of fiber-reactive dyes.
Results show that both mercerization and cationization are effective in increasing the depth of shade on cotton fabrics. In addition, the colorfastness properties, except colorfastness to wet crocking, of mercerized-cationized cotton fabrics dyed without salt are much better than untreated cotton fabrics dyed using a conventional dyeing procedure.
High Efficiency Ultra-Deep Dyeings of Cotton via Mercerization and Cationization
by Sha Fu
A thesis submitted to the Graduate Faculty of North Carolina State University
in partial fulfillment of the requirements for the degree of
Master of Science
Textile Chemistry
Raleigh, North Carolina 2013
APPROVED BY:
_______________________________ ______________________________ Dr. David Hinks Dr. Peter Hauser
Co-chair of Advisory Committee Co-chair of Advisory Committee
DEDICATION
BIOGRAPHY
ACKNOWLEDGMENTS
TABLE OF CONTENTS
CHAPTER 1 INTRODUCTION ... 1
1.1 Thesis Outline ... 1
1.2 Research Objectives ... 1
CHAPTER 2 LITERATURE REVIEW ... 2
2.1 Composition of Cotton Fiber ... 2
2.2 Coloration of Cotton ... 4
2.2.1 Classification of Dyes via the Color Index ... 5
2.2.2 Direct Dyes ... 5
2.2.3 Reactive Dyes ... 6
2.2.4 Azoic Dyes ... 8
2.2.5 Vat Dyes ... 10
2.2.6 Sulfur Dyes ... 11
2.3 Dyeing of Cotton for Deep Black Shades ... 11
2.4 Pretreatments of Cotton to Improve Dyeing Properties ... 13
2.4.1 Mercerization ... 14
2.4.1.1 Changes in Structure and Properties of Cellulose Due to Mercerization ... 14
2.4.1.2 Mercerization Methods and Machines ... 16
2.4.1.3. Evaluation of Mercerization Effects ... 18
2.4.2 Cationization ... 19
2.4.2.2 Cationization of Cellulose with CHPTAC ... 23
2.4.2.3 Application Techniques of CHPTAC ... 26
CHAPTER 3 EXPERIMENTAL ... 27
3.1 Materials ... 27
3.2 Equipment ... 27
3.3 Cationization Pretreatment ... 28
3.4 Dyeing Process ... 29
3.4.1 Conventional dyeing procedure ... 29
3.4.2 No Salt Dyeing Procedure ... 31
3.5 Nitrogen Content Analysis ... 32
3.6 Color Measurement ... 32
3.7 Evaluation of Dye Uptake ... 33
3.8 Colorfastness Tests ... 33
3.8.1 Colorfastness to Laundering ... 33
3.8.2 Colorfastness to Crocking ... 35
3.8.3 Colorfastness to Light ... 35
3.9 Mechanical Properties of Yarns ... 36
3.10 Pilling Resistance of Fabrics ... 36
CHAPTER 4 RESULTS AND DISCUSSION ... 37
4.1 The Effects of Cationization and Mercerization ... 37
4.1.1 Nitrogen Content Analysis ... 37
4.1.3 The Effect of Mercerization and Cationization on Colorfastness ... 44
4.1.3.1 Colorfastness to Laundering ... 45
4.1.3.2 Colorfastness to Crocking ... 46
4.1.3.3 Colorfastness to Light ... 47
4.1.4 The Effects on Physical Properties ... 48
4.1.4.1 The Mechanical Properties of Yarns ... 49
4.1.4.2 Pilling Resistance of Fabrics ... 51
4.2 Color Modification to Produce Ultra-Deep Black Shades ... 52
4.2.1 Binary Dyeing Recipes ... 52
4.2.2 Dyeing Performance of MC Samples with Two-Dye Combination ... 55
4.2.3 Colorfastness of MC Samples ... 60
4.2.3.1 Colorfastness to Laundering ... 60
4.2.3.2 Colorfastness to Crocking ... 61
4.2.3.3 Colorfastness to Light ... 62
4.3 The Effects of Na2CO3 on Dyeing with Remazol Black B ... 64
4.3.1 The Effects of Na2CO3 on Dyeing Performance ... 64
4.3.2 The Effects of Na2CO3 on Colorfastness ... 70
4.3.2.1 Colorfastness to Laundering ... 70
4.3.2.2 Colorfastness to Crocking ... 71
4.3.2.3 Colorfastness to Light ... 73
4.4.1 The Effects of Na2CO3 on Dyeing Performance ... 76
4.4.2 The Effects of Na2CO3 on Colorfastness ... 79
4.4.2.1 Colorfastness to Laundering ... 79
4.4.2.2 Colorfastness to Crocking ... 80
4.4.2.3 Colorfastness to Light ... 81
CHAPTER 5 CONCLUSIONS ... 83
CHAPTER 6 FUTURE WORK... 85
LIST OF TABLES
Table 1. Composition of Typical Cotton Fibers ... 2
Table 2. Relative Cost of Dyes for Cellulosic Fibers ... 4
Table 3. Steps in the Preparation of Cotton before Dyeing ... 13
Table 4. Test materials and chemicals ... 27
Table 5. Test Conditions for Washfastness ... 34
Table 6. Option 3 of Machine Exposure Conditions for Colorfastness to Light ... 35
Table 7. Concentrations of Cationization Solutions ... 37
Table 8. Nitrogen Content of Cationized and Uncationized Cotton Fabrics ... 38
Table 9. L* a* b* C* h° Values of Dyed Samples ... 40
Table 10. K/S values of Two Batches of Dyed Samples ... 41
Table 11. Dye Uptake of the Samples ... 42
Table 12. Colorfastness to Laundering ... 45
Table 13. Colorfastness to Crocking ... 46
Table 14. Colorfastness to Light ... 47
Table 15. Peak Load and Elongation of the Yarns ... 49
Table 16. Pilling Resistance of the Fabrics ... 51
Table 17. L* a* b* C* h° Values of MC100 Samples ... 53
Table 18. L* a* b* C* h° Values of MC Samples Dyed with Different Concentrations of Mixed Dyes ... 55
Table 20. Dye Uptake of MC Samples MC Samples Dyed with Different Concentrations of Mixed Dyes ... 58 Table 21. Colorfastness to Laundering of MC Samples Dyed with Different Concentrations of Mixed Dyes ... 61 Table 22. Colorfastness to Crocking of MC Samples Dyed with Different Concentrations of Mixed Dyes ... 62 Table 23. Colorfastness to Light of MC Samples Dyed with Different Concentrations of Mixed Dyes ... 63 Table 24. L* a* b* C* h° Values of Samples Dyed with Different Concentrations of Na2CO3
... 65 Table 25. K/S Values of Samples Dyed with Different Concentrations of Na2CO3 ... 66 Table 26. Dye Uptake of Samples Dyed with Different Concentrations of Na2CO3... 68 Table 27. Colorfastness to Laundering of Samples Dyed with Different Concentrations of Na2CO3 ... 70 Table 28. Colorfastness to Crocking of Samples Dyed with Different Concentrations of Na2CO3 ... 72 Table 29. Colorfastness to Light of Samples Dyed with Different Concentrations of Na2CO3
LIST OF FIGURES
Figure 1. Structure of a Cotton Fiber ... 3
Figure 2. Chemical Structure of Cellulose ... 3
Figure 3. General Structure of a Reactive Dye ... 7
Figure 4. Optical Micrograph of Unmercerized Cotton Fibers ... 15
Figure 5. Optical Micrograph of Mercerized Cotton Fibers ... 15
Figure 6. Yarn Mercerization Machine ... 17
Figure 7. Knit goods mercerizer ... 18
Figure 8. Reaction from 3-chloro-2-hydroxypropyl trimethylammonium Chloride to 2,3-epoxypropyl trimethylammonium Chloride ... 21
Figure 9. Reaction of EPTAC with Cellulose ... 24
Figure 10. Hydrolysis of EPTAC ... 25
Figure 11. Reaction of EPTAC with Carboxyl under Alkaline Conditions ... 25
Figure 12. Reaction of EPTAC with Amine ... 25
Figure 13. Ahiba Texomat Dyeing Machine ... 29
Figure 14. Conventional Dyeing Procedure ... 30
Figure 15. No Salt Dyeing Procedure ... 31
Figure 16. Nitrogen Concentent of Cationized and Uncationized Cotton Fabrics ... 38
Figure 17. K/S Values of Dyed Samples ... 41
Figure 18. Dye Uptake of the Samples ... 43
Figure 19. Colorfastness to Light ... 47
CHAPTER 1 INTRODUCTION 1.1 Thesis Outline
This thesis consists of seven chapters. Chapter 1 is a general introduction which outlines the major parts and research objectives of the research. Chapter 2 provides a literature review of the coloration of cotton fabrics and the pretreatments, mercerization and cationization, which would help to obtain deep black shades on cotton dyed with reactive dyes. Chapter 3 is the experimental section, describing the materials, equipment, cationization method, dyeing procedures and testing methods used in the research. Chapter 4 presents the results and discussion about how the pretreatments would improve the dyeing procedure and dyeing performance of cotton dyed with reactive dyes. The environmentally friendly dyeing procedure to obtain deep neutral black shades on mercerized-cationized cotton fabrics has also been discussed. Chapter 5 lists the conclusions and Chapter 6 gives a short discussion on recommended future work. Chapter 7 is a list of references cited throughout the thesis.
1.2 Research Objectives
CHAPTER 2 LITERATURE REVIEW 2.1 Composition of Cotton Fiber
As a major textile fiber, cotton has been dominant for centuries due to its unique combination of properties, including comfort, renewability, good dyeability and fastness properties, biodegradability and relatively low cost. Depending on the type of cotton and geographic region in which it is grown, the composition of cotton can vary significantly.
In a typical mature cotton fiber, more than 90% of the whole fiber is cellulose. As a natural fiber, cotton also contains small quantities of non-cellulosic materials like pectin, wax, mineral salts and some other impurities. The composition of typical cotton fiber is summarized in Table 1.1-3
Table 1. Composition of Typical Cotton Fibers
Constituent Composition (% of dry weight)
Typical Range
Cellulose 95.0 88.0-96.0
Protein 1.3 1.1-1.9
Pectic substances 0.9 0.7-1.2
Ash 1.2 0.7-1.6
Wax 0.6 0.4-1.0
Total Sugars 0.3 0.1-1.0
the non-cellulosic materials are located on the cuticle or inside the lumen of the fiber whereas the first and second wall of cotton fiber comprises by highly crystalline, oriented cellulose.5
Figure 1. Structure of a Cotton Fiber
The cellulose is composed of 1, 4-β-D-glucose units as shown in Figure 2. Cellulose possesses both primary and secondary alcohol groups. Due to the structure of cellulose, cotton has good reactivity and affinity for a variety of chemicals and dyes.
O
O
O O
HO
OH HOH2C
OH
HOH2C
O HO
n
2.2 Coloration of Cotton
To produce commercially acceptable products that satisfy the consumers aesthetically, a large color gamut is required using dyes and dyeing processes that produce even dyeings of acceptable fastness. Since the first synthetic organic dye, mauveine, was discovered by William Henry Perkin in 1856, many chemical types and classes of dyes have been developed for cotton as well as for other fibers.6 Unlike most fibers, cotton can be dyed with a variety of dye classes with a wide range of costs and application methods depending on the requirements for color and fastness properties. The relative cost for various dye classes are listed in Table 2.7
Table 2. Relative Cost of Dyes for Cellulosic Fibers
Class Relative cost*
Vat leuco ester 1
Vat 2
Reactive 3
Copper-complex direct 4 Diazotisable direct 5 After-copperable direct 5
Azoic 6
Conventional direct 6
Sulfur 7
2.2.1 Classification of Dyes via the Color Index
Dyes can be classified by chemical structure or application method but the chemical names of dyes can be very confusing due to their complicated structure. As a result, the Color Index (C.I.), which is a compendium of dyes, was edited by the Society of Dyers and Colourists in the UK and the American Association of Textile Chemists and Colorists in the USA to help name and identify individual dyes easily. In the Color Index system, a specific name (Color Index Generic Name) and a five digit number (Color Index Constitution Number) are assigned to each individual dye. The generic name is a code containing the application type, hue and an identifying number. For example, the C.I. generic name of indigo is C.I. Vat Blue 1 and its C.I. Constitution Number is 73000. From the name, it’s clear that the application type of indigo is vat and the hue is blue. Based on the C.I. generic name, dyes are divided into classes by their application type, including acid, mordant, disperse, direct, reactive and so on. For the commonly used dye classes of cotton, the coloration mechanisms as well as their advantages and disadvantages are briefly introduced in the following sections.
2.2.2 Direct Dyes
NH2
H2N N
N N
N NaO3S
HO N
H2N
N
SO3Na
1
The advantages of direct dyes include low cost, easy of application and a wide range of available hues, while the major drawback is poor-to-moderate fastness, particularly to washing. After-treatments like applying dye-fixing agents improve the wet fastness but some of these processes would cause changes in shade, brightness and light fastness of the resultant dyed fabrics. But even suitably treated, the wet fastness properties of some direct dyes are still hard to meet current consumer demands for many apparel and furnishing end uses. Hence, the use of direct dyes has gradually decreased and been replaced to a great extent by higher performing dyes such as reactive dyes.10
2.2.3 Reactive Dyes
dyes and the substrate.11 Generally the reactive dyes for cellulosic materials have the basic structure as shown in Figure 3.10
S is the solubilizing groups, confers water solubility to the dye C is the Chromophore, which contributes color to the dye
B is the bridging group, which joins the reactive group to the chromophoric group X is the reactive group, which enables the reaction between the dye and the substrate
Figure 3. General Structure of a Reactive Dye
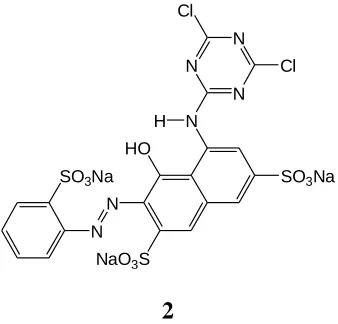
An example of one of the historically important reactive dyes is C.I. Reactive Red 1 (2). In the structure, the sodium sulfonate is the solubilizing group, the diazo group is the chromophore, the secondary amino is the bridging group and the dichloro triazinyl moiety is the reactive group.
SO3Na
N N
SO3Na
N HO
NaO3S
H
N N
N Cl
Cl
2
The first commercial reactive dye for cellulose was marketed in April 1956, just a century after the discovery of mauveine.12 Due to previously unobtainable shades with excellent wet fastness properties, reactive dyes have been fully developed and are commercially widely used. Almost 45% of all textile dyes produced annually belongs to the reactive class due to the extensive use of these dyes for coloring cellulose and viscose materials.13
However, reactive dyes also have some drawbacks: fair light fastness, low chlorine resistance, relatively high cost and low reaction efficiency. Due to the competing hydrolysis reaction of the reactive dyes, dye fixation efficiency on cellulosic fibers is generally low. Cotton fabrics are predominantly dyed with reactive dyes in the presence of substantial amounts of electrolyte and alkali. Without expensive waste water treatment, the appreciable dye and salt concentrations in the dyeing effluent produce serious environmental problems. Ever since reactive dyes were commercialized, research has continued to improve the dyeing procedures and dyeing efficiencies of reactive dyes on cotton and other fabrics.
2.2.4 Azoic Dyes
OH N O
H
NH2
OCH3
NO2
3 4
In the dyeing process with azoic dyes, the textile materials are first treated with naphthols which have affinity for the cellulosic materials. And the napthols can be classified based on the affinity for cotton while the higher the affinity the better rubfastness the formed dye would have.9 Then the base is converted into water-soluble diazo compound by the process called diazotization. Finally, the reaction between the diazotized form of the base and the treated material form the color inside the fabrics. This step is known as coupling or development.
2.2.5 Vat Dyes
Vat dyes are one of the most important dye-classes for cellulosic materials, since they provide excellent wash and light fastness properties.14 They are used to dye cellulosic materials in relatively dull shades with good fastness, especially when fastness to chlorine is important. The most commonly used dye in the word is C.I. Vat Blue 1, indigo (5), due to the popularity of blue jeans. However, as an exception to the general rule of vat dyes having good colorfastness, indigo has poor colorfastness properties.
N H
O HN
O
5
2.2.6 Sulfur Dyes
The use of sulfur dyes in dyeing involves the same principles as vat dyes, first convert the insoluble pigment into a leuco compound by reduction with sodium sulfide then oxidize the leuco compound inside the fiber. The chemistry of sulfur dyes is very complex since they are synthesized by heating simple amines or phenolic compounds in the presence of sulfur.9 Sulfur dyes are economical and widely used for dyeing deep muted shades like black, navy, brown, olive and blue.14 They have high washfastness, fair lightfastness and low bleachfastness.15
However, the large amounts of sodium sulfide used in the manufacture and application of sulfur dyes can cause serious environmental problems.16 Therefore a lot of researches have been done to find suitable alternative reducing agents for sulfur dyes such as thiourea dioxide and glucose.17,18
2.3 Dyeing of Cotton for Deep Black Shades
of sulfur dyes is limited and other dye classes are becoming more preferable. Moreover, none of the dye classes used for cotton can obtain ultra-deep blacks with good wash fastness.
Since direct dyes exhibit poor wash fastness properties, reactive dyes are the most common replacement of sulfur dyes, especially for dyeing deep black shades. Even though many commercial reactive black dyes have relatively good fastness properties and deep shades, they all have a common problem of high concentration of dye and salt in dye bath effluent. As reported, for most kinds of reactive black dyes, the fixation ratio is lower than 70% even with high concentration of salt added.19,20 Hence, substantial amounts of dyes are released into the environment which also increases the cost of dyeing.
For example, C.I. Reactive Black 5 (6, e.g., Remazol Black B) is commonly used as the navy component in reactive black mixtures. However, its fixation ratio of it is relatively low.
O N S S N N N S O O O S O O Na O O O O O O N S O O O S O
O O O
Na
Na Na
H H H
C.I. Reactive Black 5 is an azo dye. The decoloration of effluent contains azo dyes is often a major concern in wastewater treatment since some azo dyes or their metabolites may be mutagenic.21 A significant amount of research on the decolorization of dye bath effluent has been done, including biological treatment, membrane separation processes, adsorption, oxidation and reduction.22-25 Many physical and chemical treatment processes are effective for the decolorization of dyeing effluent, but most of them are too expensive and difficult to apply.26 So rather than trying to develop a good method to decolorize dye bath effluent, increasing dye fixation and developing a more environmentally responsible dyeing procedure would be a better solution since it can also help to obtain ultra-deep dyeings. To increase the dye uptake and fixation of the dyeing process with reactive dyes, pretreatments like combined mercerization and cationization would likely be effective.
2.4 Pretreatments of Cotton to Improve Dyeing Properties
Before dyeing, cotton fabrics go through several preparation steps to ensure good dyeability and uniform appearance. The common preparation steps before dyeing are listed in Table 3.7
Table 3. Steps in the Preparation of Cotton before Dyeing
Process Description
Singeing Burning off surface fibers to make the fabric smooth Desizing Removing the size from warp yarns in woven fabrics
The steps described above are the most common preparation steps before the dyeing of cotton, while to improve the dyeability of cotton fabrics and reduce the chemicals used in the dyeing process, pretreatments like mercerization and cationization may be employed.
2.4.1 Mercerization
Mercerization was discovered by John Mercer in 1844 and patented in 1850. However, this process did not become popular until H. A. Lowe found that the luster of the fabric would be improved after the cold caustic soda acted on cotton under tension.27 During the mercerization process, the fiber structure of cotton is greatly changed and results in changes of not only luster but also other properties like gain in strength, increased moisture absorption, dyeability and reactivity.
2.4.1.1 Changes in Structure and Properties of Cellulose Due to Mercerization
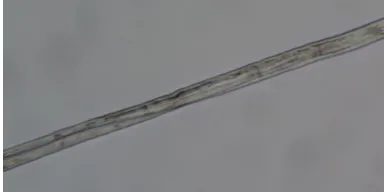
Figure 4. Optical Micrograph of Unmercerized Cotton Fibers
Figure 5. Optical Micrograph of Mercerized Cotton Fibers
The swelling breaks intermolecular hydrogen bonds and allows for reorganization of the cellulose chains. The reorganization includes changes in crystalline structure, reorientation and results in lower crystallinity and smaller crystal sizes of the cellulose fibers.29 After removing the sodium hydroxide solution, the native cellulose I with parallel chains is converted into cellulose II with antiparallel chains, which is more stable.30 As the fiber swells, it also shrinks in length.
to the decreased crystallinity and crystal sizes in the fibers. Also, modifications in fiber structure cause changes in internal light scattering and increase the depth of shade even with the original dye absorption. So the increased depth of shade of mercerized cotton is caused by both the optical effects and increase of dye absorption.27 There are also some improvements in mechanical properties of cotton fibers after mercerization, like improved strength and dimensional stability. These improvements are attributed to the change in orientation degree and the increased cohesion between cotton fibers.
2.4.1.2 Mercerization Methods and Machines
For traditional mercerization, the concentration of caustic soda, applied tension, temperature and time all influence the degree of mercerization. For example, the luster of the fabric increases with the increase of the applied tension during mercerization.31 In order to obtain good mercerization effects, mercerization is commonly conducted under following conditions, 15-18 °C and 31-35% caustic soda solution, dwelling period around 50 seconds, and under tension.27 A number of different kinds of mercerization methodologies have been developed to produce different effects. For example, hot mercerization uses hot caustic soda at a temperature between 60-70°C and this makes the cotton swell slower.22 Other kinds of mercerization include liquid ammonia mercerization and foam mercerization.
impregnated in alkali and in the subsequent washing process.28 Thus, almost all yarn mercerizing machines have similarities in design. A typical yarn mercerizing machine is the two sided yarn mercerizing machine made by Mather & Platt (Figure 6).27
Figure 6. Yarn Mercerization Machine
knit fabrics mercerizing include Dornier, Jaeggli, Caber, etc. Figure 7 shows a typical Dornier continuous mercerizing range for tubular knit goods.27
Figure 7. Knit goods mercerizer
2.4.1.3. Evaluation of Mercerization Effects
2.4.2 Cationization
While in contact with water, negative charges build up on the surface of cotton due to the partial ionization of hydroxyl groups, which produces electrostatic repulsion of negatively charged dyes like reactive dyes. Hence, high concentrations of electrolytes, such as sodium chloride and sodium sulfate, are used in the conventional dyeing procedure of cotton with reactive dyes to suppress the negative charge build-up and reduce the solubility of dyes, thereby increasing dye exhaustion.35 But even with a high concentration of electrolytes, the dye uptake of reactive dyes is still relatively low. As a result, the dye bath wastewater typically contains high concentrations of both salt and unexhausted dye, which cause serious environmental problems. The wastewater pollution can be reduced by synthesis of better dyes, selection of chemicals, re-use of dye bath, process optimization and development of other sustainable technologies.36 However, all these ideas require changes in existing method and equipment which involve significant research expenditures and capital investment.37 Hence, in addition to optimizing the dyeing procedure, modifying the cotton fiber to have greater affinity to reactive dyes and improved reaction efficiency with reduced electrolyte usage is an attractive option to reduce environmental impact.
caused by salt and dye in the effluent can be potentially largely mitigated by cationization pretreatment of cotton yarns or fabrics.
2.4.2.1 Cationic Reagents
Research has focused on the development of different kinds of cationic reagents for the cationization of cotton. Non-reactive cationic reagents are susceptible to desorption and may precipitate with anionic dyes, so cationization with non-reactive cationic reagents cannot be used as an effective pretreatment for cotton.44 The reactive cationic reagents used for cationization of cotton can be divided into two groups, monomeric reagents and polymeric reagents.
In the monomeric reactive cationic reagents, a typical one is 2,3-epoxypropyl trimethylammonium chloride (7) formed by the reaction of its epichlorohydrin precursor, chloro-2-hydroxypropyl trimethylammonium chloride with alkali, as shown in Figure 6. 3-chloro-2-hydroxypropyl trimethylammonium chloride is commercially available as 65% water solution from Dow Chemical Company under the trade name CR-2000.45
CHCH2N CH3
CH3 CH3 H2C
O
Cl
CH2CHCH2N Cl
OH
CH3
CH3
CH3 OH CHCH2N
CH3
CH3 CH3
H2C O
Cl Cl
Figure 8. Reaction from 3-chloro-2-hydroxypropyl trimethylammonium Chloride to 2,3-epoxypropyl trimethylammonium Chloride
Bayer has marketed a similar product, glycidyl-N-methyl morpholinium chloride (8), under the trade name Levogen RS.46
CH H2C
O O H2 C N CH3 Cl 8
Another kind of cationic reagent used for the pretreatment of cellulose is in the structure of cationic groups attached to heterocyclic systems. Examples include reactive mono-quaternary compounds (e.g., 9), mono-reactive mono-quaternary compounds (e.g., 10) and bis-reactive bis-quaternary compounds (e.g., 11). These types of cationic agents exhibit better thermal stability compared with the epoxy types. And the bis-reactive bis-quaternary cationic reagent exhibit higher substantivity for cellulose compared with the mono-reactive ones.44
N N N H N Cl F F CH3 CH3 H3C
Cl
N N N
N HN
Cl CH3
CH3
H3C
Cl N CH3 CH3 CH3 Cl H N 10 N N N Me3N HN
Cl NMe3 Cl H N N N N H N Cl H N Cl 11
Other examples of monomeric cationic reagents which have been used for cationization to improve the dyeing performance of cotton include acryloyloxyethyl trimethylammonium chloride (12), methacryloyloxyethyl trimethylammonium chloride (13), Methacryloylaminopropyl trimethylammonium chloride (14) and 4-benzoylbenzyl trimethylammonium chloride (15).40
N CH3 CH3 CH3 Cl O C O C H H2C
N CH3 CH3 CH3 Cl O C O C H2C
CH3 13 N CH3 CH3 CH3 Cl C O C
H2C N
H CH3 14 N CH3 CH3 CH3 Cl H2 C C O 15
Research on the development and application of polymeric cationic reagents has also been investigated. For example, Lewis and Lei46 studied the dyeing performance of cotton cationized with Hercosett 125 (Hercules Powder Corporation), a commercially available reactive polyamide-epichlorohydrin resin. Compared to monomeric cationic reagents, the disadvantage of polymeric reagents is the poor light fastness of subsequent reactive dyeing caused by ring dyeing.
2.4.2.2 Cationization of Cellulose with CHPTAC
cationization mechanism, application methods, effects in subsequent dyeing and some other properties.37,39,47-50
CHPTAC itself does not react with cellulose. It should first be converted into 2,3-epoxypropyl trimethylammonium chloride (EPTAC) according to the reaction scheme in Figure 6. Then EPTAC would react with alcohols under alkaline conditions to form ethers. So it can be attached to cellulose according to the reaction scheme in Figure 7.39,51 With the electropositive quaternary ammonium attached to the cellulose chains, anionic dyes exhibit higher substantivity towards the fiber.
O O O O HO OH HOH2C
OH
HOH2C
O HO
CHCH2N CH3
CH3
CH3 H2C
O Cl EPTAC OH Cellulose O O O O HO OH HOH2C
OH
OH2C
O HO
HO
N CH3
CH3
H3C
Cationized cellulose
Cl
n
A competing reaction under aqueous alkaline conditions is hydrolysis. Hence, EPTAC slowly hydrolyzes in aqueous alkaline solution to form 2,3, dihydroxypropyl trimethylammonium chloride, as shown in Figure 8.37,39 The diol is not reactive, so the hydrolysis of EPTAC must be minimized.
CHCH2N CH3
CH3
CH3 H2C
O
Cl
OH H2O
CH2CHCH2N
CH3 CH3 CH3 Cl OH OH
Figure 10. Hydrolysis of EPTAC
There are some other common reactions of EPTAC like reacting with carboxyl groups under alkaline conditions as show in Figure 952,53 and react with amines according to the reaction in Figure 10.54
CHCH2N CH3
CH3
CH3 H2C
O
Cl
OH
RCOOH RCOCH2CHCH2N CH3
CH3 OH
O Cl
CH3
Figure 11. Reaction of EPTAC with Carboxyl under Alkaline Conditions
CHCH2N CH3
CH3
CH3 H2C
O
Cl
RNHCH2CHCH2N
CH3 CH3 OH Cl CH3 RNH2
2.4.2.3 Application Techniques of CHPTAC
The cationization of cotton fabric with CHPTAC can be carried out by several methods, including cold pad-batch, pad-bake, pad-steam and exhaustion. The fixation of CHPTAC on cotton fabrics varies greatly with the selection of method, concentration of CHPTAC and alkali, time, temperature, and other variables. The cationization level on the treated cotton fabrics can be quantified by measuring the nitrogen content in the fabrics.
CHAPTER 3 EXPERIMENTAL 3.1 Materials
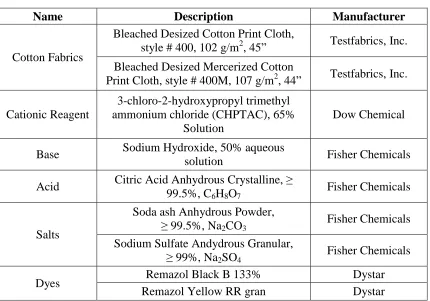
The fabrics and chemicals used are summarized in Table 4 including their names, brief descriptions and manufacturer.
Table 4. Test materials and chemicals
Name Description Manufacturer
Cotton Fabrics
Bleached Desized Cotton Print Cloth,
style # 400, 102 g/m2, 45” Testfabrics, Inc. Bleached Desized Mercerized Cotton
Print Cloth, style # 400M, 107 g/m2, 44” Testfabrics, Inc. Cationic Reagent
3-chloro-2-hydroxypropyl trimethyl ammonium chloride (CHPTAC), 65%
Solution
Dow Chemical
Base Sodium Hydroxide, 50% aqueous
solution Fisher Chemicals
Acid Citric Acid Anhydrous Crystalline, ≥
99.5%, C6H8O7 Fisher Chemicals
Salts
Soda ash Anhydrous Powder,
≥ 99.5%, Na2CO3 Fisher Chemicals Sodium Sulfate Andydrous Granular,
≥ 99%, Na2SO4
Fisher Chemicals
Dyes Remazol Black B 133% Dystar
Remazol Yellow RR gran Dystar
3.2 Equipment
Oven DKN were used. Ahiba Texomat dyeing machine was used for all dyeings. Colorimetric assessments of dyed fabric samples were done by using Spectraflash SF 600X Datacolor Reflectance Spectrophotometer with iMatch software from X-Rite. An HP/Agilent 8453 UV-Vis Spectrophotometer was used to measure the concentration of dyes left in the dyeing bath. An Atlas LEF Launder-Ometer was used to test the colorfastness to laundering of dyed fabrics and an AATCC automated crockmeter made by Atlas was used to test the colorfastness to crocking. Also the colorfastness to light of dyed samples was measured by using an Atlas Ci 3000+ Weather-Ometer. Tensile properties of cotton yarns were measured by using MTS Q-Test/5 Universal Testing Machine. Pilling resistance of fabrics was measured by using Atlas Random Tumble Pilling Machine.
3.3 Cationization Pretreatment
The cold pad batch method with following steps was used for cationization. In both cationization and dyeing procedures, city water was used as in commercial production. 1) A Mathis HVF lab padder was used to pad both unmercerized and mercerized cotton
print cloth at 100% wet pick up (speed: 1.5 m/s, pressure: 1 bar) with varying concentrations of CHPTAC.
2) The padded samples were rolled onto hard paper tubes and wrapped in plastic to prevent contacting with air. Then the fabrics were batched at room temperature for 20 hours. 3) After removing the plastic wrap, the samples were washed to remove unfixed and
3.4 Dyeing Process
An Ahiba Texomat dyeing machine (Figure 11) was used for the dyeing of both uncationized and cationized cotton samples. A conventional dyeing procedure was used for uncationized cotton fabrics and the no salt dyeing procedure was used for the cationized cotton samples. A liquor ratio of 20:1 was used for all dyeings. Besides the dyes, Na2SO4 and Na2CO3 were added in the dyeing procedure of uncationized cotton fabrics while only Na2CO3 was added in the dyeing procedure of cationized cotton fabrics.
Figure 13. Ahiba Texomat Dyeing Machine
3.4.1 Conventional dyeing procedure
5) Hold at 30 °C for 5 minutes.
6) Add half of the Na2CO3 in 5 minutes at 30 °C. 7) Hold at 30 °C for 5 minutes.
8) Heat to 60°C at 1.0°C/min.
9) Add the other half of Na2CO3 in 5 minutes at 60 °C. 10)Hold at 60 °C for 25 minutes.
11)Cool to 40 °C then discard bath.
12)Wash and rinse manually for 10 minutes with room temperature water. 13)Neutralize with citric acid.
14)Wash and rinse manually for 10 minutes with room temperature water. 15)Extract fabric and dry.
3.4.2 No Salt Dyeing Procedure
1) Dissolve dyes in water at room temperature. 2) Immerse the rolled fabric into the solution. 3) Heat to 30 °C.
4) Add Na2CO3 in 5 minutes at 30 °C. 5) Hold at 30 °C for 5 minutes. 6) Heat to 60°C at 1.0°C/min. 7) Hold at 60 °C for 30 minutes. 8) Cool to 40 °C then discard bath.
9) Wash and rinse manually for 10 minutes with room temperature water. 10)Neutralize with citric acid.
11)Wash and rinse manually for 10 minutes with room temperature water. 12)Extract fabric and dry.
3.5 Nitrogen Content Analysis
The percentage of nitrogen present in the cationized cotton fabric was used as an indicator of the amount of CHPTAC reacted with cellulose. The samples used for testing were cut from the cotton fabrics before dyeing procedure. The samples were tested by the Environmental and Agricultural Testing Service in the Department of Soil Science at North Carolina State University. The machine used for the measurement was the PE 400 CHN Elemental Analyzer. The method was based on the classical Pregal and Dumas methods. The samples were combusted in a pure oxygen environment.56
3.6 Color Measurement
A calibrated Datacolor Spectraflash 600X Reflectance Spectrophotometer with iMatch software from X-Rite was used to measure the L*, a*, b*, C*, h° and the K/S values of the dyed fabrics following AATCC Evaluation Procedure 6.57 The K/S value of the sample was calculated by adding the K/S values of each 10 nm from the wavelength of 360 nm to 750 nm.
3.7 Evaluation of Dye Uptake
An Agilent 8453 UV-VISqishi Spectrophotometer was used to measure the absorbance spectra of dye left in the bath after dyeing.
Solutions of dyes were prepared at the following concentrations, 5 mg/L, 15 mg/L, 25 mg/L and 50 mg/L. By measuring the absorbance of the solutions, a Beer’s Law calibration plot of concentration vs. absorbance was produced at the wavelength of max absorption. Then by measuring the absorbance value of the solution after dyeing, the concentration of the solution was determined based on the relationship between concentrations and absorbance values. The dye uptake was calculated based on the concentration of dyes in solution before and after dyeing.
3.8 Colorfastness Tests
3.8.1 Colorfastness to Laundering
Table 5. Test Conditions for Washfastness
Test No.
Temp Total Liquor Volume (mL) Percent Powder Detergent of Total Volume Percent Liquid Detergent of Total Volume Percent Available Chlorine of Total Volume No. Steel Balls No. of Rubber Balls Time (Min) °C (±2)
2A 49 150 0.15 0.23 None 50 0 45
For color change, visually assessed color changes were quantified based on AATCC Evaluation Procedure 1.59 The visual evaluation was done under daylight simulation (D65) using a SpectraLight III viewing booth. The grade of color change was determined by comparing the color difference between the dyed fabrics before and after laundering with the standard AATCC Gray Scale for Color Change. Instrumental assessment of color change was quantified based on AATCC Evaluation Procedure 7.60 Datacolor Spectraflash 600X Reflectance Spectrophotometer with iMatch software from X-Rite was used to measure the color difference of the dyed fabrics before and after laundering and a grade was given for the color change. For each sample, the average value of visually assessed color change and instrumentally measured color change was used as the final grade of color change.
3.8.2 Colorfastness to Crocking
Colorfastness to crocking of the dyed samples was measured using AATCC Test Method 8.62 Both dry and wet crocking test were measured using the AATCC automated crockmeter. In the experiment, the dyed sample was rubbed with a white woven fabric with the length of 50 mm. Each sample was rubbed by the finger in the crockmeter for 10 complete turns. Color transferred from the specimen to the white test square was rated using AATCC Evaluation Procedure 2. The grade of staining for each sample was determined by visual assessment using the standard AATCC Gray Scale for Staining.
3.8.3 Colorfastness to Light
Colorfastness to light of the dyed samples was measured using test option 3 in AATCC Test Method 16 (See Table 6).
Table 6. Option 3 of Machine Exposure Conditions for Colorfastness to Light63
Light Source
Black Panel Temperature
Chamber Air Temperature
Relative Humidity
Irradiance at 420 nm
Irradianc e 300-400
nm
°C °C % W/m2/nm W/m2
Xenon Continuous
Light
63±1 43±2 30±5 1.10±0.03 48±1
quantified using AATCC Evaluation Procedure 1.The color changes were also measured instrumentally using AATCC Evaluation Procedure 7. For each sample, the average value of visually assessed color change and instrumentally measured color change was used as the final grade of color change.
3.9 Mechanical Properties of Yarns
The mechanical properties of yarns, including breaking load and elongation, were measured based on the ASTM Standard Test Method D2256-08.64 The machine used for the test was MTS Q-Test/5 Universal Testing Machine. The gauge length was set as 250 mm and the rate of operation was 300 mm/min. Yarns were extracted from different positions of the cotton fabrics randomly. For each kind of yarn, ten specimens were measured and the average value of tensile strength was calculated after eliminating those values which deviated higher than 25% from the average value.
3.10 Pilling Resistance of Fabrics
The pilling resistance of fabrics was measured using the ASTM Standard Test Method D3512-07.65 Atlas Random Tumble Pilling was used for the test. After running three specimens of each kind of fabric for 30 minutes based on the standard, the appearance of the face of each specimen was rated by visual comparison with photographic standards. The scale used for rating is:
CHAPTER 4 RESULTS AND DISCUSSION 4.1 The Effects of Cationization and Mercerization
To discover the relationship between the concentration of CHPTAC and cationization effect, a series of experiments with different concentrations of CR2000 were designed. The NaOH: CHPTAC molar ratio for cationization was kept constant throughout the work based on previous work by Farrell which found the optimum NaOH: CHPTAC molar ratio to be 2:1.47 In the experiment, both mercerized and unmercerized cotton fabrics were used. Summary data on the fabrics and cationization method are reported in Section 3.1 (page 26) and Section 3.3 (page 27). The concentrations of the cationization solutions are listed in Table 7.
Table 7. Concentrations of Cationization Solutions Solution Number Concentration of
CR2000 (g/L)
Concentration of NaOH (g/L)
1 100 60
2 150 90
3 200 120
4.1.1 Nitrogen Content Analysis
Table 8. Nitrogen Content of Cationized and Uncationized Cotton Fabrics
Sample Pretreatments Concentration
of CR2000 (g/L)
Specimen Number
Nitrogen Content (%)
UU Unmercerized/Uncationized - 1 0.03
2 0.03
MU Mercerized/Uncationized - 1 0.03
2 0.03
UC100 Unmercerized/Cationized 100 1 0.22
2 0.21
UC150 Unmercerized/Cationized 150 1 0.26
2 0.27
UC200 Unmercerized/Cationized 200 1 0.31
2 0.30
MC100 Mercerized/Cationized 100 1 0.23
2 0.23
MC150 Mercerized/Cationized 150 1 0.28
2 0.28
MC200 Mercerized/Cationized 200 1 0.34
2 0.34
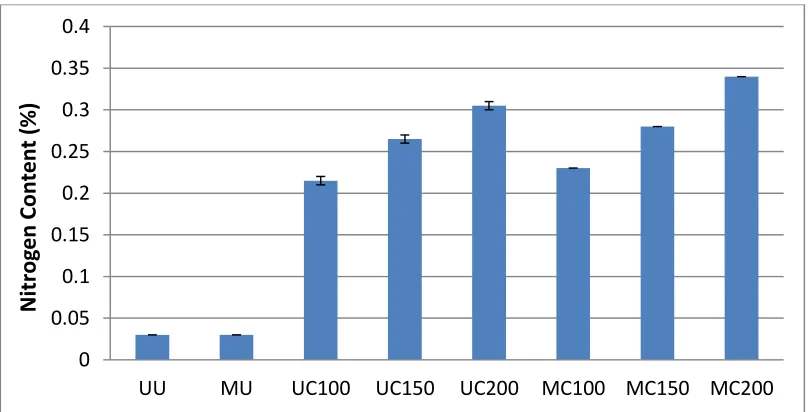
Figure 16. Nitrogen Concentent of Cationized and Uncationized Cotton Fabrics
0 0.05 0.1 0.15 0.2 0.25 0.3 0.35 0.4
UU MU UC100 UC150 UC200 MC100 MC150 MC200
The results show that the nitrogen contents of the uncationized cotton fabrics, both unmercerized and mercerized, are close to zero. However, after cationization, the nitrogen content of the fabrics increased in proportion to the amount of CHPTAC applied. The data indicate that the cationization treatment produces derivatized cellulose consistent with the theoretical degree of cationization. For mercerized cotton fabrics, the increase in nitrogen content is slightly higher than corresponding unmercerized cotton fabrics cationized with the same method. This may be because, after mercerization, the reactivity of cotton was improved due to increased accessibility of primary and secondary hydroxyl groups.
4.1.2 The Effects on Dyeing Performance
To evaluate the dyeing properties of the cationized samples, the treated samples were dyed with 6% owf Remazol Black B (C.I. Reactive Black 5) following the dyeing method given in Section 3.4 (page 28). For uncationized cotton fabrics, the industrial suggested dyeing recipe of Remazol Black B was used, which includes 20 g/L Na2CO3 and 80 g/L Na2SO4. For cationized cotton fabrics, just 20 g/L Na2CO3 was added since the anionic dye has affinity to cationized cotton fabrics.
Table 9. L* a* b* C* h° Values of Dyed Samples
Sample L* a* b* C* h°
UU 19.71 -2.01 -10.83 11.02 259.5
MU 16.42 -0.19 -8.21 8.21 268.7
UC 100 16.70 -0.47 -9.05 9.06 267.0
UC 150 15.78 -0.01 -8.32 8.32 269.9
UC 200 15.28 0.25 -7.86 7.86 271.8
MC 100 14.33 1.09 -6.08 6.18 280.2
MC 150 13.82 1.26 -5.45 5.59 282.9
MC 200 13.75 1.42 -5.21 5.40 285.2
By comparing L* values in Table 9, it’s clear that both mercerization and cationization process decreased the lightness of the dyed fabrics, which means the depth of shade increased. Also, lightness decreased as a function of CR2000 consistent with the nitrogen content analysis.
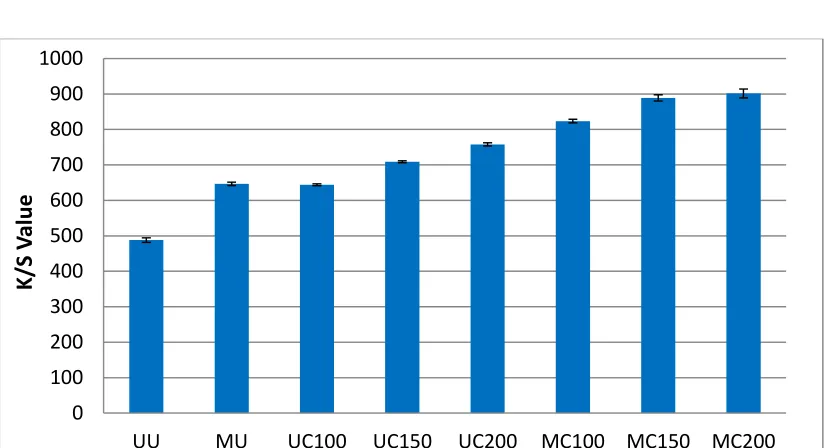
Since the objective of this research is to develop ultra-deep black shades, the K/S values of the dyed samples were measured. The measurement method for the of K/S values was described in Section 3.6 (page 31). The K/S values of duplicate batches of dyed samples were measured and are presented in Table 10 and averaged data are shown in Figure 14. The differences between the K/S values of the duplicate samples are indicated by error bars.
Table 10. K/S values of Two Batches of Dyed Samples
Sample K/S Values
Batch 1 Batch 2
UU 481.2 494.7
MU 642.2 651.2
UC 100 641.0 646.8
UC 150 706.4 711.3
UC 200 762.1 753.7
MC 100 828.8 818.2
MC 150 897.5 880.0
MC 200 913.9 889.1
0 100 200 300 400 500 600 700 800 900 1000
UU MU UC100 UC150 UC200 MC100 MC150 MC200
The results also show that both mercerization and cationization increase the K/S values of the samples as a function of the concentration of CR2000. However, the differences between MC150 and MC200 are small.
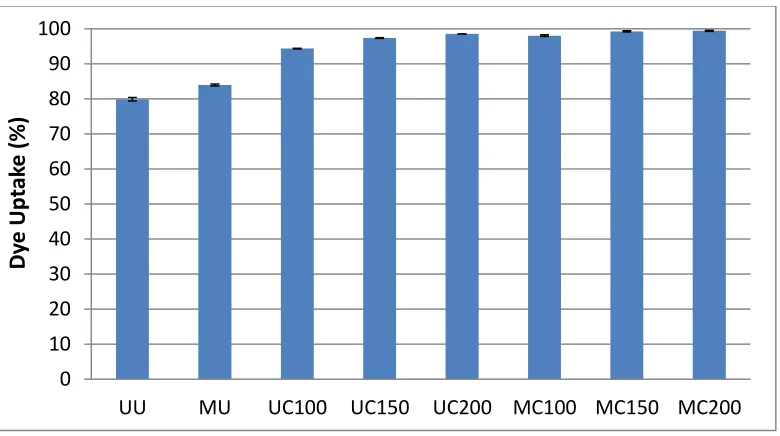
To better evaluate the effects of mercerization and cationization in dyeing properties, the dye uptake values of the two batches of samples were calculated by measuring the absorbance values at wavelength of maximum absorption (λmax) of the dye bath solutions before and after dyeing. The uptake method is described in Section 3.7 (page 31). Table 11 and Figure 15 show the dye uptake values of all samples. The differences between dye uptake values of the duplicate samples are indicated by the error bars.
Table 11. Dye Uptake of the Samples
Sample Dye Uptake (%)
Batch 1 Batch 2
UU 79.4 80.4
MU 84.3 83.7
UC 100 94.5 94.3
UC 150 97.5 97.3
UC 200 98.5 98.6
MC 100 97.8 98.3
MC 150 99.1 99.5
Figure 18. Dye Uptake of the Samples
The results show that both mercerization and cationization increase the dye uptake of the samples. The effect of cationization in increasing the dye uptake is much stronger than mercerization. However, the L* and K/S values of MU and UC100 are similar, which indicates that mercerization and the cationization with 100 g/L CR2000 have similar effects in increasing the depth of shade. Nevertheless, the much higher dye exhaustion means that substantially less dye would be released as effluent. Dyeing with 6% owf Remazol Black B and higher than 95% dye exhaustion constitutes a substantial advance in reducing the environmental impact of dyeing black shades on cotton.
As can be speculated, the effect of cationization in increasing the depth of dyed sample is mostly achieved by attracting and fixing more dye molecules. Different from cationization, mercerization not only increases dye absorption, it also changes the shape of the fibers, thus
0 10 20 30 40 50 60 70 80 90 100
UU MU UC100 UC150 UC200 MC100 MC150 MC200
Dy
e
Upt
ak
e
decreasing the light scattering on the surface and inside the fiber. So even with the same amount of dyes, the perceived color of mercerized samples is deeper. This can be also been proved by the fact that dye uptake values of unmercerized-cationized samples and mercerized-cationized samples are very close but the color of the dyed mercerized-cationized samples are much deeper. Since the effect of increasing color depth by mercerization is not just result from increasing the dye uptake, it is likely necessary to use both mercerization and cationization to obtain ultra-deep dyeings even though the dye uptake values of unmercerized-cationized samples are higher than 95%.
Based on previous results, both mercerization and cationization have been proved to be effective in increasing the depth of dyed color. But the principles of the two treatments in increasing the color depth are different. For mercerization, the effects result from both the increase of dye uptake and the change of fiber shape. For cationization, the increase of color depth is likely only achieved from the increase of dye uptake as a function of the cationization degree. However, the data show that there is a saturation point at high concentrations of cationization solution.
4.1.3 The Effect of Mercerization and Cationization on Colorfastness
4.1.3.1 Colorfastness to Laundering
Colorfastness to laundering of the samples were measured following AATCC Test Method 61. The specific method used for testing the wash fastness was described in Section 3.8.1 (page 32). For each dyed sample, three samples were measured and the average values are summarized in Table 12. Table 12 just lists the staining on cotton strip since staining on other components in multi-fiber test fabric are similar as on cotton.
Table 12. Colorfastness to Laundering
Sample Color Change Staining on Adjacent Cotton
UU 4.5 4±0.0
MU 5 4.3±0.2
UC 100 5 4.5±0.0
UC 150 5 4.5±0.0
UC 200 5 4.5±0.0
MC 100 5 4.5±0.0
MC 150 5 4.5±0.0
MC 200 5 4.7±0.2
4.1.3.2 Colorfastness to Crocking
Both dry and wet crocking fastness properties of the dyed samples were tested using AATCC Test Method 8. The specific method used for testing the crockfastness is described in Section 3.8.2 (page 33). For each dyed sample, three samples were measured and the average values are summarized in Table 13.
Table 13. Colorfastness to Crocking
Sample Dry Crocking Wet Crocking
UU 4.8±0.2 3.5±0.0
MU 5±0.0 3.5±0.0
UC 100 5±0.0 3.5±0.0
UC 150 5±0.0 3.5±0.0
UC 200 5±0.0 3.5±0.0
MC 100 5±0.0 3.2±0.2
MC 150 4.8±0.2 3.2±0.2
MC 200 4.8±0.2 3±0.0
4.1.3.3 Colorfastness to Light
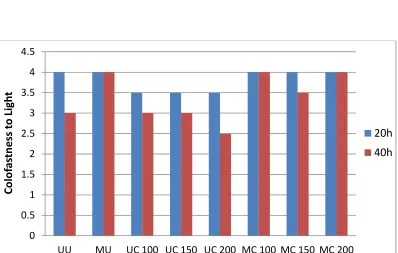
Colorfastness to light of the samples were tested by measuring the color change after 20 and 40 continuous light-on operating hours. The specific method for testing is described in Section 3.8.3 (page 34) and the results are summarized in Table 14 and Figure 16.
Table 14. Colorfastness to Light
Sample Color Change
20h 40h
UU 4 3
MU 4 4
UC 100 3.5 3
UC 150 3.5 3
UC 200 3.5 2.5
MC 100 4 4
MC 150 4 3.5
MC 200 4 4
Figure 19. Colorfastness to Light
0 0.5 1 1.5 2 2.5 3 3.5 4 4.5
UU MU UC 100 UC 150 UC 200 MC 100 MC 150 MC 200
The data show that mercerization improves light fastness properties, whereas cationization is deleterious to photo stability. Cationic groups are probably removed for leading to reduced lightfastness, but this phenomenon appears to be mitigated by the mercerization process in the case of C.I. Reactive Black 5. Further work is warranted to elucidate the mechanism and to determine if this is generally applicable to fiber-reactive and other dye classes.
Previous results shown that cationization helps to improve colorfastness to laundering but has negative effect on colorfastness to wet crocking and light. Mercerization improves light fastness but it has a negative effect on the fastness to wet crocking, although the process does not appear to negatively affect colorfastness to laundering much. Moreover, the colorfastness to dry crocking is at the highest level in all of the samples.
In conclusion, except for colorfastness to wet crocking, all other colorfastness properties of the mercerized-cationized samples are good to excellent. Even for wet crock fastness, the mercerized-cationized samples are acceptable for most commercial applications, although further work is warranted to improve wet crocking.
4.1.4 The Effects on Physical Properties
4.1.4.1 The Mechanical Properties of Yarns
Peak load and elongation at peak load of the both warp and filling yarns of all samples were measured using MTS Q-Test/5 Universal Testing Machine. The specific method and conditions used for the test are described in Section 3.9 (page 34). The average values of the test results are summarized in Table 15. Peak load and elongation at peak load of the samples are shown in Figure 17 and Figure 18 respectively.
Table 15. Peak Load and Elongation of the Yarns
Sample Peak Load (gf)
Elongation at Peak Load (mm)
Warp Filling Warp Filling
Figure 20. Peak Load of Yarns
Figure 21. Elongation at Peak Load
0 50 100 150 200 250 300 350 400
UU UC 100 UC 150 UC 200 MU MC 100 MC 150 MC 200
Warp Filling Pe ak L oad (g f) 0 5 10 15 20 25 30 35 40 45 50
UU UC 100 UC 150 UC 200 MU MC 100 MC 150 MC 200
From the peak load values of the yarns, it is clear that cationization did not influence the strength of the yarns significantly, but mercerization increased yarn strength, especially the warp yarns. Also, based on the elongation at peak load of the yarns, it is clear that neither cationization nor mercerization have a deleterious effect on elongation.
4.1.4.2 Pilling Resistance of Fabrics
Pilling resistances of the samples were measured in duplicate by using a standard AATCC random tumble pilling method. The specific method is described in Section 3.10 (page 35). The average results are summarized in Table 16.
Table 16. Pilling Resistance of the Fabrics
Sample Pilling Resistance
1 2
UU 5 5
MU 5 5
UC 100 5 5
UC 150 5 5
UC 200 5 5
MC 100 5 5
MC 150 5 5
MC 200 5 5
In conclusion, for the experiments conducted using C.I. Reactive Black 5 only:
The lightness and K/S values of the samples show that both mercerization and cationization substantially increased the depth of shade.
Cationization was especially effective in increasing the dye uptake.
Dyeing performance of the fabrics was also improved as a function of CHPTAC concentration.
Mercerized-cationized fabrics exhibited better colorfastness than untreated cotton fabrics, except for wet rub fastness.
Cationization did not negatively affect the mechanical properties of the yarns and pilling resistance of the fabrics.
Except for increasing the peak load of the yarns, mercerization did not influence other tested mechanical properties of the samples.
Even though the mercerized-cationized samples produced a very deep shade, a* b* C* h° values and visual assessment of the samples show that the samples are all deep blue shades. As the goal of our project is to obtain black shades, further experiments were designed to obtain ultra-deep black shades on cotton.
4.2 Color Modification to Produce Ultra-Deep Black Shades 4.2.1 Binary Dyeing Recipes
were added to reduce the blueness of the dyed samples. The pretreated fabric selected was MC100, which was mercerized and cationized with 100 g/L CR2000. Different concentrations of Remazol Yellow RR were used, while all other variables in the dyeing recipe and dyeing method for MC 100 were constant. The L* a* b* C* h° values of MC100 samples are summarized in Table 17 and Figure 19, which is an a* b* diagram and L* scale showing the locations for each sample. In the figure, the coordinate axis on the left is for a* b* values and the one on the right is for L* values.
Table 17. L* a* b* C* h° Values of MC100 Samples Concentration of
Yellow RR (owf) L* a* b* C* h° K/S Value
Figure 22. a* b* and L* values of MC100 Samples Dyed with 6% Remazol Black B and Different Concentrations of Yellow RR
From Figure 19, it’s clear that by adding more Remazol Yellow RR, the a* value decreased from 1.09 to -0.57 and the b* value increased from -6.08 to -0.32. C* values in Table 17 show that with the increase of concentration of Remozal Yellow RR, chroma decreased. C* values of the samples dyed with 2% and 2.5% were close to zero and visual assessment of those samples indicated an excellent deep black hue. If the concentration of Remozal Yellow RR was increased to higher than 2.5%, the C* value may increase further, since the a* value would keep decreasing. Also, the K/S value increased as a function of concentration of Remazol Yellow RR, except for the 2.5% owf sample possibly because that the total concentration of the dyes for the sample is past saturation. Based on the results, both 2% and
0% 0.5% 1% 1.5% 2% 2.5%
a* 1.09 0.18 -0.19 -0.4 -0.48 -0.57 b* -6.08 -3.75 -2.71 -1.54 -0.88 -0.32 L* 14.33 14.23 14.31 14.16 14.12 14.34
10 10.5 11 11.5 12 12.5 13 13.5 14 14.5 15 -7 -6 -5 -4 -3 -2 -1 0 1 2 a* or b * L*
2.5% o.w.f of Remazol Yellow RR were chosen to be applied to other mercerized-cationized samples to evaluate their dyeing performance and wash fastness properties.
4.2.2 Dyeing Performance of MC Samples with Two-Dye Combination
Based on the results of MC100 samples, MC150 and MC200 samples were also dyed by adding 2% and 2.5% owf Remazol Yellow RR to the 6% Remazol Black B (C.I. Reactive Black 5) recipe. Since the total concentration of dyes could be beyond the saturation point, the mercerized-cationized samples were also dyed with 5% Remazol Black B plus 2% Remazol Yellow RR. The concentration of Na2CO3 added and the dyeing procedure for cationized cotton fabrics were kept the same. L* a* b* C* h° values of all the samples were measured and are summarized in Table 18.
Table 18. L* a* b* C* h° Values of MC Samples Dyed with Different Concentrations of Mixed Dyes
Sample
Concentration of Dyes
(owf) L* a* b* C* h°
Black B Yellow RR MC100
5% 2% 14.75 -0.79 -0.96 1.24 230.6
6% 2% 14.12 -0.48 -0.88 1.00 241.1
6% 2.5% 14.34 -0.57 -0.32 0.65 209.4
MC150
5% 2% 14.42 -0.51 0.11 0.52 168.2
6% 2% 14.09 -0.36 -0.15 0.40 202.8
6% 2.5% 14.11 -0.36 0.06 0.37 170.7
MC200
5% 2% 14.27 -0.45 0.11 0.46 166.5
6% 2% 14.04 -0.13 -0.10 0.23 205.9
The L* and C* values of the samples show that all dyed samples are in deep neutral black shade range, especially the MC150 and MC200 samples. Even though the samples dyed with 5% Black B plus 2% Yellow RR are slightly lighter than those samples dyed with 6% Black B plus 2% or 2.5% Yellow RR, the differences are small and the samples visually appear almost the same. To better compare the color depth of the dyed samples, K/S values of all the samples were measured and are summarized in Table 19 and Figure 20, which shows a bar chart of K/S values.
Table 19. K/S values of MC Samples MC Samples Dyed with Different Concentrations of Mixed Dyes
Sample Concentration of Dyes (owf) K/S Value
Black B Yellow RR
MC100
5% 2% 812.1±4.7
6% 2% 882.5±8.5
6% 2.5% 876.7±7.1
MC150
5% 2% 841.1±5.4
6% 2% 901.5±3.9
6% 2.5% 906.9±6.7
MC200
5% 2% 854.5±6.8
6% 2% 915.4±9.8
Figure 23. K/S Values of MC Samples MC Samples Dyed with Different Concentrations of Mixed Dyes
The K/S values also show that the shades of these samples are all very deep especially the MC200 samples dyed with 6% Black B plus 2.5% Yellow RR. Increasing the concentration of Remazol Black B from 5% to 6% increased the K/S values of all three kinds of samples, MC100, MC150 and MC200. At 6% owf for Black B, increasing the concentration of Yellow RR from 2% to 2.5%, the changes in K/S values of the three kinds of samples produced different effects.
For the MC100 sample, an increase in the amount of Yellow RR from 2 to 2.5% slightly decreased the K/S value. This is because the degree of cationization of MC100 is relatively low and it is possible that the MC100 fabrics were beyond the saturation point. In this scenario, the extra Yellow RR added competes with Remazol Black B for the limited reaction
0 100 200 300 400 500 600 700 800 900 1000
5%+2% 6%+2% 6%+2.5%
K /S V al u e
Concentration of Dyes (Black B + Yellow RR) (o.w.f.)
sites on cotton fabric. However, for the MC150 and MC200 samples, increase in the concentration of Yellow RR from 2 to 2.5% increased the K/S values of dyed fabrics. The increase in K/S values of MC200 was more significant, since it has been shown to have higher cationization degree and could therefore absorb more dye.
To examine whether the concentration of dyes was beyond the saturation point, uptake of the samples were measured. Table 20 and Figure 21 show the dye uptake values of all the MC samples as a function of dye concentration.
Table 20. Dye Uptake of MC Samples MC Samples Dyed with Different Concentrations of Mixed Dyes
Sample Concentration of Dyes (owf) Dye Uptake (%)
Black B Yellow RR
MC100
5% 2% 94.5
6% 2% 94.4
6% 2.5% 93.0
MC150
5% 2% 97.7
6% 2% 97.6
6% 2.5% 96.4
MC200
5% 2% 98.8
6% 2% 98.4
Figure 24. Dye Uptake of MC Samples MC Samples Dyed with Different Concentrations of Mixed Dyes
The trend of dye uptake values agrees with previous results that an increase in the concentration of CHPTAC increases the dye uptake. The figure also shows that increasing the concentration of Remazol Black B from 5% to 6% hardly decreased the dye uptake values. However, by further increasing the concentration of Yellow RR from 2% to 2.5%, the dye uptake values of all the samples decreased. Thus, to maintain relative high dye uptake values, MC150 or MC200 samples should be used. Also, the concentrations of dyes used should not be higher than 6% Black B plus 2% Yellow RR using the pretreatment and dyeing method described in this work.
In previous experiments, all mercerized-cationized samples dyed with modified dyeing recipe have deep neutral black shades especially those MC150 and MC200 samples.
80 82 84 86 88 90 92 94 96 98 100
5%+2% 6%+2% 6%+2.5%
Dy e Upt ak e (%)
Concentration of Dyes (Black B + Yellow RR) (o.w.f.)
Lowering the concentration of Black B from 6% to 5% is not effective in increasing the dye uptakes of the samples and decreased the depth of dyed color slightly (although visual differences were very small). Based on the depth of shade and dye uptake values of the samples, the MC150 and MC200 samples dyed with 6% Black B and 2% Yellow RR appear to exhibit best dyeing performances. Considering the cost of dyeing, the MC150 samples dyed with 6% Black plus 2% Yellow RR would likely be the best choice. However, if extremely deep black shades are required, the MC200 sample dyed with 6% Remazol Black B plus 2.5% Yellow RR could be used.
4.2.3 Colorfastness of MC Samples
Fastness properties including wash fastness, rub fastness and light fastness of the samples were measured using the same method as the previously reported experiments.
4.2.3.1 Colorfastness to Laundering
Table 21. Colorfastness to Laundering of MC Samples Dyed with Different Concentrations of Mixed Dyes
Sample Concentration of Dyes (owf) Color Change Staining on Adjacent Cotton Black B Yellow RR
MC100
5% 2% 5±0.0 4.7±0.2
6% 2% 5±0.0 4.5±0.0
6% 2.5% 5±0.0 4.5±0.0
MC150
5% 2% 5±0.0 4.5±0.0
6% 2% 5±0.0 4.5±0.0
6% 2.5% 5±0.0 4.5±0.0
MC200
5% 2% 5±0.0 4.7±0.2
6% 2% 5±0.0 4.5±0.0
6% 2.5% 5±0.0 4.5±0.0
The results demonstrate that colorfastness to laundering of mercerized-cationized samples are as good as the samples dyed with 6% Remazol Black B only.
4.2.3.2 Colorfastness to Crocking