ABSTRACT
MACHADO, PATRICIA VEIGA SILVA. The Impact of Nine-Panel Logo Signs, Logo Familiarity, Logo Format, and Drivers’ Age on Food and Attraction Target Accuracy. (Under the direction of Dr. William Rasdorf.)
Logo signs are large blue signs located in advance of strategic interchanges that allow businesses that provide food, gas, and lodging to promote marketing by placing their logos on these signs. Some of the benefits of participating in the Logo Signing Program include improvement in the businesses’ chances of increasing sales and revenue, the having their logos placed on a large and visible sign along Interstates.
The MUTCD states that the maximum number of business logos per sign is six. The NCDOT desires to increase the maximum number of logos per sign from six to nine. However, once the number of logos per sign increases, the additional information might overload drivers’ capacity to identify businesses placed on logo signs, which reduces the effectiveness of the logos. This could result in an unexpected outcome; businesses might lose interest in participating in the program because drivers are not able to identify their logo from among the nine presented.
A total of 60 participants used a driving simulator to identify both food and attraction logo targets. The scenario simulated a normal Interstate driving environment and both lane and speed deviation data were collected in real time. In addition, eye-tracking equipment was used to collect the participants’ eye movement data including maximum off-road glance duration and fixation frequency to the area of interest (AOI).
Three different analyses were performed to assess target identification accuracy (how accurately drivers can identify a target on a logo sign); ANOVA, contingency tables, and logistic regression. With respect to number of logos per sign, the results showed that drivers’ accuracy was not significantly different between six and nine-panel signs when drivers were looking for familiar logo targets. However, when the logo targets were unfamiliar, drivers had lower accuracy for nine-panel than they did for six-panel sign. Logo familiarity was also found to have a significant effect on accuracy with unfamiliar logos (small and local business) resulting in lower accuracy than familiar logos (chain businesses). With respect to logo format, the results showed that drivers had lower accuracy for symbol-logos than for text-based logos. While the difference was significant, both formats resulted in accuracy of 89% and greater. Another major finding was that elder drivers performed worse than young and middle age drivers; overall, elder drivers had only a 54% accuracy rate, while the other two age groups’ accuracy was above 80%.
The Impact of Nine-Panel Logo Signs, Logo Familiarity, Logo Format, and Drivers’ Age on Food and Attraction Target Accuracy
by
Patricia Veiga Silva Machado
A thesis submitted to the Graduate Faculty of North Carolina State University
in partial fulfillment of the requirements for the degree of
Master of Science
Civil Engineering
Raleigh, North Carolina 2016
APPROVED BY:
_______________________________ ______________________________
Dr. William Rasdorf Dr. Albert Alex
Committee Chair
_______________________________ ______________________________
Dr. Joseph Hummer Dr. David Kaber
ii DEDICATION
iii BIOGRAPHY
iv ACKNOWLEDMENTS
I would like to thank my advisor, Dr. Rasdorf, who opened a new world of opportunities for me. His guidance and dedication throughout my learning process at NC State were fundamental in allowing me to achieve my goals. Thank you for being so patient with my struggles and doubts these two years and for always believing that I was capable of doing great work.
I would like to express my great gratitude to Dr. Kaber who gave me valuable guidance with my statistics analysis and also for accepting a position as part of my committee. I also appreciate Dr. Hummer and Dr. Albert for their help, guidance, and inputs and also for agreeing to be part of my committee.
I would like to thank the graduate students of the research team that I have had the opportunity to work with since the beginning of the project and with and from whom I learned so much. I am also grateful to Morgan Westbrook who helped me revise my thesis.
Apart from my academic life, I want to express my gratitude to all friends that I have made during the last two years in Raleigh. We became a second family that made me feel safe when I found myself far from my family in a foreign country.
v TABLE OF CONTENTS
1.0 INTRODUCTION... 1
1.1 Problem Statement... 3
1.2 Study Objectives... 4
1.3 Research Tasks ... 6
2.0 LITERATURE REVIEW ... 7
2.1 Number of Panels on Logo Signs ... 7
2.2 Logo Format and Familiarity ... 13
2.3 Drivers’ Age ... 17
2.4 Driving Simulator ... 21
3.0 SIGNS... 26
3.1 Logo Signs ... 26
vi
3.3 Other Signs ... 33
4.0 EXPERIMENTAL APPARATUS ... 35
4.1 Driving Simulator ... 35
4.2 Eye Tracking Equipment ... 39
5.0 FIELD SURVEY ... 43
5.1 Sign Dimensions and Distances ... 43
5.2 Logo Familiarity... 52
6.0 METHODOLOGY ... 60
vii
6.2 Driving Scenarios ... 64
6.3 Independent Variables... 67
6.4 Experiment Design ... 75
6.5 Dependent Measures ... 76
6.6 Training Trial ... 78
6.7 Test Trial... 79
6.8 Consent and Demographic Forms ... 80
6.9 General Procedure ... 81
6.10 Hypotheses ... 82
6.11 Data Analysis ... 84
7.0 RESULTS ... 91
viii 7.2 Simple Effect of Miles Driven in the Past Year on Accuracy Under Various
Logo Sign Presentation Formats ... 99
7.3 Dependence of Target Identification on Driving Performance and Visual Behavior ... 103
7.4 Discussion... 105
8.0 CONCLUSIONS ... 111
9.0 RECOMMENDATIONS ... 115
10.0 REFERENCES ... 117
APPENDICES ... 122
APPENDIX A NCDOT LOGO SIGNING PROGRAM ... 123
APPENDIX B PARTICIPANT INSTRUCTIONS ... 130
APPENDIX C CONSENT FORM ... 140
ix LIST OF TABLES
Table 2.1 Summary of Papers by Logo Sign Configurations and Research Methods ... 12
Table 2.2 Summary of Logo Signs Papers by Research Methods and Findings ... 13
Table 2.3 Summary of Papers by Type of Logo and Research Methods ... 16
Table 2.4 Summary of Logo Format and Logo Familiarity Papers by Research Methods and Findings... 17
Table 2.5 Summary of Papers by Driver Characteristics Studied and Research Methods .... 20
Table 2.6 Summary of Driver’s Age Papers by Research Methods and Findings ... 20
Table 2.7 Summary of Papers by Kind of Response Measures Collected in Simulators ... 24
Table 2.8 Summary of Driving Simulator Papers by Research Methods and Findings ... 25
Table 5.1 Comparison Between Familiar and Unfamiliar Lodging Businesses ... 54
Table 5.2 Top 10 Lodging Logos ... 54
Table 5.3 Lodging Logo Data ... 55
Table 5.4 Comparison Between Familiar and Unfamiliar Food Businesses ... 56
Table 5.5 Top 10 Food Logos ... 56
Table 5.6 Food Logo Data ... 57
Table 5.7 Comparison Between Familiar and Unfamiliar Gas Businesses ... 58
Table 5.8 Top 10 Gas Logos ... 58
Table 5.9 Gas Logo Data ... 59
Table 6.1 Trials, Independent Variables Crossing Levels, and Targets ... 76
Table 6.2 Type of Analyzes, Description, and Test Used ... 90
xi LIST OF FIGURES
Figure 3.1 Examples of Six-Panels Logo Sign Located on an Interstate ... 26
Figure 3.2 Logo Sign and Panels ... 29
Figure 3.3 Two Service Logo Sign and Type of Logos ... 29
Figure 3.4 Advance Guide Signs ... 30
Figure 3.5 Exit Direction Guide Sign ... 31
Figure 3.6 Exit Gore Sign E5-1a... 32
Figure 3.7 Distance Guide Sign with Three Destinations D2-3 ... 32
Figure 3.8 Merge Sign W4-1 ... 33
Figure 3.9 Speed Limit Sign R2-1 ... 34
Figure 3.10 Interstate Route Sign M1-1 ... 34
Figure 4.1 Simulation Configuration ... 36
Figure 4.2 Details of the Driving Controls ... 37
Figure 4.3 Eye Tracking System Hardware ... 40
Figure 4.4 Height for Physical Dimension of the Tracking Error at the Screen ... 42
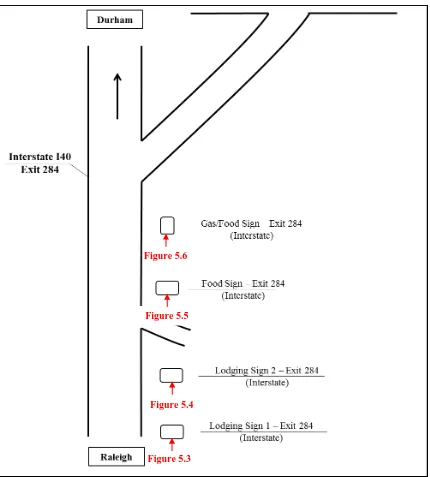
Figure 5.1 Sign Sizes and Distances Between the Signs on I-40 and SR 3015 at Exit 284 .. 44
Figure 5.2 Interchange of I-40 and SR 3015 at Exit 284: Locations from Where the Pictures Were Taken ... 45
Figure 5.3 Lodging Logo Sign 1 on I-40 at Exit 284... 46
Figure 5.4 Lodging Logo Sign 2 on I-40 at Exit 284... 46
Figure 5.5 Food Logo Sign on I-40 at Exit 284 ... 47
xii Figure 5.8 Interchange of I-40 and SR 1652 at Exit 287: Locations from Where the Pictures
Were Taken ... 50
Figure 5.9 Lodging Logo Sign on I-40 at Exit 287... 51
Figure 5.10 Food Logo Sign on I-40 at Exit 287 ... 51
Figure 5.11 Gas Logo Sign on I-40 at Exit 287 ... 52
Figure 6.1 Reported Number of Days Driven per Week ... 62
Figure 6.2 Reported Number of Miles Driven in the Past Year ... 63
Figure 6.3 Reported Frequently Driven Road Types ... 63
Figure 6.4 Overall Layout of the Interchanges in the Interstate Experiment ... 65
Figure 6.5 Type and Spacing of Signs Before an Interchange ... 66
Figure 6.6 Type and Spacing of Signs After an Interchange ... 66
Figure 6.7 Six and Nine-Panel Logo Signs ... 69
Figure 6.8 Distribution of Unfamiliar and Familiar Food Logos on a Six-Panel Food Sign 70 Figure 6.9 Distribution of Unfamiliar and Familiar Logos on Six-Panel Lodging and Gas/Attraction Signs ... 72
Figure 6.10 Familiar and Unfamiliar Logos on a Six-Panel Logo Sign Configuration ... 73
Figure 6.11 Six-Panel With Attraction Text-Based Logos and Nine-Panel With Attraction Symbol-Based Logos ... 75
Figure 7.1 Food Target Accuracy Versus Familiarity ... 93
Figure 7.2 Food Target Accuracy Versus Number of Panels ... 93
Figure 7.3 Food Target Accuracy Versus Age Group ... 94
xiii
Figure 7.6 Attraction Target Accuracy Versus Logo Format ... 99
Figure 7.7 Accuracy by Miles Driven in the Past Year for Six-Panel Logo Signs ... 100
Figure 7.8 Accuracy by Miles Driven in the Past Year for Nine-Panel Logo Signs ... 101
Figure 7.9 Accuracy by Miles Driven in the Past Year for Familiar Logos ... 102
Figure 7.10 Accuracy by Miles Driven in the Past Year for Unfamiliar Logos ... 103
1 1.0 INTRODUCTION
Logo Signing Programs were approved by the Federal Highway Administration (FHWA) through the Highway Beautification Act of 1965 to support the placement of signs in advance of strategic interchanges that allow businesses to promote marketing by placing their logos on these signs. These large blue signs are now located along freeways, interstates, and exit ramps and are referred to as logo signs.
According to the Manual of Uniform Traffic Control Devices (MUTCD) (FHWA, 2009), logo signs (designed by “specific service sign” on the manual) are defined as “guide signs that provide road users with business identification and directional information for services and for eligible attractions” (FHWA, 2009). They are large blue signs that contain logos of business which “shall be limited to gas, food, lodging, camping, attractions, and 24-hour pharmacies” (FHWA, 2009).
2 Additional benefits of participating in the Logo Signing Program include the fact that drivers rely more on those businesses. This may be because the logo signs are state-sponsored and are clearly visible, consisting of 15 feet by 10 feet signs (NCDOT, 2006). Another benefit is that the logo signs located on exit ramps provide drivers with important and timely information about the business location (direction and distance).
However, the MUTCD states that the maximum number of business logos per sign is six and there is a maximum of four logo signs allowed at each interchange. In other words, the maximum number of businesses that can participate in the Logo Signing Program per interchange is limited to 24 (six businesses times four logo signs). This limitation spans all six logo categories: gas, food, lodging, camping, attractions, and 24-hour pharmacies. These limitations are neither explained nor justified in the manual.
The six-panel limitations set by the MUTCD might raise some issues involving businesses as well as the North Carolina Department of Transportation (NCDOT) due to the fact that at some interchanges there is higher advertising demand by businesses (especially near large commercial centers) and consequently more than 24 businesses want their logos displayed at the interchange.
3 After analyzing the crash data, the author found that the crash rate decreased after installation of nine-panel logo signs, and therefore, concluded that there is no reason to not use nine-panel logo signs.
From a business’s’ perspective, it is important that drivers can see and identify their logos on the signs, as there is an average annual investment of $1,200.00 per business per interchange to have their logo on a sign in North Carolina (see Appendix A). This dollar amount may not concern large businesses, but it may represent a significant cost for small and local businesses. Therefore, if the NCDOT wants to increase the number of logos per sign from six to nine, it is important to conduct research to verify how accurately drivers are able to identify a business’s logo on a logo sign. If the case accuracy rate is significantly lower for nine-panel signs than for six-panel signs, NCDOT might reconsider this option.
Despite the fact that the MUTCD has a standard nomenclature for different types of signs, this study (as well as past studies) has adopted different names to identify a specific type of sign or to describe a sign. Therefore, the section 3 of this document presents definitions and explanations of the terms related to logo signs that are necessary to better understand this subject matter.
1.1Problem Statement
4 effectiveness of the logos. It is then possible that businesses might lose interest in participating in the program because drivers are not able to identify a specific logo among the nine presented.
A survey conducted by OTIC, also in 2010, interviewed the 200 businesses that participated in the Oregon Logo Signage Program and found that although 38% of those businesses believed that logo signs were extremely effective, more than half (53%) of those interviewed said that logo signs were “somewhat” effective. Thus, more than half of the businesses were not completely satisfied with the benefits of the program. If the results of that survey are representative of businesses’ satisfaction among different states, precaution should be taken with new logo sign presentation formats in order to ensure that businesses are fully satisfied and do not withdraw from the program due to a lack of sales as might be the case if drivers are unable to identify their logo on the logo signs.
Also, additional logos may require drivers to have a longer off-road glance duration to find the logo target that they are looking for. However, when the maximum off-road glance duration exceeds 2 seconds unsafe conditions for drivers may arise (NHTSA, 2012). Because of this, it is necessary to ensure that a configuration of nine logos per sign does not represent a safety issue to the driver.
1.2Study Objectives
5 deviation) and/or visual behavior (fixation frequency to AOI and maximum off-road glance duration). The following four independent variables were explored.
Age: this study assessed the impact of drivers’ age on logo identification accuracy.
Number of panels: one of the goals was to assess how the number of panels on a logo sign might affect drivers’ logo identification accuracy. As explained before, a nine-panel logo sign presents more information than a six-nine-panel sign, and as a result, drivers might have a lower rate of identification accuracy.
Logo familiarity: this study also explored how the familiarity of the logos may impact the drivers’ accuracy. Some businesses are more familiar to the drivers than others, which poses the premise that drivers may take shorter glances away from the road while viewing a familiar logo. In this research, familiar business were defined as well-known businesses, usually chains, and unfamiliar are typically local businesses with a low name recognition rate by drivers.
6 Given these independent variables, additional analyses were conducted to evaluate the simple effects of miles driven in the past year on target identification accuracy under the different logo sign presentation format and the dependence of target accuracy on fundamental driving performance and visual behavior.
1.3Research Tasks
This study was comprised of eight main research tasks as listed below. It is important to note that tasks 1 to 6 were performed by the research team rather than by one person.
1. Study the logo signs standards defined in the MUTCD (FHWA, 2009).
2. Conduct field surveys with two goals: (1) to determine the logo sign dimensions and the distances between them and (2) to estimate the percentage of familiar and unfamiliar logos for three different categories: lodging, food, and gas.
3. Develop a logo database to be used in the experiment.
4. Determine all signs necessary to create a realistic driving environment to be used in the driving simulator.
5. Design scenarios to be used in the driving simulator which manipulate variables, including, but not limited to, number of interchanges, spacing between the signs, distribution of six and nine-panel signs, of familiar and unfamiliar logos, and of text and symbol-based logos.
6. Data collection, which included 60 experiment participants at an average of 3hours/participant.
7
2.0 LITERATURE REVIEW
The following sections summarize the literature relevant to logo signs. The literature review is organized into four sections: number of panels on logo signs, logo familiarity and format, drivers’ age, and driving simulators.
2.1Number of Panels on Logo Signs
Research about how number of panels on a logo sign might affect driving performance, accuracy, and safety have been ongoing for a number of years, offering a significant body of knowledge on the subject. This section covers six studies that contain a considerable amount of information. To facilitate, the available information was organized into two subcategories: “accuracy” and “driving performance and visual behavior.”
Accuracy
Studies were conducted to compare how an increase from six to nine in the number of panels per logo sign might impact drivers’ ability of identifying a given logo target (accuracy analysis). Hummer and Maripalli (2008) and Dagnall et al. (2013) found that drivers’ accuracy was significantly higher for six-panel than for nine-panel logo sign. In contrast, Zhang et al. (2013) and Kaber et al. (2015) found that the number of panels was not a significant factor influencing drivers’ accuracy.
8 might have more difficulty identifying a target on a nine-panel logo sign than on a six-panel sign during short exposure time, which this research established as 1 second. In this case, accuracy was only 60% for nine-panel configuration. However, when the exposure time increases from 1 to 2.5 seconds, accuracy for nine-panel signs increased from 60% to 89%. Another finding was that the position of the logo on the sign influences the time it takes a participant to identify a target. One limitation of this study was the fact that it was a slide-based experiment, which means that it does not simulate realistic driving conditions nor does it simulate a true driving environment.
Dagnall et al. (2013) conducted a study to evaluate and compare the impact of four-panel, six-panel, and nine-panel logo signs on driver performance. They found that participants had higher rates of accuracy for six-panel configurations than for nine-panel. When the number of panels increased from six to nine on a logo sign, participants required longer reaction times to identify the target. In addition, researchers found that the response accuracy was also a function of the position of the logo on the sign. One limitation of this study was that even though they used an LCD screen to simulate a highway and their data were electronically collected, there was no simulation of real driver conditions and driving tasks.
9 The second study, by NCDOT (Kaber et al., 2015), also analyzed the effects of nine-panel logo signs on driver performance when compared with six-panel logo signs. This study used a driving simulator to create realistic driving conditions. The findings showed that drivers’ accuracy was not statistically different for both six and nine-panel logo signs. One limitation of this second study is that it used a familiar food target (Hardee’s) for all trials. It is postulated that doing so may have made the identification of the target easier for the different configurations of logo signs.
Driving Performance and Visual Behavior
Some studies were conducted in order to analyze how an increase in the number of panels per logo sign might impact drivers’ performance and behavior as well as their safety. Dagnall et al. (2013) concluded that a nine-panel logo sign (compared to a six-panel sign) increases unsafe conditions to drivers because participants required more than 2 seconds (accepted standard of eye glances away from the forward roadway. NHTSA, 2012) to identify a target on the logo sign. On the other hand, studies conducted by Carte and Wang (2007), Simpson (2007), Hummer and Maripalli (2008), Zhang et al. (2013), and Kaber et al. (2015) indicated that there was not significant impact on drivers’ performance when the number of panels per logo signs increases from six to nine.
10 standard as being the total search time (time participant took to determine whether or not the target was on the sign). While indeed the 2 second standard is intended to represent the maximum off-road glance duration at any one glance.
In contrast, Carter’s and Wang’s (2007) findings showed that nine-panel logo signs did not significantly affect driver performance when compared to the standard six-panel logo sign. The study was conducted by analyzing field observed unusual driving behaviors (e.g., breaking and drifting) in the field at specific interchanges where NCDOT installed nine-panel and overflow combination logo signs. The authors concluded that nine-panel logo sign did not increase driver distraction. However, one limitation of this study is that the data were collected using video cameras in the field and then analyzed at the office. Therefore, it was not always possible to determinate the reason for a specific driver behavior.
Using the same procedure as Carter and Wang (2007), Simpson (2007) analyzed the crash data of specific interchanges within North Carolina before and after the installation of nine-panel and overflow combination logos signs. After almost 2 years of data collection, the author concluded that there was no significant evidence that these new configurations of logo signs (nine-panel and overflow combination) have a negative impact on the crash rate, and as a result, there is no reason to forbid their use.
11 Zhang et al. (2013) found that there was no significant effect of nine-panel configuration on either speed deviation or lane deviation. Greater visual attention was required to find targets on nine-panel logo signs and overflow combination signs and off-road fixation frequency was statistically higher for nine-panel than six-panel logo signs. However, the authors said that this result in fact means that drivers were more conservative in the presence of nine-panel signs and they would look back to the road with higher frequency rather than just looking at the sign. In relation to the maximum off-road glance duration, the difference was statistically insignificant and smaller than the 2.0 seconds standard established by NHTSA (2012). Based on these results, the researchers concluded that increasing from six to nine the number of panels on a logo sign does not have a significant effect on driver distraction or safety.
Similar, Kaber et al. (2015) found that there was no significant difference on driver performance (lane deviation and speed deviation) and visual behavior (maximum off-road glance duration and off-road fixation frequency) between six and nine-panel logo signs. The research team concluded that the proposed logo sign configuration (nine-panel) did not significantly affect driver safety.
Summary
12 there are no safety reasons to forbid the use of nine-panel logo signs in areas where there are a large number of businesses.
One measure of effectiveness of a nine-panel logo sign is how accurately drivers can identify a target on a logo sign. Dagnall et al. (2013) and Hummer and Maripalli (2008) found that nine-panel logo signs had lower accuracy, but when the viewing time increases to 2.5 seconds, the accuracy drastically increases. Two other studies (Zhang et al., 2013 and Kaber et al., 2015) found that there was no significant difference with respect to accuracy for six and nine-panel logo signs.
Table 2.1 shows a summary of the most relevant papers discussed here. The “References” column lists the reference cited. “Logo Sign Configurations” refers to the number of logos per sign and to overflow combination logo signs. The “Research Methods” column indicates which method was used in that specific study.
Table 2.1 Summary of Papers by Logo Sign Configurations and Research Methods
References
Logo Sign Configurations Research Methods
Fou r-Pan el Six -Pan el N ine -Pan el T w o Servi ce O ver fl ow C om bina ti on L C D D ispl ay (Sl ides ) Fie ld O bse rvat ions C ras h D at a A nalys is D ri vi n g Sim u lat or
Carter & Wang (2007) - X X - X - X -
Dagnall et al. (2013) X X X - - X - -
Hummer & Maripalli
(2008) - X X X - X - -
Kaber et al. (2015) - X X - - - X
Simpson (2007) - X X - X - X -
13 Table 2.2 shows a summary the papers related to logo signs and their findings. The first column shows the references, the second column shows the methods used by the research team, and the third column summarizes the findings.
Table 2.2 Summary of Logo Signs Papers by Research Methods and Findings
Reference Method Findings
Carter and Wang (2007)
Field observations
Nine-panel logo signs did not affect driver performance when compared to six-panel logo signs.
Dagnall et al. (2013)
Software and one
60-inch LCD monitor
Higher accuracy with six-panel compared to nine- panel logo signs.
Nine-panel logo sign (compared to a six-panel sign) increases unsafe conditions to drivers because participants required off road glance duration longer than 2 seconds to identify the target.
Hummer and Maripalli
(2008)
Slide-based
Higher accuracy with six-panel compared to nine-panel logo signs.
Did not find difference on drivers’ performance when the number of panels increases from six to nine. Kaber et al.
(2015)
Driving simulator
Did not find difference in accuracy between six and nine-panel logo signs.
Did not find difference on drivers’ performance when the number of panels increases from six to nine. Simpson
(2007)
Crash data analysis
Nine-panel logo signs did not have significant impact on crash rate when compared to six-panel signs.
Zhang et al. (2013)
Driving simulator
Did not find difference in accuracy between six and nine-panel logo signs.
Did not find difference on drivers’ performance when the number of panels increases from six to nine.
Nine-panel logo signs required higher off-road fixation frequency.
2.2Logo Format and Familiarity
14 on the response time and recognition of businesses by drivers. The methodology used in this research was to show pictures of logo signs to participants and ask them to indicate whether or not a logo target was present on the sign. In addition to dual-logo panels, the researchers also analyzed how the familiarity of a business influenced the response accuracy. The results showed that there are different response times for familiar versus unfamiliar logos and that dual-logos had a lower recognition rate than single logos at shorter response times. On the other hand, the response accuracy of dual-logos increased with logo familiarity and exposure time. The authors concluded that there was no reason to prohibit the use of dual-logos. However, they recommended that there should be a monitoring of driver performance in the field when exposed to this kind of logo.
Hummer and Maripalli (2008) compared the participants’ accuracy when they were searching for an unfamiliar food logo versus a familiar logo. Unexpectedly, participants had a better performance when looking for unfamiliar logos than for familiar. The authors suggested that these results are due the fact that if there is only one unfamiliar logo among a set of familiar logos, it is an easy target since participants can quickly recognize it through a process of elimination.
15 average response time of all participants increased with the number of panels per sign. These findings indicate that changing the logo format was not helpful in mitigating the effects that nine-panel logo signs have on driver identification performance. The authors also performed a search task which consisted of showing a logo target to the participants and then asking them whether the target was on a logo sign that was displayed on the screen. Based on this task, Dagnall et al. found that participants had higher accuracy (percentage or correct responses when the target was present) for text-based logos than they did for symbol-based logos for both four, six, and nine-panel logo signs; however, it is not clear in the text if these differences were significant.
In the study conducted by Kaber et al. (2015), it was found that distance guide signs (text-based) require lower off-road fixation frequency and maximum off-road glance duration than logo signs (symbol-based), which was the opposite of their hypothesis. One possible explanation is that for a text-based sign, drivers tend to follow a reading pattern (reading from left to right); however, drivers do not have a specific pattern for reading logo signs, which may result in inefficiency. Also, according to the authors, logo signs are significantly larger than distance guide signs, and furthermore, they may require more visual attention. With respect to accuracy, the authors did not find significant difference between distance guide signs and logo signs.
Summary
16 logo and guide signs. In addition, logo familiarity seems to have significant impact on participants’ target identification performance; nevertheless, it is not clear how this variable affects drivers. While Hawkins and Rose (2005) found that driver performance improves with logo (business) familiarity, Hummer and Maripalli (2008) found that participants had higher identification accuracy rate for unfamiliar logos than for familiar logos. The differences may be explained by the different method used in both research studies. Based on these findings, it is clear that further studies are necessary to assess how logo familiarity impacts driver performance.
Table 2.3 shows a summary of the papers discussed above. The column “References” lists the reference cited. “Types of Logo” is divided into three categories: dual-logo, text-based, symbol-based logos, and logo familiarity. The “Research Method” column indicates which method was used in that specific study.
Table 2.3 Summary of Papers by Type of Logo and Research Methods
References
Types of Logos Research Methods
D ual -L ogo T ext -B a se d L ogo or G u ide S ign Symbo l-B as ed L ogo L ogo Fam il iar it y L C D D ispl ay (Sl ides ) Fie ld O bse rvat ions D ri vi n g Sim u lat or
Dagnall et al. (2013) - X X - X - -
Hawkins & Rose (2005) X - X X X - - Hummer & Maripalli (2008) - - X X X - -
17 Table 2.4 shows a summary the papers related to logo format and logo familiarity as well as their findings. The first column shows the references, the second column shows the methods used by the research team, and the third column summarizes the findings.
Table 2.4 Summary of Logo Format and Logo Familiarity Papers by Research Methods and Findings
Reference Method Findings
Dagnall et al. (2013)
Software and one 60-inch
LCD monitor
Elder drivers took longer to identify symbol-based than text-based logos.
Participants had higher accuracy for text-based logos than they did for symbol-based logos (it is not clear if it is a significant difference)
Hawkins &
Rose (2005) LCD display
The response accuracy increased with the familiarity of the logo.
Hummer and Maripalli
(2008)
Slide-based Unfamiliar logos had significantly higher accuracy than familiar logos.
Kaber et al. (2015)
Driving simulator
Guide signs (text-based) required lower off-road fixation frequency and maximum off-road glance duration than logo signs (pictorial-based).
2.3Drivers’ Age
Previous studies have concluded that drivers’ age has a significant impact on crashes or level of distraction caused by in-vehicle device use or by out of vehicle advertising and signs. Using questionnaires, Chen et al. (2007) found that drivers whose age ranges between 25 and 60 years old had a lower crash rate than those who are younger than 25 or older than 60.
18 more time looking at the device’s screen, took longer to complete required tasks, and also committed more task errors than drivers younger than 50 years old.
The study conducted by Hummer and Maripalli (2008) compared the percentage of correct answers between three age groups to verify if age had a significant effect on the participants’ performance. The young group consisted of drivers between 18 and 25 years old and represented novice drivers; the middle age group consisted of participants between 26 and 55 years old and represented experienced drivers; the elder group consisted of drivers between 65 and 75 years-old that were considered to be experienced, however with degrading physical and cognitive abilities compared to the middle age group. The results showed that the middle age group had significantly better accuracy performance than both young and elder groups.
To assess the impact of outdoor advertising, Edquist et al. (2011) conducted a study focused on drivers’ distraction caused by the presence of billboards on the road for different age groups. The researchers found that drivers younger than 25 years old (less than one year of experience) and drivers older than 65 years old were more affected by the presence of billboards than those who are between 25 and 55. Both younger and elder drivers are more likely to be slower in a lane changing task and took longer looking at billboards than they did looking at the road ahead, which can have a negative impact on their safety.
19 cautious when exposed to hazards, e.g. they drove slower in the presence of hazards, which according to the research team might be a form of counterbalance to offset their reduction in perceptual and cognitive abilities.
Dagnall et al (2013) suggested that drivers over the age of 50 might be more affected by the increasing of number of panels on logos signs than younger drivers (less than 50 years old). In addition, they found that elder drivers took significantly longer to identify symbol-based logos than they did to identify text-based logos. This did not occur with younger participants. According to the authors, one possible explanation is that elder participants are not as familiar with the symbol logos as younger drivers are.
Summary
The literature shows that age is an important factor to be considered when studying driver’s performance. Different kinds of distractions and hazards have an impact on younger and elder drivers’ performance and safety when compared with drivers between 25 and 50 years old. Overall, studies suggested that this age influence might be explained by the fact that younger drivers are still inexperienced while elder drivers might have some decline in perceptual and cognitive abilities.
20 Table 2.5 Summary of Papers by Driver Characteristics Studied and Research
Methods
References
Driver
Characteristics Research Methods
A ge D ri vi n g E xperi ence Q ues ti onn ai re s L C D D ispl ay (Sl ides ) D ri vi n g Sim u lat or Inst ru m en ted V ehi cl e
Chen et al. (2007) X - X - - -
Dagnall et al (2013) X - - X - -
Dingus et al. (1989) X X - - - X
Edquist et al. (2011) X X - - X -
Hummer and Maripalli (2008) X X - X - -
Kaber et al. (2012) X - - - X -
Table 2.6 shows a summary the papers related to driver’s age and their findings. The first column shows the references, the second column shows the methods used by the research team, and the third column summarizes the findings.
Table 2.6 Summary of Driver’s Age Papers by Research Methods and Findings
Reference Method Findings
Chen et al.
(2007) Questionnaires
Middle age drivers had a lower crash rate than both young and elder drivers.
Dagnall et al (2013)
Software and one 60-inch LCD
monitor
Drivers over the age of 50 might be more affected by the increasing of number of panels on logos signs than younger drivers.
Dingus et al. (1989)
Instrumented vehicle
Drivers over 50 had worse driving performance than younger drivers.
Edquist et al.
(2011) Driving simulator
Both younger and older drivers are more likely to be slower in a lane changing task and took longer looking at signs than middle age drivers. Hummer and
Maripalli (2008)
Slide-based Middle age group had significantly better accuracy than both young and elder drivers. Kaber et al.
(2012) Driving simulator
21 2.4Driving Simulator
Driving simulators are equipment that reproduce road and traffic conditions using simulation. They have been used in many studies with different purposes, including determining the effects that devices (e.g., navigators) and sign types might have on driver’s safety and performance (speed control, lane deviation, and acceleration).
Diving Simulator Data Validation
Some studies were conducted in the past with the goal of validating fixed-based driving simulators. In 1982, Blaauw performed a study to verify fixed-based driving simulator data by comparing it to field data obtained with the use of an instrumented car. Participants drove the simulator and the instrumented car while lane and speed deviation data were collected. By the end of the study, the author verified relative validity for lane deviation meaning that data collected in both simulator and instrumented car had the same “interactions effects of driving experience and task demands” (Blaauw, 1982), however, the driving simulator presented significantly higher values of lane deviation than those obtained in the instrumented car. Blaauw also verified absolute validity for speed deviation; that means there were no significant differences in absolute value of interaction of the speed data collected in the instrumented car and the simulator.
22 provides detailed analysis (including the nature and significance of an IVIS) and its data is validated by comparison with data collected by an instrumented vehicle in the field.
A similar study was also performed by Wang et al. (2010) to compare the data from a fixed-based driving simulator with field data. Participants were required to perform destination entry tasks using different IVIS devices while driving (at separate times) both an instrumented vehicle in the field and later the driving simulator. The results showed that measures of off-road glance frequency and total off-off-road glance duration were almost the same for both field and simulator conditions. Also, the standard deviation of speed for both apparatus was absolutely validated, meaning that there was an absence of significant impacts on driver performance due to differences between the field and simulator driving experience. Therefore, the research team recommended the use of a fixed-based driving simulator for data collection of both driver visual behavior and driving performance.
Driving Simulators on Signs Studies
Since driving simulators were validated as described above, researchers have been using them to conduct different studies with a variety of focuses such as drivers’ safety, impact of hazards on driver performance, and more. Some of those studies focused on the effect of logo sign presentation format on driver performance and logo identification accuracy rate.
23 as average speed, lane deviation, and speeding percentage data. Similarly, Kaber et al. (2015) also used the same STISIM Drive M400 to observe driver behavior under the distraction of guide and logo signs. Lane deviation and speed deviation data were collected and analyzed. In both studies, eye movement data was collected during the simulation with the use of eye tracking equipment.
Summary
The literature regarding driving simulators shows that they are a valuable tool for studying driver performance, as well as for investigating the impacts of independent variables such as signage and in-vehicle information systems (e.g. navigational aids). It may be the case that data obtained from instrumented cars might better represent driver performance under real driving conditions. However, this approach has two disadvantages. First, it is difficult to control aspects of traffic during the experiment, which can impact the results in different ways. Second, special attention must be given to participants’ safety when they drive an instrumented car under real conditions because they are subject to risks (e.g. crashing the car). As an alternative, the literature suggested that medium-fidelity driving simulators are capable of collecting valid data that is comparable with field data. In addition, driving simulators represent a safe method of studying and analyzing drivers’ performance under real driving conditions. Finally, according to Wang et al. (2010), a low-cost laboratory simulator can detect effects that IVIS might have on driver performance.
24 (such as maximum off-road glance duration and off-road fixation frequency) were collected by using eye tracking equipment in conjunction with the driving simulator.
The “References” column in Table 2.7 lists the reference of papers discussed in this section. “Response Measures” presents the type of measure that was collected in each specific research study.
Table 2.7 Summary of Papers by Kind of Response Measures Collected in Simulators
References
Response Measures Research Methods
L ane D evi a ti on or L ane C han ge Sp ee d D ev iat ion or Averag e Spe ed E yes Mo vem ent s Inst ru m en ted C ar L ow -C ost L aborat o ry Sim u lat or Me diu m -F ide li ty D ri vi n g Si m ula tor H igh -Fid el it y D ri vi n g Si m ula tor
Blaauw (1982) X X - X - X -
Kaber et al. (2015) X X X - - X -
Santos et al. (2005) X X - X X X -
Wang et al. (2010) X X X X - X -
Zhang et al. (2013) X X X - - X -
25 Table 2.8 Summary of Driving Simulator Papers by Research Methods and Findings
Reference Method Findings
Blaauw (1982)
Instrumented car and medium-fidelity
driving simulator
Driving simulator data validation:
Verified relative validity for lane deviation and absolute validity for speed deviation.
Edquist et al (2011)
High-fidelity
driving simulator Sign study – data collected: Kaber et al.
(2015)
Medium-fidelity driving simulator
Logo sign study – data collected:
Speed deviation, lane deviation, off-road fixation frequency, maximum off-road glance duration (these last two responses were collected with an eye-tracking system).
Santos et al. (2005) Instrumented car, low-cost laboratory simulator, and medium-fidelity driving simulator
Driving simulator data was validated by comparison with data collected by an instrumented vehicle in the field.
Wang et al. (2010)
Instrumented car and medium-fidelity
driving simulator
Driving simulator data validation:
Maximum off-road glance duration, off-road fixation frequency, and speed deviation data were validated.
Zhang et al. (2013)
Medium-fidelity driving simulator
Logo sign study – data collected:
26 3.0 SIGNS
This section describes the different signs used in the experiments described herein. All signs are specified according to the MUTCD (FHWA, 2009).
3.1Logo Signs
Logo Signs are large blue signs that contain business information that is important to drivers. They are divided into lodging, food, gas, attractions, and camping categories. The MUTCD (FHWA, 2009) refers to this type of sign as “Specific Service Signs.” However, because most researches on this subject use the term “Logo Sign” the current document also uses this term.
Logo signs located on Interstates and freeways contain the following information: service category (lodging, food, gas, attraction, camping, or 24-hour pharmacy), the number of the next exit, and the logos of the businesses that are located near that exit.
Figure 3.1 shows some typical logo signs configurations. The left sign indicates only one exit (44) and one service category (gas). The center sign also indicates one exit (211), however, different from the left sign, there is a combination of two categories (gas and lodging). Finally, the right sign contains only one category (gas), but two different exits (211 A and 211 B).
Figure 3.1 Examples of Six-Panels Logo Sign Located on an Interstate Single-Exit Interchange
(One service)
Single-Exit Interchange (Two service)
27 The MUTCD (FHWA, 2009) does not specify logo sign dimensions. Instead, the manual establishes (through section 2J.04) the maximum dimensions of the logos to be placed on the signs which is 60 x 36 inches (width x height). The dimensions of the logo signs used by the NCDOT can be found in the NCDOT Logo Signing Manual (NCDOT, 2006). This study adopted the dimensions specified in this manual and that are listed below.
Six-panel logo sign (one service): 15 x 10 feet (width x height). Six-panel logo sign (two service): 15 x 11.5 feet (width x height). Nine-panel logo sign (one service): 15 x 13.5 feet (width x height). Nine-panel logo sign (two service): 15 x 15 feet (width x height).
Definitions
Despite the fact that the MUTCD (FHWA, 2009) has a standard nomenclature for different types of signs, past studies have adopted different names to identify a specific type of logo or to describe a particularity sign. As a result, this section has the goal of clarifying terms and avoiding misunderstanding by defining and explaining the terms that are used in this report.
Panels are the positions of the logos (text or symbol) on a logo sign as Figure 3.2 shows. Thus, a panel is a space or location. It may be the case that not all the panels of a logo sign are filled with logos.
28 A text-based logo is a blue panel that contains the name of a business in white letters as shown in the bottom of the logo sign in Figure 3.3 (the textual logos of three different attraction businesses are shown). According to section 2J.03 of the MUTCD (FHWA, 2009), the minimum letter size for text-based logos on Interstates is 8 inches.
A symbol-based logo is a trademark, a graphic representation, or a symbol that represents a business as shown in the top row of the logo sign in Figure 3.3 (the symbol-based logo of three different gas stations are shown).
A dual-logo panel is a unique panel that contains two different logos (businesses) as shown in the top left portion of Figure 3.3. In such a case, these two businesses are co-located. However, according to the MUTCD (FHWA, 2009), dual-logo panels are not permitted since each panel shall contain only one logo.
An overflow sign is a second (extra) logo sign of one of the original categories. The MUTCD (FHWA, 2009) allows it when there are a high number of businesses in a specific interchange and their logos cannot all fit on one sign. But the total number of logo signs, including the overflow one, shall not be more than 4 signs.
29
Figure 3.2 Logo Sign and Panels
Figure 3.3 Two Service Logo Sign and Type of Logos
3.2Guide Signs
Guide Signs are green signs located along Interstates, expressways, and streets. According to the MUTCD (FHWA, 2009) these signs have the objective of providing drivers with the followings valuable information.
“Directions to destinations, or to streets or highway routes, at intersections or interchanges.
Logo Sign Panel Category
Service
Text-based Logo Symbol-based Logo
Overflow
Combination Sign
Category Service
Dual-logo Panel
Exit Number
Category
Service Exit Number
30 Advance notice of the approach to intersections or interchanges.
Direct road users into appropriate lanes in advance of diverging or merging movements.
Identify routes and directions on those routes. Show distances to destinations.
Indicate access to general motorist services, rest, scenic, and recreational areas. Provide other information of value to the road user.”
Advance Guide Sign
The advance guide signs are specified in Section 2E.33 of the MUTCD (FHWA, 2009). These are large green signs that contain information such as the exit number, the intersecting route number, the distance to the upcoming exit, and the cities that are at the next exit. Usually there are two of these signs before an interchange; the first one is located 1 mile away from the exit ramp and the second sign is 0.5 mile from the ramp as shown in Figure 3.4. The MUTCD (FHWA, 2009) does not specify the size of an advance guide sign.
31 Exit Direction Guide Sign
The exit direction guide signs are specified in Section 2E.36 of the MUTCD (FHWA, 2009). They are large green signs located just before an exit on the right shoulder of the Interstate (see Figure 3.5). Their objective is to indicate the exit ramp direction with an arrow and also the cities that are at that interchange. The MUTCD (FHWA, 2009) does not specify the size of an exit direction guide sign.
Figure 3.5 Exit Direction Guide Sign
Exit Gore Sign
32
Figure 3.6 Exit Gore Sign E5-1a
Distance Guide Sign
The distance guide sign is a green post-interchange sign described in Section 2E.39 of the MUTCD (FHWA, 2009). This type of sign provides two or three significant destinations (cities and route numbers or names of highways) followed by the distance in miles to those destinations. Figure 3.7 illustrates an example of a distance guide sign with three destinations: Burlington, Greensboro, and Winston-Salem in order of distance from the present location. According to the manual, distance signs that contain three destinations are identified as D2-3 and their size may vary depending on the length of the destination name. However, the height has a fixed dimension of 72.”
Figure 3.7 Distance Guide Sign with Three Destinations D2-3 60”
78” 96”
2-digit Exit Number 3-digit Exit Number
Varies
33 3.3Other Signs
To better represent normal Interstate conditions, five other signs were used in the scenario of the simulation:
Merge Sign Speed Limit Sign Interstate Route Sign
Merge Sign
The merge sign is a yellow diamond-shaped sign identified as W4-1 by the MUTCD and described in Section 2C.40 (FHWA, 2009). It indicates that a lane is joining the major roadway. This sign is located on the right shoulder of the major roadway and before the junction of the two lanes. The manual specifies that the sign size shall be 48” x 48” for Interstates as Figure 3.8 shows.
Figure 3.8 Merge Sign W4-1
Speed Limit Sign
The speed limit sign (see Figure 3.9), as the name suggest, indicates the speed limit on the Interstate and it is described in Section 2B.13 of the MUTCD (FHWA, 2009). These signs are placed at specific locations along the Interstate that are determined by engineering studies. A
34 speed limit sign is required to be located after interchanges where a secondary roadway joins the major one. In this case, the speed limit sign is located 1,500 feet after the end of the acceleration lane. The manual specifies that the sign size shall be 48” x 60” for Interstates.
Figure 3.9 Speed Limit Sign R2-1
Interstate Route Sign
The Interstate route sign shown in Figure 3.10 is a blue and red sign that identifies an Interstate highway. It is described in Section 2D.10 of the MUTCD (FHWA, 2009). All Interstates must have this sign in order to identify the route. Similar to the speed limit sign, an Interstate route sign is required after all interchanges and is located 500 feet after the end of the acceleration lane. The manual specifies the sign size as being 24” x 24” for Interstate route numbers with either one or two digits.
Figure 3.10 Interstate Route Sign M1-1 48”
60”
24”
35
4.0 EXPERIMENTAL APPARATUS
This study combined driving simulator and eye tracking systems to collect automobile drive performance data (lane maintenance and speed control), visual behavior data (fixation frequency to area of interest and maximum off-road glance duration), and logo target identification accuracy.
4.1Driving Simulator
A STISIM Drive Model 400 driving simulator from System Technology, Inc. (System Technology, Inc., 2013) was used in the study. It is a medium-fidelity, fixed-based simulator located in the NCSU Ergonomic Laboratory in Daniels Hall. The driving simulator represents a realistic automobile cabin that has a driver’s seat and a set of full-size driving controls, including accelerator and brake pedals, steering wheel, and turn signals. Through three 37” HDTV monitors, the simulator provides the driver with a 135-degree driving view. In addition, the simulator also contains audio speakers for roadway sounds and driver warnings. Drivers are provided with real-time feedback about speed control and lane maintenance through the use of high-resolution digital sensors and a vehicle dynamics model (Ford Taurus). The computer renders 3D dynamic images based on the scenarios designed by the experimenters and the drivers’ inputs. The simulator software allows participants to speed, brake, change lanes, and pass other cars. Also, the rear and side rear view mirrors offer drivers with realistic dynamic images representing the driving environment.
36 on the top portion of the central screen. Side rear view mirrors also can be seen on the bottom portion of the right and left screens. Figure 4.1 also shows the driver’s seat and the steering wheel.
Figure 4.1 Simulation Configuration
Figure 4.2 shows details of the steering wheel, turn signals, and speedometer. It is also possible to see in this picture the eye tracking device (cameras and red-pod) that is located behind and above the steering wheel.
Steering Wheel
Driver Seat
Rear View Mirror
37 Figure 4.2 Details of the Driving Controls
Driving simulators similar to the STISIM Drive Model 400 have been validated in past studies by comparing them to real world driving. Santos et al. (2005) conducted a study where they compared in-vehicle information system (IVIS) data obtained from three different apparatus: a low-cost laboratory simulator, a medium-fidelity simulator, and an instrumented vehicle. According to this study, while a low-cost laboratory simulator covers only basic information about the impact that an IVIS has on drivers’ performance, a medium-fidelity simulator provides more detailed analysis (including the nature and significance of an IVIS). The study’s data were validated by comparison with data collected by an instrumented vehicle in the field.
A similar study was performed by Wang et al. (2010) to compare the data from a fixed-based driving simulator with field data. Participants were required to perform destination entry tasks using different IVIS devices while driving (at separate times) both an instrumented vehicle in the field and later the driving simulator. The results showed that measures of off-road fixation frequency and total glance duration were almost the same for both field and simulator
Steering Wheel
Eye Tracking Equipment
38 performance. Also, the standard deviation of speed for both apparatus was absolutely validated, meaning that there was an absence of significant impacts due to differences between the field and simulator driving experience on driver performance. Therefore, the research team recommended the use of a fixed-based driving simulator for data collection for both driver visual behavior and driving performance.
Adjustment for Screen Resolution
Driving simulators are valuable tools for analyzing driving conditions and collecting data; however, care must be taken in order to avoid deterioration of participant performance due to differences between real world and simulator visual conditions. This means that participants must be able to detect features on a sign during a simulation at the same distance they would detect them under real world driving conditions.
Wickens et al. (2004) explained that drivers with normal vision can detect features at a distance of 20 feet with a visual angle of 1/60 of 1 degree. The finest feature of a logo sign is the exit number text (e.g., EXIT 11) whose characters are 6 by 10 inches (0.5 by 0.83 feet). The identification distance for this text was calculated using Equation 1 below. “Feature dimension” is 0.5 feet, which is the smallest dimension of the text character.
𝐼𝑑𝑒𝑛𝑡𝑖𝑓𝑖𝑐𝑎𝑡𝑖𝑜𝑛 𝐷𝑖𝑠𝑡𝑎𝑛𝑐𝑒 =𝑓𝑒𝑎𝑡𝑢𝑟𝑒 𝑑𝑖𝑚𝑒𝑛𝑠𝑖𝑜𝑛/2
tan (1⁄60°2 )
Equation (1)
𝐼𝑑𝑒𝑛𝑡𝑖𝑓𝑖𝑐𝑎𝑡𝑖𝑜𝑛 𝐷𝑖𝑠𝑡𝑎𝑛𝑐𝑒 = 0.5/2
tan (1⁄60°2 )
39 To represent real world conditions as much as possible in the driving simulator, the finest feature of the logo sign must be represented by 1 pixel of the screen when a driver is at a distance of 1,718 feet from the sign. To ensure those conditions, Hummer et at. (2011) used a factor of 1.8 to enlarge the logo signs used in the driving simulator. The same procedure was adopted by our research group. Therefore, an average six-panel logo sign in the field, which measures 10 by 15 feet, resulted in a logo sign 18 by 27 feet in the simulator. Similarly, a nine-panel logo sign which is 13.5 by 15 feet in the field was represented in the simulator by a 24.3 by 27 feet sign. To be consistent and avoid major visual differences between logo signs and other signs (e.g., guide signs, speed limit, and merge signs) in the driving simulator, all signs were enlarged by the same factor of 1.8.
4.2Eye Tracking Equipment
40 Figure 4.3 Eye Tracking System Hardware
The eye tracking system works through an infrared light that is emitted by the pod, reflected off the eyes, and captured by the cameras. The system records eye movement at 60 HZ with an accuracy of 0.5º to 1º of rotational error. Figure 4.4 shows the minimum and maximum distance between the participants’ eye positions and the screen (which are respectively 43.31 inches and 53.94 inches) to enable the tracker to know what they are looking at.
Given the distance ranges shown (43.31 to 53.94 inches) and the rotational error, the range of height for physical dimension of the tracking error at the display is calculated by the equation below. The range of height for the minimum distance (Dmin) is represented by H0.5, min and H1.0, min as Figure 4.4 shows. The range of height for the maximum distance (Dmax) is represented
by H0.5, max and H1.0, max as Figure 4.4 shows.
𝑉𝐴(𝑚𝑖𝑛𝑢𝑡𝑒𝑠) =3438 ∗ 𝐻
𝐷
Camera A Camera B
41 Where:
VA = Visual Acuity (minutes) H = height (inches)
D = distance between participant’s eyes and the screen (inches)
By replacing the minimum and maximum values of VA and D in the equation above, it was possible to calculate H0.5,min, H0.5,max, H1.0,min, and H1.0,max. The procedure to calculate the height for physical dimension of the tracking error at the screen at a distance of 43.31 inches and 0.5º of rotational error is shown below. The same equation is used to calculate the other heights shown in Figure 4.4.
𝑉𝐴𝑚𝑖𝑛= 3438 ∗ 𝐻0.5,𝑚𝑖𝑛
𝐷𝑚𝑖𝑛
0.5 ∗ 60 = 3438 ∗ 𝐻0.5,𝑚𝑖𝑛
43.31
𝐻0.5,𝑚𝑖𝑛 = 0.38 𝑖𝑛
42 Figure 4.4 Height for Physical Dimension of the Tracking Error at the Screen
Eye Works Record software (Eye Tracking, Inc, 2011) was also used in the experiment. This software receives eye movement data from the FaceLAB system and overlays gaze onto the simulation that is shown on STISIM television. In this study, only the right and center television screens had their simulation recorded because the road signs (which were an experimental manipulation) were located on the right shoulder of the simulated Interstate. Thus, they only appeared on the center and right monitors, making it unnecessary to record the left screen simulation as it was not used in the experiments.
Dmin = 43.31 in 0.5º to 1º
Dmax = 53.94 in
Screen Screen
H1.0, min = 0.76 in H0.5, min = 0.38 in
H1.0, max = 0.94 in
43 5.0 FIELD SURVEY
Two field surveys were conducted in order to collect actual NC logo sign data, such as the dimensions of the logos signs on the Interstate and the distance between the signs. Another two field surveys were conducted to determine the proportion of familiar and unfamiliar logos for three service categories (lodging, food, and gas) within NC.
5.1Sign Dimensions and Distances
Initially, two field surveys were conducted on the I-40 (west) at Exits 284 and 287. Their main purpose was to collected more information related to logos signs. Both interchanges were documented through photographs, their dimensions were measured, and the distance between them was measured, all using a surveyor wheel odometer and a 100-feet tape.
Interchange at Interstate 40 and SR 3015 at Exit 284
44 The fourth logo sign on the Interstate is an overflow combination, and its shape is a vertical rectangle with dimensions 12.0 x 14.5 feet (width x height).
45 All logo signs located at this specific interchange were documented through pictures. Figure 5.2 shows the location and direction from where these photos were taken.
Figure 5.2 Interchange of I-40 and SR 3015 at Exit 284: Locations from Where the Pictures Were Taken
Figure 5.5 Figure 5.6
Figure 5.4
46 Figure 5.3 shows the first lodging logo sign located at this interchange (shown at the bottom of Figures 5.1 and 5.2). There are six logos, which is the maximum number per sign. Also, all lodging business presented on this sign are familiar (chain) to most drivers.
Figure 5.3 Lodging Logo Sign 1 on I-40 at Exit 284
Figure 5.4 shows the second lodging logo sign. There are six lodging logos showing 100% familiar businesses.
47 Figure 5.5 shows the third sign which is a food logo, also with six logos of which five are familiar (chain) and only one is unfamiliar (Carmen’s Cuban Café).
Figure 5.5 Food Logo Sign on I-40 at Exit 284
48 Figure 5.6 Vertical Gas and Food Logo Sign (Overflow Combination) on I-40 at Exit
284
Interchange at Interstate 40 and SR 1652 at Exit 287
On October 25th, 2014, a field survey was conducted at the intersection of I-40 and SR 1652 (Harrison Avenue) at Exit 287. The objective was to measure distances between the logo signs (lodging, food and gas) as well as the sign sizes. Figure 5.7 shows the results of this field survey measurements.
49 Figure 5.7 Sign Sizes and Distances Between Signs on I-40 and SR 1652 at Exit 287
50 Figure 5.8 Interchange of I-40 and SR 1652 at Exit 287: Locations from Where the
Pictures Were Taken
Figure 5.9 shows a lodging logo sign at this interchange (shown at the bottom of Figures 5.7 and 5.8). There are six panels (logos positions), of which only four have logos on them. From the four lodging logos, only one is unfamiliar, which is the Umstead Hotel & Spa.
Figure 5.11
Figure 5.10