Including Blind Students in Computer Science
Through Access to Graphs
Suzanne Balik, Sean Mealin, Matthias Stallmann, Robert Rodman,
Michelle Glatz, and Veronica Sigler
ABSTRACT
We created the Graph SKetching tool, GSK, to provide blind and sighted people with a means to create, examine, and share graphs (node-link diagrams) in real-time. GSK proved very effective for one blind computer science student in courses that involved graphs and graph structures such as automata, decision trees, and resource-allocation diagrams. In order to determine how well GSK works for other blind people, we carried out a user study involving nine blind participants. We report on the results of that study, which demonstrates the efficacy of GSK for the examination, navigation, and creation of graphs by blind users. Based on the study results, we improved the efficiency of GSK for blind users by simplifying edge navigation, and adding an advanced verbosity level and edge filtering. Our next step is to measure and increase the appeal of GSK for sighted students with the overall goal of providing a useful tool that enhances the ability of all students to learn and collaborate with respect to graphs.
Categories and Subject Descriptors
H.5.2 [Information Interfaces and Presentation]: User Interfaces; K.4.2 [Computers and Society]: Social Issues –
assistive technologies for persons with disabilities; K.3.2 [Computers and Education]: Computer and Information Science Education; G.2.2 [Discrete Mathematics]: Graph Theory .
General Terms
Human Factors.
Keywords
GSK, Universal Design, Accessibility.
1.
INTRODUCTION
Combinatorial graphs, often conveyed as node-link diagrams, are very important in the study of computer science and other STEM disciplines. To be successful in these disciplines, it is important that blind students and professionals be able to create and access graphs and share them with sighted colleagues. Others have created graph applications specifically for blind people that are
unlikely to be used by sighted people [2, 3, 4, 6, 7, 8]. We created the Graph SKetching tool, GSK, to adhere to universal design principles by including both blind and sighted users in the same interface [1]. GSK has the advantage of not requiring specialized hardware devices, thus allowing users to employ interaction mechanisms (keyboard, mouse, monitor, screen reader) that are standard for them.
The second author, who is a blind computer science student, used GSK quite successfully in his automata theory, operating systems, software engineering, and artificial intelligence courses. It is not surprising that, as a co-creator of GSK, he found the tool intuitive and useful. We wanted to determine how well GSK would work for other blind students and recent graduates. We therefore carried out a user study in which blind participants used GSK and Microsoft Excel, as a control, to examine and navigate graphs. They also used GSK to create several graphs. This paper provides details of the study, its participants and results, as well as improvements made to GSK that increase its efficiency for blind users. GSK is available for download at
2.
USER STUDY
The user study, which spanned five hours and included lunch, consisted of three individual studies, each of which took about an hour. In the first two studies, participants examined and navigated
graphs using GSK and Microsoft Excel. We chose Excel as a control because it is a standard means of representing tabular data that is in common use by both blind and sighted people. In the third study, participants used GSK to create graphs.
We conducted the user study on a Windows computer running the Vista Operating System. Participants used the keyboard and version 10.0 of the JAWS screen reader to interact with GSK and Microsoft Excel 2007. Because GSK is a Java application using Swing components, we installed the Java Access Bridge, which facilitates communication between the screen reader and the Java Virtual Machine. Our use of Java 6 (6u21) necessitated this installation. The Java Access Bridge is now included with Java 7 Update 6 (7u6) and later and may be enabled via the Windows Ease of Access Center.
2.1
Participants
Table 1. Participant Characteristics
Participant JAWS Rate
Excel Use
Graph Familiarity 1 (Low) – 5 (High)
P1/P1R 125 5-10 yrs 4
P2 115 2-3 yrs 1
P3 123 > 10 yrs 5
P4 80 5-10 yrs 5
P5 29 2-3 yrs 2
P6 113 3-5 yrs 4
P7 73 2-3 yrs 1
P8 74 < 1yr 3
P9 131 3-5 yrs 5
relatively low representation in the general population [5]. However, though our sample was small, the first eight study participants demonstrated the effectiveness of GSK for completing a number of graph-related tasks. They also provided us with enough information to make improvements that allowed the ninth and repeating participant to use GSK more efficiently. Each person received an honorarium for participating in the study.
In order to maintain confidentiality with such a small group, we provide most information about the participants in aggregate form and provide individual information that may have an impact on the study results in Table 1. The participants (4 male, 5 female) ranged in age from 14 to 30 and consisted of 3 secondary students, 3 undergraduate students, 2 college graduates, and 1 graduate student. All but two participants had been legally blind since birth; the other two became blind before the age of 5. Seven participants were Caucasian and two were African American. All were experienced computer users and most were experienced JAWS users. Some participants used a very fast JAWS speech rate, which is unintelligible to most people, while others used a much slower rate.
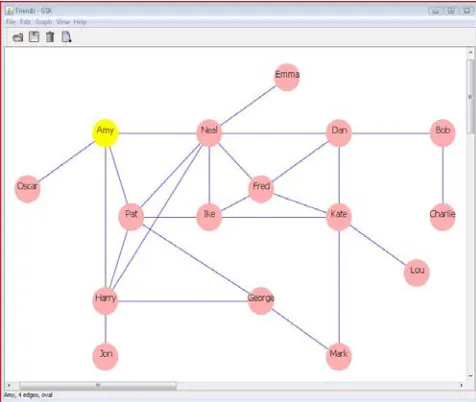
Figure 1. GSK Friends Graph
2.2
Graph Examination Study
We used a friends graph for the graph examination study. The Friends graph was based on the Acquaintance graph in an undergraduate discrete mathematics textbook [9]. Each node in the Friends graph represents a person with undirected edges joining people who are friends. We found that all participants, regardless of their background and degree of familiarity with graphs, could relate to this simple example. A friends graph rendered using GSK is shown in Figure 1. The same graph represented as an Excel table is shown in Figure 2. Each row of the Excel table contains a person’s name followed by the person’s number of friends followed by the names of the friends.
We created six versions of the Friends graph with different edges, each of which contained 16 nodes and 25 edges. All graphs used the same set of person names for the nodes, one for each letter of the alphabet – Amy, Bob, Charlie, ..., Pat. We randomly assigned node names to each GSK graph. We then created a random pairing of those names that we used to label the nodes in the corresponding Excel graph. We configured the Excel tables so that the JAWS screen reader would read the row (person’s) name when navigating from cell to cell and turned off the reading of cell coordinates, e.g., A1, to eliminate confusion.
The participants were first trained to use GSK and Excel to examine a friends graph and given time to practice answering each of the four types of questions listed below. The questions correspond to graph theory concepts without being explicit. Each participant was asked one question of each of the four types for each of the six graphs using both GSK and Excel for a total of 48 trials. For each question/graph pair, we were careful to use corresponding GSK/Excel nodes. The participant response times and answers for each trial were recorded. Examples of each question type are given below.
Q1: How many friends does Amy have? (Node degree)
Q2: Is Bob a friend of Dan? (Adjacent node)
Q3: Who is a friend of both Charlie and Dan? (Path of length 2)
Q4: Name two friends of Kate who are also friends with each other. (Clique of size 3)
Figure 3. GSK Town Graph
2.3
Graph Navigation Study
For the graph navigation study, we used a town graph in which places are connected by one-way roads (labeled directed edges). Again, this simple example was understandable by all participants. Figures 3 and 4 contain town graphs rendered in GSK and Excel respectively. Each row of the Excel table contains the name of a place followed by the number of roads leaving the place followed by each road and its destination, e.g., “Oak to Library.”
We created six versions of the Town graph with different edges, each of which contained 12 nodes and 24 edges. All graphs used the same places and set of road names, one for each letter of the alphabet – Apple, Birch, Cherry, ..., X-ray. We randomly assigned node names to each GSK graph. We then created a random pairing of those names that we used to label the nodes in the corresponding Excel graph. We configured the Excel tables so that the JAWS screen reader would read the row (place) name when navigating from cell to cell and turned off the reading of cell coordinates.
Participants were first trained to use GSK and Excel to navigate a town graph and given time to practice answering the navigation question listed below. Each participant was asked one question for each of the six graphs using both GSK and Excel for a total of 12 trials. Their response times and answers for each trial were recorded. An example of a navigation question is given below.
N: Starting at the Park, take Birch, King, Pine. Where do you end up?
2.4
Graph Creation Study
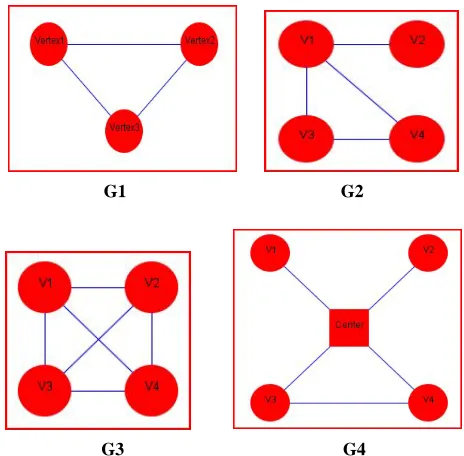
During the graph creation study, participants were taught to use GSK to create undirected graphs. They then created the four graphs listed below. The first two were presented to them in tactile form and the last two were described for them. The time taken to create each graph was recorded. The graphs as rendered by participant P1 are shown in Figure 5.
G1: Graph with 3 nodes and 3 edges laid out as an equilateral triangle.
G2: Graph with 4 nodes and 4 edges laid out as a square with one diagonal and a missing side.
G3: Graph with 4 nodes that are all connected to each other.
G4: Graph with 5 nodes and 5 edges.
Figure 4. Excel Town Graph
3.
ANALYSIS AND RESULTS
3.1
Examination and Navigation Studies
All participants were able to use Excel and GSK to answer the examination and navigation questions in a timely and accurate manner. The mean response time ranged from 2 to 17 seconds for the relatively straightforward questions, Q1 and Q2, and from 10 to 55 seconds for the much more difficult questions, Q3 and Q4. The mean response times for the navigation question, N, fell between these two ranges with times ranging from 7 to 33 seconds. The overall accuracy rate was very high (99% using GSK, 97% with Excel). When calculating the mean response times, we omitted the response time for any question answered incorrectly from both the Excel and GSK calculations. Comparisons of the participant response times using Excel and GSK for the examination and navigation questions are provided as bar charts in Figures 6 - 10.
G1 G2
G3 G4
Figure 6. Examination Study Q1
Figure 7. Examination Study Q2
Figure 8. Examination Study Q3
Figure 9. Examination Study Q4
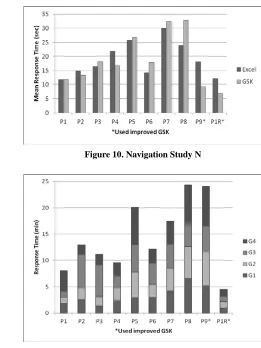
Figure 10. Navigation Study N
Figure 11. Creation Study
3.2
Creation Study
The participants were also successful in creating graphs using GSK. As described in our previous paper, GSK provides users with two views, Connection View and Grid View [1]. Connection View, as shown in Figures 1 and 3, conveys a graph as a node-link diagram. Grid View allows blind (and other) users to spatially lay out the nodes of a graph relative to each other.
Participant P1, who had had no prior GSK experience, rendered all four creation study graphs perfectly, as shown in Figure 5, in less than 10 minutes. Figure 11 provides the response times for all study participants, who created the graphs in total times ranging from 5 to 25 minutes. To quantify the quality of the graphs, we awarded 1 point for each of the following items for each graph for a total of 5 points per graph:
•
Correct number of nodes•
Correct number of edges•
Correct edges•
Correct layout•
Visual accessibilityTable 2. Creation Study Scores
Participant G1 G2 G3 G4 Mean
P1 5 5 5 5 5.00
P2 4 5 5 5 4.75
P3 4 4 3 4 3.75
P4 5 5 5 5 5.00
P5 4 3 5 5 4.25
P6 5 5 5 5 5.00
P7 2 3 5 0 2.50
P8 2 3 4 5 3.50
P9 5 5 3 4 4.25
P1R 4 4 3 3 3.50
3.3
GSK vs. Excel
We had planned to do ten user studies, but after the first eight studies, the trends in terms of efficiency were clear. At that point we decided to analyze the data and attempt to improve the efficiency of GSK for the remaining two participants.
As appropriate for our within-subject design, we first calculated the difference between the Excel and GSK mean response times for each question for each of the first eight participants. We then analyzed the results using the Wilcoxon Signed-Rank Test rather than a paired t-test due to the non-normality of the differences. We found no significant difference between the mean response times for Excel and GSK for Q1 and N. However, we found that the response times for Excel were significantly lower for Q2 (p = .005), Q3 (p = .005), and Q4 (p = .001).
These results are not surprising considering that most participants had had several years experience using Excel and only a few hours experience using GSK by the end of the navigation study. Also, navigating the Excel tables required only the use of the arrow keys, which are located in close proximity on the keyboard. On the other hand using GSK required the use of letter keys, the escape key, and key combinations in addition to the arrow keys. A number of participants remarked that the studies gave an advantage to Excel for two reasons. First, in the Excel Friends graph, the alphabetical listing of people, one for each letter of the alphabet, made it very easy to take shortcuts when navigating the table. Second, in the Excel Town graph, only the outgoing edges for each place were listed, whereas navigating the GSK Town graph required examining both incoming and outgoing edges.
3.4
GSK Improvements
To make GSK more efficient for blind users, we added an
advanced verbosity level and edge filtering, and simplified the edge navigation as described in the following subsections. The ninth participant used the improved version of GSK and the first participant repeated the study using the improved GSK. As shown in Figures 6 – 10 and Table 3, there was a marked improvement in their GSK response times as compared to Excel. In particular, the addition of edge filtering allowed these last two participants to answer the navigation question with GSK in a little over half the time than it took with Excel. We attribute the decrease in quality of the graphs created by P1R using the improved GSK, as shown in Table 2, to focusing on speed rather than attention to detail.
Table 3. Mean Response Time (sec)
Question Original GSK (P1-P8) Improved GSK (P9-P1R)
Excel GSK Diff Excel GSK Diff
Q1 4.28 4.32 -0.04 3.25 3.05 0.20
Q2 5.26 10.32 -5.06 6.60 7.00 -0.40
Q3 16.81 26.42 -9.61 12.20 12.35 -0.15
Q4 24.60 39.79 -15.19 17.10 21.70 -4.60
N 19.84 21.24 -1.4 15.10 8.15 6.95
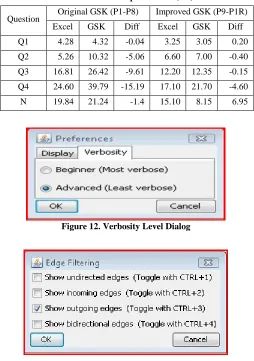
Figure 12. Verbosity Level Dialog
Figure 13. Edge Filtering Dialog
3.4.1
Beginner and Advanced Verbosity Levels
Unlike Excel, the auditory cues heard by the participants when using GSK to examine nodes and edges were quite verbose and often the most important information came last. For example, the auditory cues for a friends graph node and a town graph edge are “oval Amy, 4 edges” and “Outgoing edge Pine to oval Mall.” As recommended by Stefik, et al., good auditory cues are short, “browsable,” and provide the most important information first [10]. We therefore decided to provide users with Beginner and Advanced Verbosity levels as shown in Figure 12. The Beginner level provides the more verbose auditory cues as described above. Using the Advanced level, the same cues are rendered as “Amy, 4 edges, oval” and “Pine, Mall, Outgoing, oval,” thus allowing blind users to more quickly access the necessary information.
3.4.2
Edge Filtering
3.4.3
Simplified Edge Navigation
In the original GSK interface, the left arrow key placed focus on the selected node’s “first” edge and the right arrow key was then used to navigate to its other edges. Likewise, the right arrow key placed focus on a node’s “last” edge and the left arrow key was used to navigate to the other edges. We realized that this “context switch” was inefficient and simplified the navigation scheme by eliminating it. In the improved GSK, whenever focus is on a node, subsequent presses of the left arrow key moves focus from edge to edge as does the right arrow key, but in the opposite direction.
4.
CONCLUSIONS AND FUTURE WORK
Through our user study, we found that GSK was effective in allowing blind users to examine, navigate, and create graphs in a reasonable amount of time. In the first two studies, we controlled for memory by having participants use a different graph for each question. In normal situations, blind users would typically work with the same graph and be able to build up a mental model of the graph. The second author has found that using GSK helps him to more easily memorize which nodes are adjacent to one another and this would likely extend to other blind users as well. We believe GSK has the potential to be very helpful to blind students and others, especially those involved in Computer Science and other STEM disciplines. In the words of the user study participants:
GSK has an advantage over Excel in that it is good for showing connections, especially involving towns, buildings, walls and infrastructures. I like how I can follow a path from one place to another and keep following the path.
I started to take an easy gen ed math course and switched to a different course because most of the course centered around graph theory. If I had stayed in that course, this program (GSK) would have helped me.
It’s easier to edit your work (using GSK) than using a raised line drawing kit and make revisions or minor changes. You can save your work and make multiple copies for classmates and professors.
I can now make graphs that are attractive and presentable.
It makes me a lot more hopeful about producing combinatorial graphs in a visually appealing manner.
Using GSK to represent and work with graphs has advantages over Excel in that it is easier to connect things, if you are a visual learner. GSK is more fun, like “connect the dots,” while Excel is just a list.
Our next step is to investigate the appeal of GSK for sighted users and make necessary improvements. We are also concerned about providing options that help blind users create graphs that are visually viewable and appealing. We especially hope GSK will serve as a useful tool for both blind and sighted users and one that allows them to collaborate more easily.
5.
ACKNOWLEDGMENTS
We would like to thank Dr. Richard Ladner for the AccessComputing mini-grant that supported this work via NSF Award #CNS-1042260.
6.
REFERENCES
[1] Balik, S.P., Mealin, S.P., Stallmann, M. F. and Rodman, R.D. 2013. GSK: universally accessible graph sketching. In
Proceeding of the 44th ACM technical symposium on Computer science education (SIGCSE '13). ACM, New York, NY, USA, 221-226. DOI=10.1145/2445196.2445266
[2] Blenkhorn, P. and Evans, D. G. 1998. Using speech and touch to enable blind people to access schematic diagrams. J. Netw. Comput. Appl. 21, 1 (January 1998), 17-29.
DOI=10.1006/jnca.1998.0060
[3] Brown, A., Pettifer, S. and Stevens, R. 2003. Evaluation of a non-visual molecule browser. In Proceedings of the 6th international ACM SIGACCESS conference on Computers and accessibility (Assets '04). ACM, New York, NY, USA, 40-47. DOI=10.1145/1028630.1028639
[4] Calder, M., Cohen, R. F., Lanzoni, J. and Xu, Y. 2006. PLUMB: an interface for users who are blind to display, create, and modify graphs. In Proceedings of the 8th international ACM SIGACCESS conference on Computers and accessibility (Assets '06). ACM, New York, NY, USA, 263-264. DOI=10.1145/1168987.1169046
[5] Jay, C., Lunn, D. and Michailidou, E. (2008). End user evaluations. In Simon Harper and Yeliz Yesilada, editors,
Web accessibility: a foundation for research. Springer, London, UK, 107-126.
[6] Kennel, A. R. 1996. Audiograf: a diagram-reader for the blind. In Proceedings of the second annual ACM conference on Assistive technologies (Assets '96). ACM, New York, NY, USA, 51-56. DOI=10.1145/228347.228357
[7] King, A., Blenkhorn, P., Crombie, D., Dijkstra, S., Evans, D.G., and Wood, J. Presenting UML Software Engineering Diagrams to Blind People. In Proceedings of ICCHP. 2004, 522-529.
[8] Miller, D. 2009. Can we work together? Ph.D. Thesis, University of North Carolina at Chapel Hill, Chapel Hill, North Carolina. Retrieved November 9, 2012 from
[9] Rosen, K.H. (2002). Discrete mathematics and its applications, 5th edition. McGraw-Hill Higher Education, New York, N.Y, USA, 541.
[10] Stefik, A.M., Hundhausen, C. and Smith, D.. 2011. On the design of an educational infrastructure for the blind and visually impaired in computer science. In Proceedings of the 42nd ACM technical symposium on Computer science education (SIGCSE '11). ACM, New York, NY, USA, 571-576. DOI=10.1145/1953163.1953323