MULTIPARENTAL POPULATIONS
RNA-Seq Alignment to Individualized Genomes
Improves Transcript Abundance Estimates in
Multiparent Populations
Steven C. Munger,* Narayanan Raghupathy,* Kwangbom Choi,* Allen K. Simons,* Daniel M. Gatti,* Douglas A. Hinerfeld,* Karen L. Svenson,* Mark P. Keller,†Alan D. Attie,†Matthew A. Hibbs,*,‡ Joel H. Graber,* Elissa J. Chesler,* and Gary A. Churchill*,1
*The Jackson Laboratory, Bar Harbor, Maine 04609,†University of Wisconsin, Madison, Wisconsin 53705, and‡Trinity University,
San Antonio, Texas 78212 ORCID ID: 0000-0002-8458-1871 (S.C.M.)
ABSTRACTMassively parallel RNA sequencing (RNA-seq) has yielded a wealth of new insights into transcriptional regulation. Afirst step in the analysis of RNA-seq data is the alignment of short sequence reads to a common reference genome or transcriptome. Genetic variants that distinguish individual genomes from the reference sequence can cause reads to be misaligned, resulting in biased estimates of transcript abundance. Fine-tuning of read alignment algorithms does not correct this problem. We have developed Seqnature software to construct individualized diploid genomes and transcriptomes for multiparent populations and have implemented a complete analysis pipeline that incorporates other existing software tools. We demonstrate in simulated and real data sets that alignment to individualized transcriptomes increases read mapping accuracy, improves estimation of transcript abundance, and enables the direct estimation of allele-specific expression. Moreover, when applied to expression QTL mapping wefind that our individualized alignment strategy corrects false-positive linkage signals and unmasks hidden associations. We recommend the use of individualized diploid genomes over reference sequence alignment for all applications of high-throughput sequencing technology in genetically diverse populations.
R
NA sequencing (RNA-seq) has transformed our under-standing of gene expression and transcriptional regula-tion (Listeret al.2008; Mortazaviet al.2008; Nagalakshmiet al. 2008; Wang et al. 2009). Alignment of short read sequences (reads) is a critical first step in the analysis of an RNA-seq experiment. The most widely used alignment strategies rely on a reference genome, a single haploid sequence that serves as the representative for a genetically diverse species. For example, the mouse reference genome is derived from the C57BL/6J inbred strain (Mouse Ge-nome Sequencing Consortium 2002). Polymorphisms in in-dividual RNA samples will generate reads that differ from the reference genome. These differences are indistinguish-able from sequencing errors in the read-alignment step
where alignment algorithms allow for mismatches and small insertions or deletions (indels). Polymorphisms can be distinguished from sequencing errors inpost hoc analy-sis of the multiple-read alignments (McKennaet al.2010) when the read alignments are assumed to be correct. How-ever, polymorphisms have a demonstrated potential to cre-ate systematic errors in alignment that can affect many reads and lead to biases in the quantification of transcript abundance (Degner et al. 2009). Known variants can be masked or substituted in the reference genome (Satya
et al. 2012) but this strategy discards important informa-tion that can aid correct read alignment.
The target of read alignment can be a whole genome or only the transcribed portion of the genome (transcriptome). Whole-genome alignment must allow for reads that span splice junctions; specialized alignment algorithms have been developed to address this problem (Li and Durbin 2009; Trapnellet al.2009, 2010; Wu and Nacu 2010). Transcriptome alignment substantially reduces target complexity by limiting it to known transcripts, including all possible splice isoforms (Li and Dewey 2011).
Copyright © 2014 by the Genetics Society of America doi: 10.1534/genetics.114.165886
Manuscript received May 5, 2014; accepted for publication June 4, 2014 Available freely online through the author-supported open access option.
Supporting information is available online athttp://www.genetics.org/lookup/suppl/ doi:10.1534/genetics.114.165886/-/DC1.
The genomes of most organisms include gene families and transcribed pseudogenes with varying degrees of sequence similarity. As a result, it is not always possible to obtain a single unique alignment for a given read. Genomic regions consisting of common or repeat sequences that prevent unique read alignment are said to have low mappability (Derrien et al.
2012; Grazeet al.2012; Stevensonet al.2013). We refer to reads that align to multiple such locations in the genome as
genomic multireads. Transcriptomes include multiple isoforms with shared exons. Thus reads that align uniquely in the genomic sequence can be shared by two or more isoforms. We refer to these as isoform multireads. When the alignment target is diploid, consisting of two copies of a genome or transcriptome, reads may align equally well to both copies. We refer to these as allelic multireads. A given read may belong to one or more of these classes of multireads simulta-neously. However, it is assumed that each read is derived uniquely from one gene, isoform, and allele. Appropriate meth-ods for resolving the probable origin of multireads are key to obtaining accurate transcript abundance estimates (Mortazavi
et al.2008). Restricting attention to only uniquely mapping reads is problematic, as we illustrate below.
Quantification of transcript abundance is based on parti-tioning of the target genome or transcriptome into discrete units, which may be genes, isoforms, exons, or allelic copies of any of these. The posterior probability that a read originated from one of the loci to which it aligns can be computed using an expectation-maximization (EM) algorithm (Liet al.2010; Nicolaeet al.2011; Roberts and Pachter 2013; Patroet al.
2014). The probabilities serve as weights that sum to one for each read and relative abundance is estimated as the sum of weights for all reads that align to that locus. In this way, a read may be aligned to more than one locus but the total weight contributed by the read is one. In this work we align reads to the transcriptome at the isoform level and we summarize transcript abundance at the gene level. Alignment to the transcriptome allows us to capture junction-spanning reads and to apply appropriate length adjustments. However, wefind that the precision with which we can estimate isoform proportions is low with current sequencing technologies and therefor focus on estimates of gene-level abundance. Gene-level abundance is computed as the sum of the estimated transcript counts across all isoforms of the gene.
In outbred populations, heterozygous sites are informative for allele-specific expression. Current approaches to analysis of allele-specific expression from RNA-seq construct two haploid genome sequences corresponding to the two parents (McManus et al.2010; Rivas-Astroza et al.2011; Rozowsky
et al. 2011; Graze et al. 2012; Shen et al. 2013). Reads are aligned sequentially to the haploid maternal and paternal genomes and reads that map uniquely to one parent are used to estimate allelic imbalance. Bayesian hierarchical models can be used to test allelic imbalance across multiple SNPs within a gene (Skellyet al.2011). These methods discard allelic mul-tireads that map to both parents and fail to account for reads that are simultaneously genomic and allelic multireads.
Including all reads by allocating the allelic multireads using an EM algorithm improves the accuracy of allele-specific expres-sion (Turroet al.2011). We adopt a similar approach here.
The focus of this work is to evaluate the impact of individualized genomes on transcript quantification. Toward this end we have made what we regard to be a reasonable choice in the methods used to quantify aligned reads. We evaluate the impact of alignment to individualized diploid genomes on RNA-seq analysis with an emphasis on exper-imental multiparent populations. We have developed the Seqnature software to construct individualized genomes and transcriptomes for inbred strains and multiparent populations, including the Diversity Outbred (DO)—a multiparent popula-tion derived from eight inbred mouse strains (Churchill et al.
2012; Svenson et al. 2012). Seqnature performs two main functions. For inbred strains, Seqnature incorporates SNPs and small indels (,100 bp) into a reference genome to create a strain-specific genome sequence. For multiparent popula-tions, Seqnature uses inferred founder haplotypes to construct a pair of individualized haploid genome sequences incor-porating known SNPs and indels from the founder strains. The software merges these two sequences to produce an individualized diploid genome. Seqnature also modifies gene annotationfiles to account for coordinate offsets from indels and constructs a diploid transcriptome file in a format suitable for RNA-seq read alignment.
We incorporate Seqnature into an RNA-seq analysis pipe-line that uses existing software for read alignment [Bowtie (Langmeadet al.2009)] and quantification [RSEM (Li and
Dewey 2011)]. Other software tools can be substituted into this pipeline. We demonstrate, using real and simulated data, that individualized transcriptomes improve the accu-racy of read alignment and quantification. The Seqnature pipeline provides direct estimates of allele-specific expres-sion for genes with heterozygosity. We demonstrate that in expression quantitative trait locus (eQTL) mapping, read alignment to individualized transcriptomes reduces the number of spurious linkages and unmasks extensive local genetic variation affecting gene expression.
Materials and Methods
Animals
All procedures on DO mice were approved by the Animal Care and Use Committee at JAX.
Breeder pairs of each of the eight DO founder strains were obtained from JAX, housed at the University of Wisconsin (Madison, WI), and used to generate male pups that were utilized for our study. To supplement this breeding, male mice for CAST/EiJ and NZO/HlLtJ were obtained from JAX at 3 weeks of age. Beginning at 4 weeks of age and maintained throughout the study, mice were given free access to either a semipurified control diet containing 16.8% kcal from fat (TD.08810) or a high-fat, high-sucrose diet containing 44.6% kcal from fat and 34% (by weight) sucrose (TD.08811). With the exception of NZO/HlLtJ (NZO) mice, animals were killed at 26 weeks of age, and liver samples were collected, snap frozen, and shipped on dry ice to JAX for RNA-seq analysis. Due to a high level of lethality of NZO mice that were maintained on the high-fat/high-sucrose diet, all NZO mice were killed at 20 weeks of age. All animal procedures were approved by the Animal Care and Use Committee at the University of Wisconsin.
RNA sequencing
Total RNA was isolated from livers of 26-week-old mice and quantitated by single-end RNA sequencing. Male mice from the DO founder strains (n= 128 total, eight biological repli-cates for each strain:diet group) and both male and female DO mice (n= 277) were profiled. Total liver RNA was isolated
using the Trizol Plus RNA extraction kit (Life Technologies) with on-column DNase digestion, and then messenger RNA (mRNA) was purified from total RNA, using biotin-tagged poly(dT) oligonucleotides and streptavidin beads. The mRNA was then fragmented and double-stranded cDNA was generated by random hexamer priming. Indexed mRNA-seq libraries were generated from 1 mg total RNA following the Illumina TruSeq standard unstranded protocol and then checked for quality and quantitated with the Agilent Bioanalyzer and the Kapa Biosystems qPCR library quantitation method. Finally, 100-bp single-end reads were generated on the Illumina HiSeq 2000. To minimize technical variation, samples were randomly assigned to lanes, barcoded, and multiplexed at 12–243per lane, and two to four technical replicates for each DO sample were sequenced. Base calls were performed using CASAVA v1.8.0, and fragmented fastqfiles were concat-enated and thenfiltered to remove low-quality reads, using the Illumina CASAVA-1.8 Fastq Filter.
Construction of individualized genomes and transcriptomes
High-confidence SNPs and indels of ,100 bases from the DO founder strains were obtained from the Sanger Mouse Genomes website [(Keane et al. 2011) Release 20111102, ftp://ftp-mouse.sanger.ac.uk].“High-confidence”SNPs were defined by Sanger’s criterion and denoted in the variantfile by an above-threshold genotype (ATG) value = 1. There are additional variants in these genomes that will not be captured but the individualized genomes represent a good approximation
to the actual genomes of these strains. SNPs and indels were incorporated into the reference mouse genome sequence (NCBIM37) to construct a strain-specific genome in fasta for-mat. Genome coordinates in the gene annotationfile (Ensembl version 67) were adjusted to reflect indels in each strain. The individualized genome and gene annotationfiles were used to construct strain-specific transcriptomes containing all annotated gene isoforms with SNPs and indels incorporated.
Genomic DNA was extracted from each DO mouse and genotyped at 7664 SNPs on the Mouse Universal Genotyping Array (“MUGA”, GeneSeek) (Welsh and McMillan 2012). Founder haplotypes were inferred from SNP probe intensi-ties, using a hidden Markov model in the DOQTL R package (Broman et al. 2012; Gatti et al. 2014). At each SNP, the genotype with the highest posterior probability was recorded, and genotype state transitions were inferred at the physical midpoint between adjacent markers with differing geno-types. Individual chromosomes were phased to construct hap-lotypes by minimizing the number of recombination events consistent with the observed genotypes. Accurate long-range phasing is not critical for our purposes. For each DO sample, this process yields two genotype transition files [designated left (“L”) and right (“R”)] from which a pair of homologs is reconstructed. Chromosomal coordinates are mapped back to the reference genome (NCBIM37) to obtain annotation specific to each homolog. A diploid transcriptome is constructed with two copies of each transcript, one for each homolog.
Seqnature uses the genotype transitionfiles and founder strain variant call data to construct individualized genomes and gene annotation files. Seqnature scans through the variant call format (VCF) files, and at each position with a known SNP or indel, if the sample haplotype matches the founder strains with the variant, the variant is added to the individualized genome. For each sample two haploid genomes are produced and merged into one diploid genome file with chromosomes designated as L or R [e.g., chromosome (Chr) 1L, Chr 1R]. Offset tracking data are used to update the coor-dinates of features in the gene annotationfile (Ensembl v67), and the two annotation files are merged. The pair of records for each feature in the mergedfile is annotated to the L or R chromosomes and an additional annotation indicates the founder strain origin (A–H) of each feature. Features that span inferred recombination boundaries are labeled with both founders. One copy of the reference mitochondrial genome and any unassigned contig sequences are added to the merged genome sequence. One copy of the reference Y chromosome sequence is added to male samples.
Simulation of CAST and Diversity Outbred RNA-seq reads
34.96 quality). For paired-end reads, we set the average fragment size at 280 with a standard deviation of 50, consis-tent with the fragment size distribution we observe in real Illumina RNA-seq data from current enzymatic fragmentation methods. Isoform abundance estimates derived from C57BL/ 6J liver RNA-seq data (aligned to the NCBIM37 reference) provide transcript abundance values for the FLUX parameter files. We simulated isoform abundance estimates for both alleles independently in the DO sample. We defined ground truth to be the realized abundance values obtained for the simulated RNA-seq reads. These will deviate somewhat from the input values due to simulated variation in the Flux library preparation and sequencing steps. The complete Flux param-eter specifications are listed inSupporting Information,File S1. For the eQTL simulations, we simulated 30 million 100-bp single-end reads from 277 DO genomes, using the rsem-simulate-reads command in RSEM [v1.2.8 (Li and Dewey 2011)]. We derived modelfiles from abundance estimations on real DO samples (see the rsem-calculate-expression com-mand and parameters described below) and used these values as initial input parameters for simulation. We set the fraction of reads that do not derive from any known transcript at the mean value of the proportion of unaligned reads observed in the real data (u0= 0.018).
Alignment of simulated and real RNA-seq reads to individualized transcriptomes
We used individualized transcriptomes to construct Bowtie-compatible indexes with the RSEM software (version 1.2.1) (Li and Dewey 2011). For inbred genomes (CAST and NCBIM37), each Ensembl transcript identifier (e.g., ENSMUST00000000001) corresponds to a single sequence. For diploid genomes, each transcript identifier corresponds to two allelic sequences that are further differentiated with the L/R chromosome des-ignation and their A–H founder strain designation (e.g., ENSMUST00000000001FL and ENSMUST00000000001HR). The Bowtie aligner (version 0.12.8) (Langmead et al. 2009) aligns single-end reads, allowing up to three mismatches (-v 3), and only the best“strata”of alignments are reported. For a given read, the best stratum consists of the alignment(s) with the fewest mismatches. For paired-end reads, we set the maximum fragment size at 1000 (-X 1000) and used the -y option to maximize Bowtie’s sensitivity tofind paired alignments.
Estimation of transcript abundance from read alignments
We obtained isoform- and gene-level abundance estimates with RSEM (version 1.2.1) (Li and Dewey 2011). RSEM exe-cutes an EM algorithm to compute a proportionate allocation of the reads with multiple alignments. RSEM estimates iso-form-level abundance; gene-level abundance is calculated as the sum of the corresponding isoform counts. For diploid DO individuals, two allele-level abundance estimates are output for both isoforms and genes, and sample-level estimates are computed as the sum of alleles.
eQTL mapping
We obtained RNA-seq data from liver samples of 277 male and female DO mice fed a high-fat or standard chow diet. We mapped expression QTL, using gene-level counts estimated from alignment of reads to the reference NCBIM37 tran-scriptome and again using counts estimated from align-ment to individualized transcriptomes. We applied the same processing and analysis steps to both sets of alignments. We included only genes with nonzero count values in$85% ($233) of the DO samples in the eQTL analysis (17,125 genes from alignment to the NCBIM37 reference, 16,985 genes from alignment to individualized transcriptomes, and 16,924 genes in the common set). Raw counts in each sample were normal-ized to the upper quartile value and transformed to normal scores. We mapped expression QTL with DOQTL (Gattiet al.
2014), using a linear mixed model with sex, diet, sex by diet, and batch as additive covariates and a random polygenic term to account for genetic relatedness (Chenget al.2011).
We established significance thresholds by performing 100,000 permutations and fitting an extreme value distribu-tion to the maximum logarithm of the odds ratio (LOD) scores (Dudbridge and Koeleman 2004). We converted permutation-derivedP-values toq-values with the QVALUE software, using the bootstrap method to estimatep0and the defaultltuning parameters (Storey et al. 2004). We set the significance
threshold for declaring an eQTL at a false discovery rate of 1% (Chesler et al.2005).
Results
Construction of individualized genomes for RNA-seq read alignment
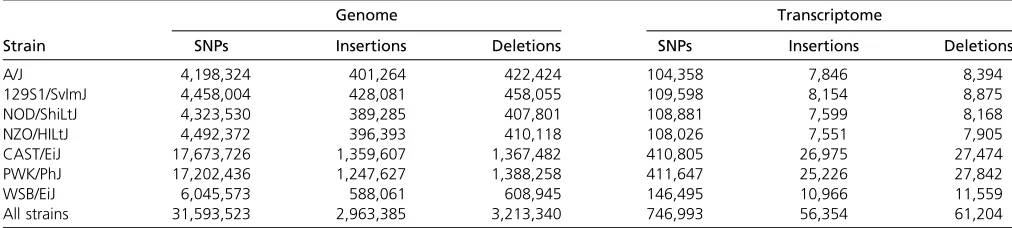
The DO is an outbred population derived from eight inbred mouse strains (Svenson et al. 2012). The seven nonrefer-ence founder strains of the DO population (A/J, 129S1/ SvImJ, NOD/ShiLtJ, NZO/HlLtJ, CAST/EiJ, PWK/PhJ, and WSB/EiJ) differ from the reference strain C57BL/6J geno-mic sequence (NCBIM37) at a large number of loci (Table 1). Variation is especially high in the three wild-derived strains (CAST, PWK, and WSB). SNPs in the CAST transcriptome relative to the NCBIM37 reference occur at a rate of 1/217 bases and indels are present at 1/1650 bases. Thus half of all 100-bp reads from CAST should contain at least one SNP or indel.
introducing known variants—SNPs and small indels—into two copies of the NCBIM37 reference genome. We use gene and isoform annotations (Ensembl version 67) to extract a diploid transcriptome, which will serve as the target for alignment of RNA-seq reads for the individual DO animal (Figure 1).
Performance on simulated data
We used simulated data to evaluate the accuracy of read alignment and transcript abundance estimation. We simulated 10 million 100-bp single-end reads from CAST and from a reconstructed DO genome, using the Flux Simulator (0.028% average mutations per sequence, 34.96 average quality) (Griebel
et al. 2012). We aligned the simulated reads to NCBIM37 and to the individualized CAST and DO transcriptomes, allowing for three or fewer mismatches in the alignment algorithm. We compared the alignment of each read to its simulated origin and summarized results at the gene and isoform levels. We compared gene- and isoform-level abundance estimates from RSEM to the realized values from the simulated read set aligned using both stringent (zero mismatches allowed) and more relaxed (three or fewer mismatches allowed) alignment criteria.
At the gene level, a read can (i) align uniquely to the correct location; (ii) align to multiple locations, one of which is correct; (iii) fail to align to any locus with three or fewer mismatches; (iv) align to multiple locations, none of which are correct; or (v) align uniquely to the incorrect location. Categories are ordered from best to worst outcome. When comparing two alignment methods, we consider the number of reads that improve in these categories and the degree of improvement.
CAST alignment
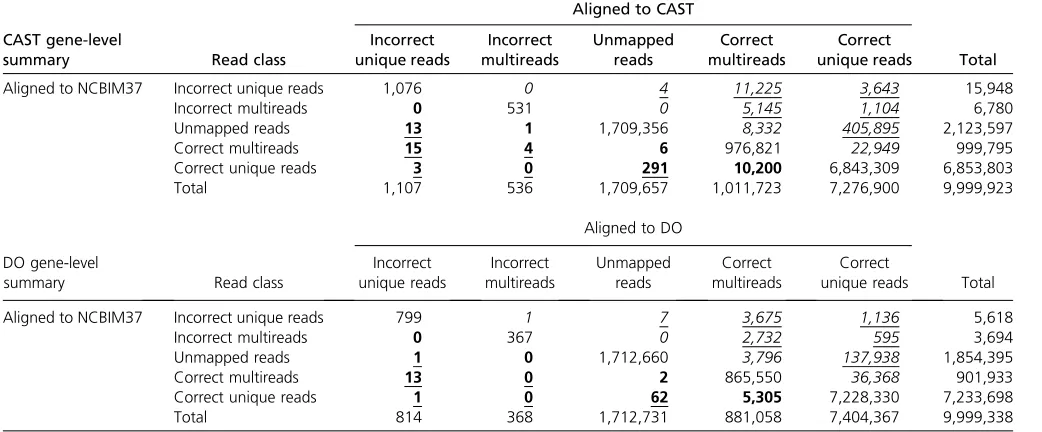
We aligned 9,999,923 simulated CAST reads to each of the NCBIM37 and CAST transcriptomes and assessed gene-level alignment quality by the above criteria (Table 2). A total of 458,297 reads improve by alignment to the CAST transcrip-tome (Table 2, italic entries), of which 93% (427,016 of 458,297 reads) improve by two or more categories (Table 2, underlined italic entries). In comparison, only 10,533 reads improve by alignment to NCBIM37 (Table 2, entries
in boldface type) of which only 3% (326 of 10,533 reads) improve by two or more categories (Table 2, entries in underlined boldface type). Isoform-level alignment is also improved by alignment to CAST. The frequency of multiple alignments at the isoform level is increased because many reads align to shared exons in multiple isoforms of a gene (Table S1).
Read alignment errors occur most frequently in genes with polymorphisms between CAST and NCBIM37, espe-cially in genes with closely related gene family members or retrotransposed pseudogenes. The 3643 reads that align uniquely to the correct location in CAST but to an incorrect unique location in NCBIM37 (Table 2) originate from 163 genes and incorrectly align to 168 other genes (Table S2). These alignment errors occur between pairs or small sets of gene family members. For example, 1119 simulated reads from Mug1 (murinoglobulin 1) align uniquely but incor-rectly in NCBIM37 to the family member Mug2 (murino-globulin 2). Genes with retrotransposed pseudogenes are similarly sensitive to misalignment. For example, 130 reads from the protein-coding gene Vcp (valosin-containing pro-tein) align uniquely but incorrectly in NCBIM37 to the pseudogene Vcp-rs (valosin-containing protein, related se-quence). This extreme class of alignment error can cause major deviations in gene abundance estimates. In the case of Vcp-rs, the pseudogene is mistakenly classified as an
expressed transcript. We also examined 405,895 reads that failed to align to NCBIM37 but are rescued to the unique, correct locus in CAST. These reads derive from nearly 10,000 genes (9599 genes with$1 reads; 4601 genes with $10 reads). Expression estimates for these genes are under-estimated by alignment to NCBIM37.
CAST abundance estimates
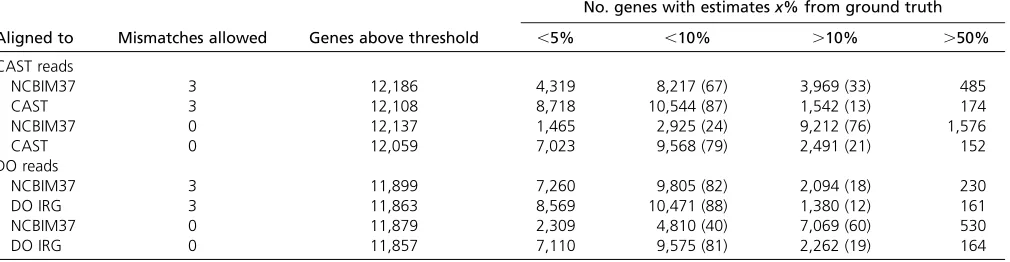
Alignment of simulated CAST reads to the CAST tran-scriptome improves the accuracy of gene-level abundance estimation compared to alignment to NCBIM37 (Table 3). We restricted our analysis to genes for which either the ground truth or the estimated count was at least 10, yield-ing 12,186 genes after alignment to NCBIM37 and 12,108 after alignment to CAST. Highly accurate abundance Table 1 Annotated SNPs and indels segregating among the eight CC/DO founder strains
Genome Transcriptome
Strain SNPs Insertions Deletions SNPs Insertions Deletions
A/J 4,198,324 401,264 422,424 104,358 7,846 8,394
129S1/SvImJ 4,458,004 428,081 458,055 109,598 8,154 8,875
NOD/ShiLtJ 4,323,530 389,285 407,801 108,881 7,599 8,168
NZO/HILtJ 4,492,372 396,393 410,118 108,026 7,551 7,905
CAST/EiJ 17,673,726 1,359,607 1,367,482 410,805 26,975 27,474
PWK/PhJ 17,202,436 1,247,627 1,388,258 411,647 25,226 27,842
WSB/EiJ 6,045,573 588,061 608,945 146,495 10,966 11,559
All strains 31,593,523 2,963,385 3,213,340 746,993 56,354 61,204
estimates—those within 5% of ground truth—occur for 4319 genes (35%) after alignment to NCBIM37 and for 8718 genes (72%) after alignment to CAST. A total of 8217 genes (67%) have gene-level abundance estimates within 10% of the ground truth after alignment to NCBIM37, compared to 10,544 (87%) of gene-level abun-dance estimates from alignment to CAST. There are 174 gene-level abundance estimates that differ by .50% from ground truth for the CAST alignment, vs. 485 such esti-mates after alignment to NCBIM37. If we consider only perfect-matching reads (reads that align with zero mis-matches), only 24% of gene estimates from the NCBIM37 alignment are within 10% of ground truth compared to 79% of gene estimates from the CAST alignment. Increas-ing the read depth does not affect these conclusions (Table S3).
Diversity Outbred alignment
We aligned 9,999,338 simulated reads from a reconstructed DO genome to each of the NCBIM37 and individualized DO transcriptomes (Table 2). A total of 186,248 reads improve by alignment to the DO transcriptome (Table 2, italic entries) and most (146,083) improve by two or more cate-gories (Table 2, underlined italic entries). In comparison, only 5384 reads improve by alignment to NCBIM37 (Table 2, entries in boldface type) and only 77 improve by two or more categories (Table 2, entries in underlined boldface type). As with CAST simulated reads, polymorphic genes with closely related gene family members or retrotransposed
pseudogenes are most sensitive to read alignment errors. A total of 5618 reads from 73 genes align to the correct unique location in the individualized DO transcriptome but align uniquely to 79 other genes in NCBIM37. Another 137,938 reads from 5759 genes fail to align to NCBIM37 but align uniquely to the correct gene in the individualized transcriptome (Table S4).
Diversity Outbred abundance estimates
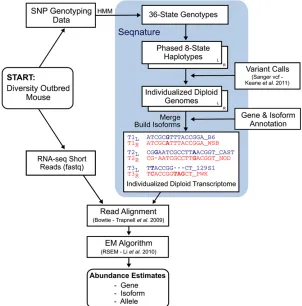
Alignment of DO reads to the individualized diploid DO transcriptome improves estimates of gene abundance (Table 3). We restricted our analysis to genes with ground truth or estimated counts of at least 10, yielding 11,899 genes after alignment to NCBIM37 and 11,863 genes after alignment to the individualized DO transcriptome. Highly accurate abun-dance estimates—those within 5% of ground truth—occur for 7260 genes (61%) after alignment to NCBIM37 and for 8569 genes (72%) after alignment to the individualized DO transcriptome. A total of 9805 genes (82%) have gene-level abundance estimates within 10% of the ground truth value after alignment to NCBIM37, compared to 10,471 (88%) of gene-level abundance estimates from alignment to the in-dividualized DO transcriptome. There are 161 gene-level abundance estimates that differ by.50% from ground truth for the individualized DO alignment,vs.230 such estimates after alignment to NCBIM37. If we consider only perfect-matching reads, only 40% of gene abundance estimates from alignment to NCBIM37 are within 10% of ground truth, compared to 81% of gene estimates from alignment Figure 1 Flowchart showing the RNA-seq analysis pipe-line and Seqnature tool. A Diversity Outbred mouse sam-ple is shown as an examsam-ple. Genomic DNA is genotyped at 7664 SNPs, which are then input into a hidden Markov model to impute 36-state founder strain genotypes. Seq-nature (highlighted in blue) infers genotype transitions by calculating the smallest number of recombinations nec-essary to produce the observed 36-state patterns and
outputs two 8-state genotype transitionfiles. Seqnature
constructs two haploid genomes by incorporating founder strain SNPs and indels into the reference genome according
to the genotype transitionfiles and creates two gene
an-notationfiles with adjusted coordinates (to offset insertions and deletions) and founder strain appended to feature
identifiers. The two genomes and annotation files are
to the individualized DO transcriptome. Increasing the read depth does not affect these conclusions (Table S5).
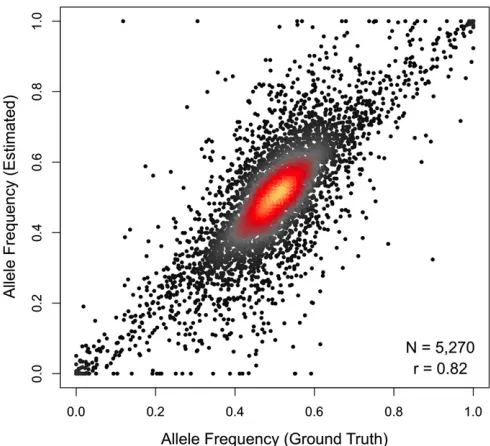
Allele-specific expression
Alignment to an individualized diploid transcriptome pro-vides direct estimates of allele-specific expression. We use the same EM algorithm that resolves genomic and isoform multireads to resolve allelic multireads. We analyzed the simulated DO data and compared the allele-specific count estimates to the ground truth. We restricted our analysis to the 5270 genes that were robustly expressed (total count $100) and had at leastfive aligned reads that overlapped one or more polymorphisms that distinguished the two alleles. Estimates of allele frequency, the proportion of reads assigned to the L allele in the DO simulation, are strongly correlated with ground truth (r= 0.82), with a median de-viation of 4% (Figure 2). A small number of genes deviate considerably from ground truth. This is most evident for extreme estimates of allelic imbalance, which appear as hor-izontal lines of dots at the top and bottom of Figure 2. These errors may result from one or both of two scenarios. In the first scenario, they may expose a weakness of the EM algo-rithm. Even when the total read count is high, if the number of reads that distinguish the two alleles is low, the likelihood of sampling reads from only one of the alleles by chance can be substantial. In such cases, the EM algorithm will assign all reads to the allele with the unique read alignments. Bayesian analysis with an informative prior or introduction of pseudocounts could be implemented to correct this prob-lem, but these methods will require further study. In the second scenario one or more allele-specific strain SNPs in these genes reduce the mappability of that particular allele and cause reads overlapping that SNP to align with less
precision to multiple places in the genome. Increasing read depth to 30 million reads and increasing stringency of filter-ing to require a minimum of 10 unique allelic alignments reduces this problem (Figure S1), arguing against wide-spread mappability artifacts. Our diploid alignment strategy uses all unique allele read alignments within a gene to in-form estimates of allele-specific expression, thus mitigating potential mappability artifacts stemming from any single variant.
Performance on real data
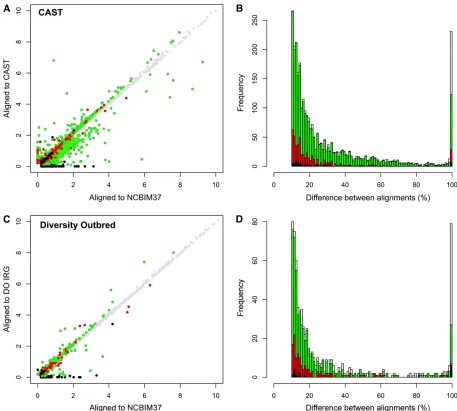
Individualized alignment of liver RNA-seq data from CAST and DO samples yields alignment statistics that are similar to our simulation results; this suggests that improvements in mapping accuracy and gene abundance estimates are also similar to the simulation results. Wefind that 75% of CAST reads align to the NCBIM37 transcriptome with three or fewer mismatches while 2.1% more reads (+252,905) align to the CAST transcriptome (Table S6). The difference between alignments is more striking for perfectly mapping reads (zero mismatch), as 23% more CAST reads (+982,229) align per-fectly to CAST but not to NCBIM37. One-quarter of expressed genes in the CAST liver sample (2984 of 11,964 genes) yield gene-level abundance estimates that differ by.10% between alignment to the CAST and NCBIM37 transcriptomes (Figure 3A). For most of this cohort (2242 of 2984 genes) the simu-lation results show that the CAST alignment abundance esti-mates are closer to the ground truth (green circles in Figure 3A). This suggests that simulations can identify the genes that are most sensitive to choice of alignment target; the median difference between NCBIM37- and CAST-derived abundance estimates was 20% in the real data and 12% in the simulated data (green bars in Figure 3B). A set of 439 genes has Table 2 Summary of read alignment in the simulated CAST and DO data
Aligned to CAST
CAST gene-level
summary Read class
Incorrect unique reads Incorrect multireads Unmapped reads Correct multireads Correct
unique reads Total
Aligned to NCBIM37 Incorrect unique reads 1,076 0 4 11,225 3,643 15,948
Incorrect multireads 0 531 0 5,145 1,104 6,780
Unmapped reads 13 1 1,709,356 8,332 405,895 2,123,597
Correct multireads 15 4 6 976,821 22,949 999,795
Correct unique reads 3 0 291 10,200 6,843,309 6,853,803
Total 1,107 536 1,709,657 1,011,723 7,276,900 9,999,923
Aligned to DO DO gene-level
summary Read class
Incorrect unique reads Incorrect multireads Unmapped reads Correct multireads Correct
unique reads Total
Aligned to NCBIM37 Incorrect unique reads 799 1 7 3,675 1,136 5,618
Incorrect multireads 0 367 0 2,732 595 3,694
Unmapped reads 1 0 1,712,660 3,796 137,938 1,854,395
Correct multireads 13 0 2 865,550 36,368 901,933
Correct unique reads 1 0 62 5,305 7,228,330 7,233,698
Total 814 368 1,712,731 881,058 7,404,367 9,999,338
abundance estimates that differ by.10% in the real data and showed an improvement over alignment to NCBIM37 in the simulation results (439 of 2984 genes) and the difference in abundance estimates between alignments is less variable. The median difference between NCBIM37-and CAST-derived abundance estimates was 16% in the real data and 5% in the simulated data (red circles and bars in Figure 3, A and B). Moreover, this suggests that the simulation study underestimated the actual differences in gene-level abundance estimates between alignment strategies, at least for the set of 2984 genes whose abundance estimates differ by.10% between alignment strategies in the real liver data. Individualized alignment also improves read alignment accuracy and abundance estimates in the DO sample. We observed that 1% more reads (+151,225) align with three or fewer mismatches and 9% more reads (+704,522) align perfectly in the individualized DO transcriptome compared to NCBIM37 (Table S6). In the comparison of gene abun-dance estimates, wefind that a total of 714 expressed genes differ by.10% from alignment strategy alone, and most of these (432 of 714 genes) show more accurate estimates from individualized alignment in the simulation study (green circles in Figure 3C). These genes appear to be highly sensitive to alignment strategy; the median difference in abundance estimates between NCBIM37 and individualized alignments was 16% in the real data and 14% in the simu-lated data (green bars in Figure 3D). Abundance estimates for 124 genes (124 of 714 genes) differ by.10% between alignment strategies in the real data and show an improve-ment from alignimprove-ment to NCBIM37 in the simulation study (red circles in Figure 3C). The difference in gene abundance estimates between alignment strategies is less variable (median difference: 15%, real data; 5%, simulation study) (red bars in Figure 3D). Again, the simulation study appears to underesti-mate the actual differences in gene-level abundance estiunderesti-mates between alignment strategies.
Overall, the improvements in read alignment and gene-level abundance estimation are more modest in the DO sample
relative to the CAST sample. This was expected given thatfive of the DO founder strains are closely related laboratory strains with greater similarity to the NCBIM37 reference compared to wild-derived strains such as CAST. That said, each DO sample will have a unique set of SNPs and indels that can bias read alignment, and in total across a large population of DO mice, the number of alignment-sensitive genes will approach the sum of all genes that are sensitive to alignment bias across all of the eight founder strains.
Individualized alignment reduces errors in RNA-seq eQTL studies
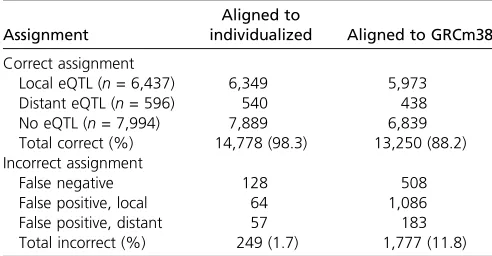
eQTL mapping on simulated data:We examined the effect of choice of alignment target on the identification of eQTL. We simulated 30 million single-end RNA-seq reads from each of 277 DO genomes and then mapped eQTL from the realized gene-level abundance values. In the simulated data, 15,027 genes pass the minimum coverage. Of these, 7033 have significant eQTL (6437 local and 596 distant eQTL) while 7994 genes have no significant eQTL at a false discovery rate (FDR) of 1%. Next, we aligned the simulated reads to the GRCm38 reference transcriptome and to the individualized diploid DO transcriptomes and compared the eQTL results mapped with the gene-level abundance estimates derived from these two strategies. Alignment of simulated reads to individualized DO transcriptomes yields a 98.3% accuracy rate in assigning eQTL—14,778 of 15,027 total calls are correct— and the 249 incorrect assignments are equally likely to be false negative or false positive associations (Table 4). In contrast, alignment of reads to the reference transcriptome results in 10% fewer correct assignments—only 13,250 of 15,027 total calls are correct—and most incorrect assign-ments result in false positive eQTL. Protein-coding genes are the predominant gene biotype in the simulated data set and as such account for most of the eQTL call improvements observed from the individualized alignment strategy (Table S7). Alignment to individualized transcriptomes improves eQTL call accuracy for all gene biotypes that exhibit eQTL Table 3 Comparison of gene abundance estimates for simulated CAST and DO RNA-seq data after alignment to NCBIM37 reference and individualized transcriptomes
No. genes with estimatesx% from ground truth
Aligned to Mismatches allowed Genes above threshold ,5% ,10% .10% .50%
CAST reads
NCBIM37 3 12,186 4,319 8,217 (67) 3,969 (33) 485
CAST 3 12,108 8,718 10,544 (87) 1,542 (13) 174
NCBIM37 0 12,137 1,465 2,925 (24) 9,212 (76) 1,576
CAST 0 12,059 7,023 9,568 (79) 2,491 (21) 152
DO reads
NCBIM37 3 11,899 7,260 9,805 (82) 2,094 (18) 230
DO IRG 3 11,863 8,569 10,471 (88) 1,380 (12) 161
NCBIM37 0 11,879 2,309 4,810 (40) 7,069 (60) 530
DO IRG 0 11,857 7,110 9,575 (81) 2,262 (19) 164
differences from alignment strategy in the simulation; pseudogenes in particular are sensitive to false positive distant eQTL when aligned to the reference transcriptome (see explanation below). A comprehensive summary of the eQTL simulation results can be found inTable S8.
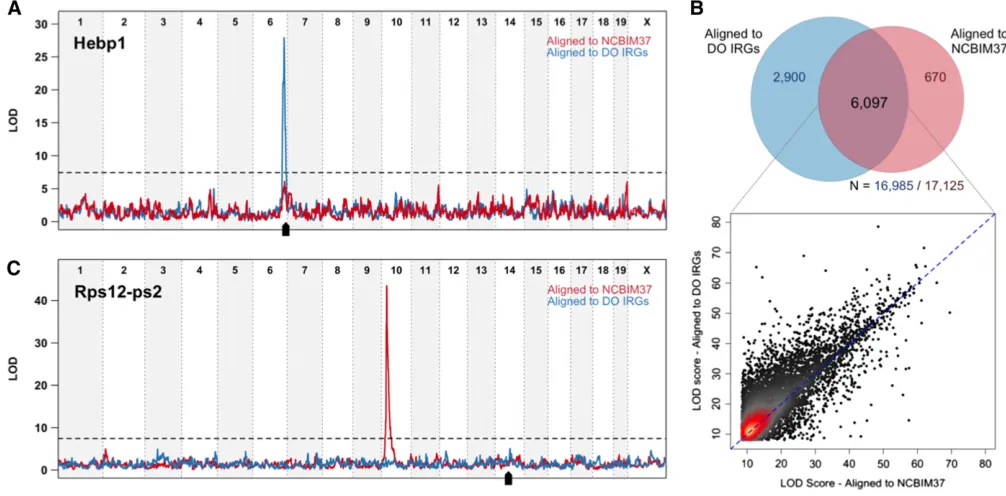
eQTL mapping on real data:We compared eQTL mapping on real liver RNA-seq data from 277 DO mice aligned to the NCBIM37 reference and to individualized DO transcriptomes. We identified significant local eQTL for 53% of expressed genes (8997 of 16,985 genes expressed above threshold; FDR = 1%) after alignment to individualized transcriptomes. Only 40% of expressed genes (6797 of 17,125 genes; FDR = 1%) had significant local eQTL after alignment to NCBIM37. For 2900 genes, a local eQTL is revealed only after alignment to individualized transcriptomes (Figure 4A). Among the 6097 local eQTL that are identified by both alignment strategies, most increase in significance from individualized alignments (Figure 4B). Individualized alignment improves the mapping resolution of local eQTL. Half of the 8997 significant local eQTL map within 372 kb of the midpoint of the gene they control (Table S9), compared to 428 kb for the 6767 local eQTL mapped in the NCBIM37 alignment (Table S10).
Significant distant eQTL are less common than strong local associations, accounting for 12% of the total eQTL
(n = 931/7698; FDR = 1%) from alignment to NCBIM37 (Table S9) and 9% of total eQTL (n = 887/9884; FDR = 1%) from alignment to individualized transcriptomes (Table S10). Moreover, wefind that many of the most highly sig-nificant distant eQTL are spurious and arise from alignment errors in NCBIM37. For example, after alignment to NCBIM37, expression of the pseudogeneRps12-ps2(located on Chr 14) appears to be controlled by a distant regulator on Chr 10 at the location of the Rps12 protein coding gene (Figure 4C). DO animals that are CAST or PWK in the Chr 10 eQTL region exhibit apparently higher expression of
Rps12-ps2 (Figure S2A). Alignment of DO samples to indi-vidualized transcriptomes eliminates the distant eQTL for
Rps12-ps2 (Figure 4C and Figure S2B) and also eliminates a local eQTL peak at Rps12 that showed a mirror-image pattern of allele effects. CAST- and PWK-derived reads in the individualized transcriptome align to the parent geneRps12
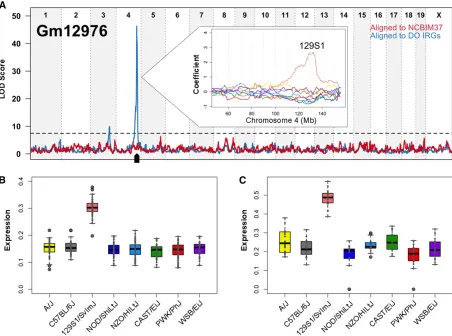
rather than to the retrotransposed pseudogeneRps12-ps2. Concordance between inferred founder allele effects in the DO and observed expression patterns in the founder strains provides additional evidence in support of local eQTL. RNA-seq was performed on 128 male liver samples from the eight DO founder strains. We aligned reads to strain-specific transcriptomes and estimated gene-level abundance, following the same procedure as above. For example, the long noncoding RNA (lincRNA) Gm12976 is associated with a local eQTL on Chr 4 and with a distant eQTL on Chr 3 only after alignment to individualized transcriptomes (Figure 5A). DO animals with the chromosome 4 region derived from the 129S1/SvImJ founder strain show higher expression of Gm12976 (Figure 5A, inset). Allele-specific estimates of gene expression demonstrate that this local eQTL is acting in cis through expression of 129S1-derived alleles in the DO animals (Figure 5B). We observed this same pattern of expression in the eight founder strains (Figure 5C), and we observe high concordance overall between expression in the founder strains and founder allele estimates in the DO for genes with significant local eQTL (Figure S3).
Discussion
RNA-seq is a robust and highly informative technology; however, the increase in information content comes with increased analytical complexity. We have demonstrated that alignment of RNA-seq reads to a reference genome can result in biased transcript abundance estimates, much in the same way that a reference-based probe design can bias hybridization of genetically diverse samples to microarrays (Walter et al. 2007). Mismatch tolerance in the alignment algorithm can increase the number of reads that align in the presence of sequencing errors or genetic variation. However, error tolerance will also increase the frequency of misalign-ment to gene family members and pseudogenes. This problem is amplified in genetically diverse multiparent populations like the outbred DO stock and inbred Collaborative Cross (CC) strains. We have experimented with many different alignment Figure 2 Read alignment to an individualized diploid transcriptome yields
accurate allelic abundance estimates. Estimated allele frequency (y-axis) is
plotted against the ground-truth allele frequency (x-axis) for 5270 genes
in the simulated data set of 10 million DO reads that were robustly expressed
(sum of allele counts$100) and had at least 5 uniquely aligned reads that
differentiated the two gene alleles. Allele-level gene abundances are strongly correlated to the ground-truth values (r= 0.82), with the estimated frequency
of the lower-expressed allele differing on average by,7% (median = 4%)
tools and consistently found the same problems in our eQTL mapping. While some alignment problems remain, the intro-duction of individual genome sequences corrects the majority of obvious anomalies and reveals a surprising amount of
genetic regulatory information that was masked by align-ment to the reference sequence.
Our knowledge of the genomes of the DO founder strains, especially the wild-derived strains, remains incomplete. These Figure 3 Gene-level abundance estimates in real data are improved by the individualized alignment strategy. (A) Gene-level abundance estimates are
plotted for one CAST sample after alignment to the NCBIM37 (x-axis) and CAST transcriptomes (y-axis). Points are colored based on the difference
between alignments and the results of the simulation study (n= 11,964 total genes). Gray circles denote genes with abundance estimates that differ by
,10% between alignment strategies (n= 8980). Green denotes genes that differ in the real data by.10% between alignment strategies and for which
the alignment to CAST improved the abundance estimate in the simulation study (n= 2242). Red denotes genes that differ by.10% in the real data
and for which alignment to NCBIM37 improved the abundance estimate in the simulation study (n= 439). Black denotes genes that differ by.10% in
the real data but for which the two alignment strategies yielded the same abundance estimates in the simulation study (n= 71). (B) The differences in
gene-level abundance estimates between alignment strategies in the real CAST data are plotted as a stacked histogram. The percentage of difference
between CAST and NCBIM37 alignments is plotted on thex-axis, and the total number of genes with that difference is plotted on they-axis. The same
coloring conventions are used as in A. White bars denote genes that differ by.10% in the real data but that were not expressed above threshold in the
simulated data set (n= 232). Differences were scaled to a maximum value of 100%. (C) Gene-level abundance estimates are plotted for one DO sample
after read alignment to the NCBIM37 (x-axis) and individualized transcriptomes (y-axis). A total of 714 genes in the real data differ by.10% between
alignment strategies (n= 714/12,248), of which 432 gene estimates were improved by alignment to the individualized transcriptome in the simulation
study (green circles), 124 were improved by alignment to NCBIM37 in the simulation (red circles), and 16 yielded the same gene estimate by both alignment strategies in the simulation study (black circles). (D) The difference in gene-level abundance estimates between alignment strategies in the real
DO data are plotted as a stacked histogram. The percentage of difference between DO and NCBIM37 alignment is plotted on thex-axis, and the total
number of genes with that difference is plotted on they-axis. The same coloring conventions are used as in C. White bars denote genes that differ by
genomes were assembled by alignment of short DNA sequence reads to the mouse reference genome as a first step in identifying SNPs, indels, and structural variants (Keaneet al.
2011). However, comprehensive elucidation of these genomes encompassing copy number variation and large-scale rear-rangements will requirede novoassembly from longer reads/ fragments (e.g., mate pair sequences) and optical mapping. Similarly, we lack a comprehensive understanding of differen-ces in transcription and splicing among these strains. In this study we restricted our focus to the reference set of Ensembl gene annotations largely derived from B6, with the under-standing that this may not reflect some of the most important differences between highly diverse founder strains. We find evidence for this inadequacy by comparing the alignment sum-mary statistics for B6 and CAST liver samples aligned to their respective strain-specific transcriptomes. Compared to CAST, more B6 reads align with fewer mismatches to fewer positions in the transcriptome, resulting in increased alignment specific-ity. A similar number of reads from CAST yield nearly twice as many valid alignments, and relaxing the aligner settings does not correct this problem (data not shown). We developed Seqnature software and the associated analysis pipeline as a first step toward maximizing the power and utility of sequenc-ing technologies in multiparent mappsequenc-ing populations. As we learn more about the structure of the founder genomes and transcriptomes, this knowledge can be incorporated to produce more accurate representations of the individual transcriptomes sampled in our study. Alignment to individualized genomes presents a challenge for comparison and visualization of sam-ple alignments; however, new tools make conversion back to reference genome coordinates straightforward (Huang et al.
2013).
For many genes, estimates of transcript abundance are relatively unaffected by alignment strategy. For example, 75% of expressed genes in CAST (n= 8980/ 11,964) have gene abundance estimates that differ by,10% after align-ment to NCBIM37 and CAST, and most (n= 6855/ 11,964) differ by,5%. The subset of genes most sensitive to align-ment method in real data consists primarily of closely related gene families and protein-coding genes with retrotransposed pseudogenes. Our simulations confirmed that pseudogenes can act as“read sinks”that shunt significant numbers of reads away from the protein-coding parent gene. Pseudogenes have long been considered functionless evolutionary relics; how-ever, recent evidence suggests that some are actively tran-scribed and play critical roles in gene regulation (Zheng and Gerstein 2007; Muroet al.2011; Poliseno 2012). There is not a clear delineation among gene, gene family, and pseu-dogene, and we feel that it is better to obtain accurate read alignments than to mask regions of low genomic mappability in the reference or apply a post hocfiltering based on gene
annotations. After an individual’s genetic variation is included in the alignment, particularly in the parent gene, many of these reads will align uniquely to the parent gene and be weighted accordingly by the EM algorithm (Figure S4 and Figure S5).
We have demonstrated that alignment to an individual-ized transcriptome is required to obtain accurate estimates of gene-level abundance when RNA is sequenced in genet-ically diverse samples. Many studies attempt to bypass this requirement by aligning reads to a common reference and discarding reads that do not align to a unique location (Lappalainenet al.2013; Battleet al.2014). However, it is clear from our analysis that many reads align uniquely in the individualized genome but align to multiple locations or fail to align to the reference genome—these highly informative reads would be discarded after alignment to the reference. Moreover, our results confirm published reports that relative gene abundance estimates based solely on unique read counts are biased—genes composed primarily of unique sequence are overestimated while genes with closely related pseudogenes or family members are underestimated (Mortazavi et al.2008; Li and Dewey 2011). The inclusion of multireads adds complexity to the abundance estimation problem but EM algorithms are well suited to this task (Li and Dewey 2011; Nicolae et al. 2011; Turro et al. 2011; Roberts and Pachter 2013).
Read alignment to individualized transcriptomes improves estimation of isoform abundance; however, isoform-level resolution remains challenging due to splicing complexity, shared exon sequence, and the short length of reads from current sequencing platforms. Forty percent of mouse genes have multiple isoforms (n= 15,079/37,991 genes; median = 4 isoforms) that share substantial exon sequence. Most 100-bp reads align equally well to multiple gene isoforms and in the absence of unique isoform reads the EM algorithm cannot assign isoform reads to a single isoform with any confidence (Table S11). Paired-end sequencing produces modest improve-ments in isoform quantification (Table S12); however, in our experience current enzymatic fragmentation protocols yield fragments that are too short to provide a clear benefit from paired-end sequences. Longer fragments and reads will Table 4 Comparison of gene expression QTL (eQTL) from simulated DO RNA-seq data aligned to individualized or GRCm38 reference transcriptome
Assignment
Aligned to
individualized Aligned to GRCm38
Correct assignment
Local eQTL (n= 6,437) 6,349 5,973
Distant eQTL (n= 596) 540 438
No eQTL (n= 7,994) 7,889 6,839
Total correct (%) 14,778 (98.3) 13,250 (88.2)
Incorrect assignment
False negative 128 508
False positive, local 64 1,086
False positive, distant 57 183
Total incorrect (%) 249 (1.7) 1,777 (11.8)
improve isoform resolution in the future, but we found that summarization at the gene level with 100-bp single-end reads is robust.
Alignment to individualized transcriptomes yields new insights into gene regulation in multiparent populations. For example, by aligning reads from DO mice to a single search space that includes individualized sequences of both alleles for every annotated isoform, our analysis approach provides direct estimates of allele-specific expression. By simulation, we have shown that 10 unique allele-level read alignments provide enough specificity to accurately estimate allele-specific gene expression and that sequencing to a depth of 30 million is sufficient for 5000+ genes to meet this threshold in a DO sample. The Seqnature software and analysis approach can be applied to other next generation sequencing technologies such as Chip-seq to identify allelic differences in transcription factor occupancy (Reddy et al.
2012) or DNase I sensitivity mapping to identify allele-specific chromatin activation (Degneret al.2012).
Previous eQTL studies in genetically diverse populations suggest that the most significant eQTL tend to be local (Rockman and Kruglyak 2006; Pickrell et al. 2010; Aylor
et al. 2011; Lappalainen et al. 2013). Gene prioritization methods are becoming more important in the genome-wide
association studies (GWAS) era (Hou and Zhao 2013), and genes with local eQTL are promising candidates for under-lying disease-associated regions in human GWAS studies (Knight 2005; Chen et al. 2008; Emilsson et al. 2008; Musunuru et al. 2010; Hou and Zhao 2013; Li et al.
2013). An eQTL may arise from any of several biological mechanisms, including rate of transcription, rate of degre-dation, or processing of RNA intermediates. The eQTL reflects a difference in abundance of the transcript that is associated with a marker locus but does not necessarily identify the mechanism. We have shown with simulated and real RNA-seq data that incorporation of individual ge-netic variation at the alignment step is critical to all down-stream analyses in high throughput sequencing studies including eQTL identification. Alignment of short sequence reads from genetically diverse individuals to a common ref-erence, as has been done in most previous RNA-seq studies (Landt et al. 2012), will cause spurious eQTL associations and mask real associations. In our study, eQTL mapping with gene abundance estimates derived from read alignment to the reference transcriptome missed nearly 3000 significant local eQTL associations. Importantly, all sequencing applica-tions will be sensitive to these alignment errors. Thus a causal variant that manifests as a local eQTL may be Figure 4 Alignment of Diversity Outbred mice to individualized transcriptomes (DO IRGs) reveals significant local eQTL and reduces the number of
spurious pseudogene eQTL. (A) An example of a local eQTL unmasked by alignment to individualized transcriptomes. Expression estimates forHebp1do
not appear linked to local genotype when reads are aligned to the common reference (red line). Accounting for individual genetic variation in the alignment step uncovers a strong local eQTL with a peak centered at the gene (blue line; black arrow denotes gene location). (B) Venn diagram showing
the overlap of local eQTL from the individualized or common reference alignment strategy. Local eQTL are identified for a majority of expressed genes by
one or both alignment strategies. Alignment to individualized transcriptomes (DO IRGs) identifies 2900 novel local associations. Even in the case of the
6097 local eQTL that are identified as significant by both alignments (overlapping region), LOD significance scores are generally higher after alignment
to individualized transcriptomes (y-axis in scatterplot) compared to NCBIM37 (x-axis). (C) Alignment to individualized transcriptomes reduces the number
of spurious distant eQTL at pseudogenes. Accounting for segregating founder strain polymorphisms in the parent protein-coding geneRps12ablates
obscured by the common reference alignment approach. Gene prioritization strategies that utilize sequence data an-alyzed by the common reference approach will fail to iden-tify these variants. Conversely, our simulation study shows that alignment errors to the reference transcriptome can sensitize a large group of genes to false positive local eQTL. In summary, failure to incorporate individual genetic variation at the alignment step will adversely affect read alignment and consequent analyses such as abundance estimation, eQTL iden-tification, and eQTLfine-mapping. We have developed Seq-nature and the associated analysis pipeline to be flexible with respect to species and type of sequencing application to support a broad array of experiments in genetically het-erogeneous populations.
Data accession
Individualized genomes and annotation files for the DO founder strains A/J, 129S1/SvImJ, NOD/ShiLtJ, NZO/HlLtJ, CAST, PWK/PhJ, and WSB/EiJ, as well as the unmodified
NCBIM37 (B6) reference genome and Ensembl v67 gene annotationfiles, are available for download athttp://cgd.jax. org/tools/Seqnature.shtml. The Seqnature software for con-structing individualized genomes and gene annotationfiles is available for download athttps://github.com/jaxcs/Seqnature. Simulation data are available at http://cgd.jax.org/tools/ Seqnature.shtml. Raw RNA-seq fastq files and processed gene-level data are archived at Gene Expression Omnibus under accession no. GSE45684.
Acknowledgments
S.C.M, N.R., K.C., J.H.G, M.A.H., E.J.C, and G.A.C. designed experiments; S.C.M., N.R., and K.C. performed experiments; S.C.M, N.R., K.C., D.M.G, J.H.G., E.J.C., and G.A.C. analyzed data; S.C.M., A.K.S., N.R., K.C., D.M.G., K.L.S., D.A.H., M.P.K., and A.D.A. contributed reagents/materials/analysis tools; and S.C.M and G.A.C. wrote the article with input from all authors. The authors declare no competingfinancial interests. Figure 5 Liver expression patterns observed in the DO founder strains suggest that novel local eQTL are real. (A) Alignment to individualized
tran-scriptomes (DO IRGs, blue line) reveals a strong local eQTL for the lincRNA Gm12976 on Chr 4. The eight founder strain coefficients inferred from the
additive mapping model are plotted in the inset and show that DO animals that derive this region of Chr 4 from the 129S1/SvImJ strain have higher expression of Gm12976. (B) Allele-level abundance estimates in the DO population show that the 129S1 allele of Gm12976 is high expressing,
confirming that the local eQTL is due tocis-acting variation. Founder strain origin is listed on thex-axis, and Gm12976 allelic abundance (upper quartile
normalized, square-root transformed) is plotted on they-axis. (C) This inferred DO strain pattern of Gm12976 expression is concordant with that
observed in the eight founder strains. Strains are listed on thex-axis, and Gm12976 abundance (upper quartile normalized, square-root transformed) is
The authors thank L. Somes and M. Strobel for breeding the mice and S. Ciciotte, S. Daigle, S. Kamdar, J. Pereira, C. Snow, and R. Lynch for extracting RNA and performing RNA-seq experiments. Research reported here was supported by The Jackson Laboratory and National Institutes of Health (NIH) grants under awards P50GM076468 (to G.A.C.); DK091207, DK66369, and DK58037 (to A.D.A.); and F32HD074299 (to S.C.M.).
Literature Cited
Aylor, D. L., W. Valdar, W. Foulds-Mathes, R. J. Buus, R. A. Verdugo
et al., 2011 Genetic analysis of complex traits in the emerging Collaborative Cross. Genome Res. 21: 1213–1222.
Battle, A., S. Mostafavi, X. Zhu, J. B. Potash, M. M. Weissmanet al., 2014 Characterizing the genetic basis of transcriptome diversity through RNA-sequencing of 922 individuals. Genome Res. 24(1): 14–24.
Broman, K. W., 2012 Haplotype probabilities in advanced inter-cross populations. G32:199–202.
Chen, Y., J. Zhu, P. Y. Lum, X. Yang, S. Pintoet al., 2008 Variations in DNA elucidate molecular networks that cause disease. Nature 452: 429–435.
Cheng, R., M. Abney, A. A. Palmer, and A. D. Skol, 2011 QTLRel: an R package for genome-wide association studies in which relatedness is a concern. BMC Genet. 12: 66.
Chesler, E. J., L. Lu, S. Shou, Y. Qu, J. Guet al., 2005 Complex trait analysis of gene expression uncovers polygenic and pleio-tropic networks that modulate nervous system function. Nat. Genet. 37(3): 233–242.
Churchill, G. A., D. M. Gatti, S. C. Munger, and K. L. Svenson, 2012 The Diversity Outbred mouse population. Mamm. Genome 23: 713–718.
Degner, J. F., J. C. Marioni, A. A. Pai, J. K. Pickrell, E. Nkadoriet al., 2009 Effect of read-mapping biases on detecting allele-specific expression from RNA-sequencing data. Bioinformatics 25: 3207–3212.
Degner, J. F., A. A. Pai, R. Pique-Regi, J. B. Veyrieras, D. J. Gaffney
et al., 2012 DNase I sensitivity QTLs are a major determinant of human expression variation. Nature 482(7385): 390–394. Derrien, T., J. Estellé, S. M. Sola, D. G. Knowles, E. Raineriet al.,
2012 Fast computation and applications of genome mappabil-ity. PLoS ONE 7(1): e30377.
Dudbridge, F., and B. P. Koeleman, 2004 Efficient computation of significance levels for multiple associations in large studies of correlated data, including genomewide association studies. Am. J. Hum. Genet. 75: 424–435.
Emilsson, V., G. Thorleifsson, B. Zhang, A. S. Leonardson, F. Zink
et al., 2008 Genetics of gene expression and its effect on dis-ease. Nature 452: 423–428.
Gatti, D. M., K.L. Svenson, A. Shabalin, L. Wu, W. Valdaret al., 2014 Quantitative trait locus mapping methods for Diversity Outbred mice. G3 4: 1623–1633.
Graze, R. M., L. L. Novelo, V. Amin, J. M. Fear, G. Casella et al., 2012 Allelic imbalance in Drosophila hybrid heads: exons, iso-forms, and evolution. Mol. Biol. Evol. 29(6): 1521–1532. Griebel, T., B. Zacher, P. Ribeca, E. Raineri, V. Lacroix et al.,
2012 Modelling and simulating generic RNA-Seq experiments with theflux simulator. Nucleic Acids Res. 40(20): 10073–10083. Huang, S., C. Kao, L. McMillan, and W. Wang. 2013 Transforming genomes using MODfiles with applications,Proceedings of the In-ternational Conference on Bioinformatics, Computational Biology and Biomedical Informatics. ACM, Washington, DC. Available at:
http://www.cs.ucla.edu/~weiwang/paper/ACMBCB13_1.pdf.
Hou, L., and H. Zhao, 2013 A review of post-GWAS prioritization approaches. Front. Genet. 4: 280.
Keane, T. M., L. Goodstadt, P. Danecek, M. A. White, K. Wonget al., 2011 Mouse genomic variation and its effect on phenotypes and gene regulation. Nature 477: 289–294.
Knight, J. C., 2005 Regulatory polymorphisms underlying com-plex disease traits. J. Mol. Med. 83: 97–109.
Landt, S. G., G. K. Marinov, A. Kundaje, P. Kheradpour, F. Pauli
et al., 2012 ChIP-seq guidelines and practices of the ENCODE and modENCODE consortia. Genome Res. 22: 1813–1831. Langmead, B., C. Trapnell, M. Pop, and S. L. Salzberg,
2009 Ultrafast and memory-efficient alignment of short DNA se-quences to the human genome. Genome Biol. 10: R25.
Lappalainen, T., M. Sammeth, M. R. Friedlander, P. A. C.‘t Hoen, J. Monlonget al., 2013 Transcriptome and genome sequencing uncovers functional variation in humans. Nature 501: 506–511. Li, B., and C. Dewey, 2011 RSEM: accurate transcript quantifi ca-tion from RNA-Seq data with or without a reference genome. BMC Bioinformatics 12(1): 323.
Li, B., V. Ruotti, R. M. Stewart, J. A. Thomson, and C. N. Dewey, 2010 RNA-Seq gene expression estimation with read mapping uncertainty. Bioinformatics 26: 493–500.
Li, H., and R. Durbin, 2009 Fast and accurate short read align-ment with Burrows-Wheeler transform. Bioinformatics 25(14): 1754–1760.
Li, Q., J. H. Seo, B. Stranger, A. McKenna, I. Pe’er et al., 2013 Integrative eQTL-based analyses reveal the biology of breast cancer risk loci. Cell 152: 633–641.
Lister, R., R. C. O’Malley, J. Tonti-Filippini, B. D. Gregory, C. C. Berry et al., 2008 Highly integrated single-base resolution maps of the epigenome inArabidopsis. Cell 133(3): 523–536. McKenna, A., M. Hanna, E. Banks, A. Sivachenko, K. Cibulskiset al.,
2010 The Genome Analysis Toolkit: a MapReduce framework for analyzing next-generation DNA sequencing data. Genome Res. 20: 1297–1303.
McManus, C. J., J. D. Coolon, M. O. Duff, J. Eipper-Mains, B. R. Graveleyet al., 2010 Regulatory divergence in Drosophila re-vealed by mRNA-seq. Genome Res. 20(6): 816–825.
Mortazavi, A., B. A. Williams, K. McCue, L. Schaeffer, and B. Wold, 2008 Mapping and quantifying mammalian transcriptomes by RNA-Seq. Nat. Methods 5: 621–628.
Mouse Genome Sequencing Consortium, 2002 Initial sequencing and comparative analysis of the mouse genome. Nature 420: 520–562.
Muro, E. M., N. Mah, and M. A. Andrade-Navarro, 2011 Functional evidence of post-transcriptional regulation by pseudogenes. Bio-chimie 93: 1916–1921.
Musunuru, K., A. Strong, M. Frank-Kamenetsky, N. E. Lee, T. Ahfeldtet al., 2010 From noncoding variant to phenotype via SORT1 at the 1p13 cholesterol locus. Nature 466: 714–719. Nagalakshmi, U., Z. Wang, K. Waern, C. Shou, D. Raha et al.,
2008 The transcriptional landscape of the yeast genome
de-fined by RNA sequencing. Science 320: 1344–1349.
Nicolae, M., S. Mangul, I. I. Măndoiu, and A. Zelikovsky, 2011 Estimation of alternative splicing isoform frequencies from RNA-Seq data. Algorithms Mol. Biol. 6(1): 9.
Patro, R., S. M. Mount, and C. Kingsford, 2014 Sailfish enables alignment-free isoform quantification from RNA-seq reads using lightweight algorithms. Nat. Biotechnol. 32: 462–464. Pickrell, J. K., J. C. Marioni, A. A. Pai, J. F. Degner, B. E. Engelhardt
et al., 2010 Understanding mechanisms underlying human gene expression variation with RNA sequencing. Nature 464 (7289): 768–772.
Poliseno, L., 2012 Pseudogenes: newly discovered players in human cancer. Sci. Signal. 5: re5.
transcription factor occupancy and gene expression. Genome Res. 22(5): 860–869.
Rivas-Astroza, M., D. Xie, X. Cao, and S. Zhong, 2011 Mapping personal functional data to personal genomes. Bioinformatics 27(24): 3427–3429.
Roberts, A., and L. Pachter, 2013 Streaming fragment assignment for real-time analysis of sequencing experiments. Nat. Methods 10(1): 71–73.
Rockman, M. V., and L. Kruglyak, 2006 Genetics of global gene expression. Nat. Rev. Genet. 7: 862–872.
Rozowsky, J., A. Abyzov, J. Wang, P. Alves, D. Raha et al., 2011 AlleleSeq: analysis of allele-specific expression and binding in a network framework. Mol. Syst. Biol. 7: 522.
Satya, R. V., N. Zavaljevski, and J. Reifman, 2012 A new strategy to reduce allelic bias in RNA-Seq readmapping. Nucleic Acids Res. 40: e127.
Shen, Y., T. Garcia, V. Pabuwal, M. Boswell, A. Pasquali et al., 2013 Alternative strategies for development of a reference transcriptome for quantification of allele specific expression in organisms having sparse genomic resources. Comp. Biochem. Physiol. Part D Genomics Proteomics 8(1): 11–16.
Skelly, D. A., M. Johansson, J. Madeoy, J. Wakefield, and J. M. Akey, 2011 A powerful andflexible statistical framework for testing hypotheses of allele-specific gene expression from RNA-seq data. Genome Res. 21(10): 1728–1737.
Stevenson, K. R., J. D. Coolon, and P. J. Wittkopp, 2013 Sources of bias in measures of allele-specific expression derived from RNA-seq data aligned to a single reference genome. BMC Ge-nomics 14: 536.
Storey, J. D., J. E. Taylor, and D. Seigmund, 2004 Strong control, conservative point estimation and simultaneous conservative
consistency of false discovery rates: a unified approach. J. R. Stat. Soc. B 66(Part 1): 187–205.
Svenson, K. L., D. M. Gatti, W. Valdar, C. E. Welsh, R. Chenget al., 2012 High-resolution genetic mapping using the Mouse Diversity outbred population. Genetics 190: 437–447.
Trapnell, C., L. Pachter, and S. L. Salzberg, 2009 TopHat: discov-ering splice junctions with RNA-Seq. Bioinformatics 25(9): 1105–1111.
Trapnell, C., B. A. Williams, G. Pertea, A. Mortazavi, G. Kwanet al., 2010 Transcript assembly and quantification by RNA-Seq reveals unannotated transcripts and isoform switching during cell differentiation. Nat. Biotechnol. 28(5): 511–515.
Turro, E., S. Y. Su, A. Goncalves, L. J. Coin, S. Richardson et al., 2011 Haplotype and isoform specific expression estimation us-ing multi-mappus-ing RNA-seq reads. Genome Biol. 12: R13. Walter, N. A., S. K. McWeeney, S. T. Peters, J. K. Belknap, R.
Hitze-mannet al., 2007 SNPs matter: impact on detection of differ-ential expression. Nat. Methods 4: 679–680.
Wang, Z., M. Gerstein, and M. Snyder, 2009 RNA-Seq: a revolu-tionary tool for transcriptomics. Nat. Rev. Genet. 10: 57–63. Welsh, C. E., and L. McMillan, 2012 Accelerating the inbreeding
of multi-parental recombinant inbred lines generated by sibling matings. G32:191–198.
Wu, T. D., and S. Nacu, 2010 Fast and SNP-tolerant detection of complex variants and splicing in short reads. Bioinformatics 26(7): 873–881.
Zheng, D., and M. B. Gerstein, 2007 The ambiguous boundary between genes and pseudogenes: The dead rise up, or do they? Trends Genet. 23: 219–224.
GENETICS
Supporting Information
http://www.genetics.org/lookup/suppl/doi:10.1534/genetics.114.165886/-/DC1
RNA-Seq Alignment to Individualized Genomes
Improves Transcript Abundance Estimates in
Multiparent Populations
Steven C. Munger, Narayanan Raghupathy, Kwangbom Choi, Allen K. Simons, Daniel M. Gatti, Douglas A. Hinerfeld, Karen L. Svenson, Mark P. Keller, Alan D. Attie, Matthew A. Hibbs, Joel H. Graber, Elissa J. Chesler, and Gary A. ChurchillFile S1
Supplemental Methods
Simulation parameters
RNA‐seq reads were simulated from the CAST inbred strain and from a reconstructed DO individual using the Flux Simulator
(version 1.2) and the parameters below.
Command line argument: flux‐simulator –lsp Parameter_filename.txt
Single‐end sequence parameters
REF_FILE_NAME path/to/Gene_annotations.gtf
GEN_DIR path/to/Genome.fa
LIB_FILE_NAME filename.lib
SEQ_FILE_NAME filename.bed
PRO_FILE_NAME filename.pro
RT_PRIMER PDT
READ_NUMBER 10000000 (or 30000000)
READ_LENGTH 100
FILTERING true
SIZE_DISTRIBUTION N(280,50)
FASTA true
TSS_MEAN NaN
POLYA_SCALE NaN
POLYA_SHAPE NaN
ERR_FILE 76
Paired‐end sequence parameters
REF_FILE_NAME path/to/Gene_annotations.gtf
GEN_DIR path/to/Genome.fa
LIB_FILE_NAME filename.lib
SEQ_FILE_NAME filename.bed
PRO_FILE_NAME filename.pro
RT_PRIMER PDT
READ_NUMBER 60000000
READ_LENGTH 100
PAIRED_END YES
FILTERING true
SIZE_DISTRIBUTION N(280,50)
FASTA true
TSS_MEAN NaN
POLYA_SCALE NaN
POLYA_SHAPE NaN
ERR_FILE 76
Table S1 Isoform‐level summary of read alignment in the simulated CAST data
The simulated reads were aligned to the NCBIM37 and CAST transcriptomes. Reads that improve by alignment to CAST are
highlighted in green, with those that improve by two or more categories are highlighted in dark green. Reads that improve by
alignment to NCBIM37 are highlighted in red, with those that improve by two or more categories highlighted in dark red. Reads
on the diagonal align equivalently by both strategies.
Table S2 List of genes from the CAST simulation that were affected by read misalignment or alignment failure from the
reference alignment strategy
Three lists of genes are included in the attached table. The first list shows genes for which simulated CAST reads align uniquely
but falsely in the NCBIM37 transcriptome. Alignment to the CAST transcriptome rescues these reads to their correct, unique
origin (second list). The third list shows genes from which reads fail to align at all in the NCBIM37 transcriptome but align to the
correct, unique position in the CAST transcriptome.
Table S2 is available for download as a MS Excel file at
http://www.genetics.org/lookup/suppl/doi:10.1534/genetics.114.165886/‐/DC1
Table S3 Comparison of gene‐level abundance results from alignment of 30 million simulated CAST reads to NCBIM37 and
CAST transcriptomes
Alignment of 30 million simulated CAST reads to the individualized CAST transcriptome (≤3 mismatches) results in nearly three
times as many gene estimates (N= +6,339) that fall within 5% of ground truth value and fewer than a third as many gene
estimates (N= ‐4,204) that deviate more than 10% from the ground truth. Gene‐level abundance results for perfect matching
reads (i.e. 0 mismatches) are also shown.