TOMBERLIN, KRISTEN EMILY. Life Cycle Carbon Analysis of US Pulp and Paper Grades Using Self-Reported Mill Data. (Under the direction of Dr. Richard Venditti and Dr. Yuan Yao).
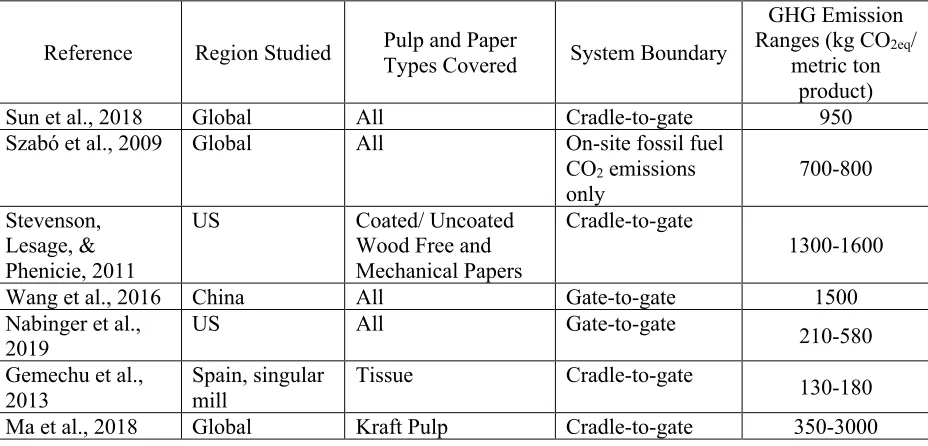
As climate concerns grow, the importance of understanding greenhouse gas (GHG) emissions sources will increase. Literature on the pulp and paper industry give general GHG emissions data, compare it to other industries, or are life cycle analysis (LCA) where a singular mill or specific process type is analyzed. These studies have a wide range of emissions results, from 130 to 3000 kg CO2eq per metric ton of paper product, due to varying geographic locations, scopes, assumptions, products included, and data sources.
This research takes self-reported mill data from all US pulp and paper mills, representing 865 product lines, and tracks GHG emissions from cradle to gate. By considering fuel,
electricity, chemical, fiber, and transportation emissions, the highest emission sources can be determined and analyzed. Furthermore, this research separates all product lines into categories based on manufacturing process and end use. Doing this allows for a deeper understanding of the various needs paper mills have and potential strategies for emissions reductions. By providing transparent information on emissions factors and calculated totals, this research also seeks to provide other researchers with the foundation needed to explore emissions reductions further.
Using Self-Reported Mill Data
by
Kristen Tomberlin
A thesis submitted to the Graduate Faculty of North Carolina State University
in partial fulfillment of the requirements for the degree of
Master of Science
Forest Biomaterials
Raleigh, North Carolina 2019
APPROVED BY:
_______________________________ _______________________________ Dr. Richard Venditti Dr. Yuan Yao
Co-Chair of Advisory Committee Co-Chair of Advisory Committee
ii DEDICATION
iii ACKNOWLEDGMENTS
I would like to start by thanking Dr. Richard Venditti for allowing me the opportunity to join this program and his guidance throughout. I’d also like to thank Dr. Yuan Yao for her constant feedback and encouragement. I’d also like to thank them both for their patience with me throughout the whole process. Thank you, Dr. Sunkyu Park for being on my committee and offering advice when I needed it.
I’d like to acknowledge the USDA-NIFA project, Preparing Diverse and Rural Students to Meet the Challenges in the Bioproducts and Bioenergy Industry, award number: 2017-67009-26771, for funding this project.
Without the support of my friends and family, I would not have made it this far. Thank you, mom and dad for always telling me how proud they are and for their sacrifices throughout my college career. Thank you, Anna for always listening and being there for me. Thank you to everyone at the Natural Resources Library for making work fun and providing a quiet place to relax. Thank you, Heather for bringing me into the paper world and encouraging me to pursue a graduate degree.
A huge thank you to Michael, for making me laugh when I needed it most, allowing me to be myself, and for making our house a home.
iv TABLE OF CONTENTS
LIST OF TABLES ... v
LIST OF FIGURES ... vi
Chapter 1: Introduction ... 1
Chapter 2: Methodology ... 5
Scope ... 5
Calculations and Definitions ... 6
Greenhouse Gas Emission Factors ... 7
Chapter 3: Results & Discussion ... 14
Overall ... 14
Fuels ... 18
Electricity ... 21
Chemicals ... 23
Wood ... 24
Transportation ... 25
Distributions of GHGI Results ... 26
Chapter 4: Conclusions ... 29
v LIST OF TABLES
Table 1.1 Summary of previous literature results regarding the GHG emissions of the
pulp and paper industry. ... 2 Table 2.1 Paper product categories with abbreviations and definitions (Wedel et al.
2013) ... 6 Table 2.2 GHG emission factors for fuels (FisherSolve, 2018; U. S. Environmental
Protection Agency, 2018). Biogenic carbon dioxide sources are highlighted in green and are excluded from the total GHG emission factor and total annual
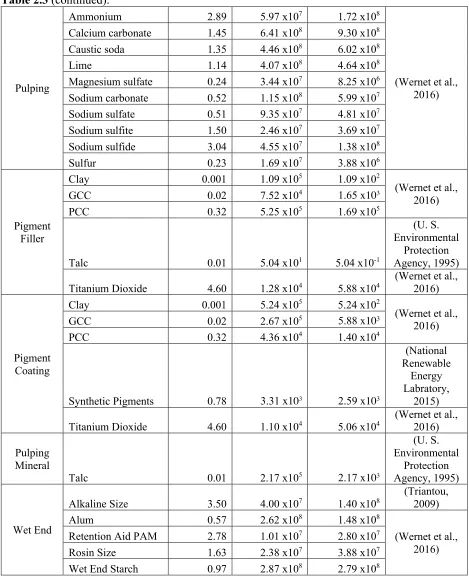
GHG emissions. ... 8 Table 2.3 Cradle-to-gate GHG emission factors for chemicals along with total industry
use (FisherSolve, 2018) and total upstream emissions. These factors include upstream emissions from manufacturing. Does not include transportation
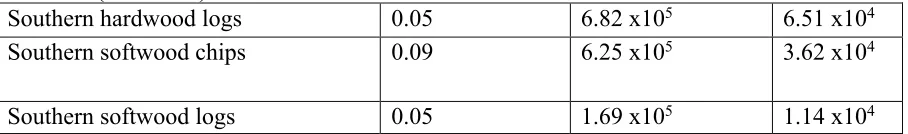
emissions. ... 9 Table 2.4 GHG emission factors and total annual consumption of wood from 2018 data
(FisherSolve, 2018; National Renewable Energy Labratory, 2015). These emissions factors reflect only upstream emissions from wood procurement.
Transportation is not included ... 11 Table 2.5 Distances and transportation method percent related to materials consumed
(US Census Bureau). ... 13 Table 2.6 GHG emission factors for transportation methods (U. S. Environmental
Protection Agency, 2018). ... 13 Table 3.1 Annual production, energy consumption, and raw material purchase of the
U.S. pulp and paper industry by product grades (FisherSolve, 2018) ... 14 Table 3.2 Annual GHG emissions of the U.S. pulp and paper industry by product grades
and sources. ... 15 Table 3.3 GHG intensities for all US pulp and paper product categories ... 17 Table 3.4 Summary of total annual energy consumed by the US Pulp and Paper industry
vi LIST OF FIGURES
Figure 3.1 Greenhouse gas intensities for each paper category broken down by source.
Biogenic CO2 is from bio-based fuels only. ... 18 Figure 3.2 Fuel greenhouse gas intensities for each paper category broken down by
source. ... 20 Figure 3.3 Emission intensity and cost comparison for various fuels used in the US pulp
and paper industry ... 21 Figure 3.4 State map comparing electricity emission factors (eGRID 2016) and annual
electricity use of mills across the U.S ... 22 Figure 3.5 Chemical greenhouse gas intensities for each paper category broken down by
chemical type. Only upstream emissions from the production of each
chemical is included. See table 2.3 for chemicals included in each type. ... 24 Figure 3.6 Greenhouse gas intensity from wood procurement, logs and chips, for each
1 CHAPTER 1
INTRODUCTION
In 2018, 84.4 million metric tons of pulp and paper products were manufactured in the United States alone (FisherSolve, 2018). These products range from copy paper to sanitary products to cardboard to specialty pulps for non-paper products (e.g. rayon). The global pulp and paper industry is growing as the average per capita paper consumption increases (RISI, 2018).
The U.S. pulp and paper industry consumes 2 billion GJ of fuel and electricity annually (U.S. Energy Information Administration, 2014). Approximately 67% of this energy comes from renewable resources, mostly bio-based byproducts created during production (FisherSolve, 2018). It is estimated that, from cradle to gate, one ton of paper creates 950 kg of carbon dioxide equivalent (CO2eq) (Sun et al., 2018) As the third largest energy consumer in the U.S. (EIA 2014), the greenhouse gas (GHG) emissions from the pulp and paper industry are of great concern. With an increase in policy, environmental regulation, and demand for “greener”
products, the pulp and paper industry is encouraged to lower emissions while maximizing profit. Existing research has sought to measure the emissions and environmental impact of the paper industry using various estimation methods. These assessments fall into two general
2 There are also studies that seek to analyze the global pulp and paper industry. By using models based on current production, possible economic trends, and climate change policy, these studies focused on evaluating the emissions reduction potential of different policy and technical strategies. One study analyzed different climate scenarios and indicated that carbon taxes have potential to encourage GHG reductions while a focus on energy efficiency throughout the mill could reduce GHG’s in a more direct way (Szabó et al., 2009). The International Panel on
Climate Change (IPCC) has gathered data on GHG emissions from global industries. In the Fifth Assessment Report, the IPCC focused on mitigation strategies for industries and, similarly to the government based reports, emphasize the potential for reductions through energy efficiency practices (Fischedick et al. 2014).
Table 1.1 Summary of previous literature results regarding the GHG emissions of the pulp and paper industry.
Reference Region Studied Pulp and Paper
Types Covered System Boundary
GHG Emission Ranges (kg CO2eq/
metric ton product)
Sun et al., 2018 Global All Cradle-to-gate 950
Szabó et al., 2009 Global All On-site fossil fuel CO2 emissions only 700-800 Stevenson, Lesage, & Phenicie, 2011
US Coated/ Uncoated Wood Free and Mechanical Papers
Cradle-to-gate
1300-1600
Wang et al., 2016 China All Gate-to-gate 1500
Nabinger et al., 2019
US All Gate-to-gate
210-580 Gemechu et al.,
2013
Spain, singular mill
Tissue Cradle-to-gate 130-180
Ma et al., 2018 Global Kraft Pulp Cradle-to-gate 350-3000
3 2017. This report, like the other largescale reports, gave an overview of the industry through emission totals (EPA, 2017) .
While a good indicator of where an industry stands comparatively to other local industries, these studies lack the depth to pinpoint high emission sources and ability to offer reduction strategies that fit various mill types. Since paper products come in a wide variety, from virgin to recycled fibers and tissue to paperboard products, these overall estimations generalize the industry.
On the other hand, life cycle analysis (LCA) has been frequently used to measure the environmental impacts of a single product/service within a pre-defined system boundary. Most of previous LCA studies analyzed specific processes for internal use or compared the
environmental impacts of products with similar functions. The American Forest and Paper Association partners with the Forest Products Association of Canada to develop an LCA on four different grades of printing and writing papers (Stevenson et al., 2011). They noted that their LCA is not made for comparative purposes for other forms of communication but rather as an indicator for the pulp and paper industry (Stevenson et al., 2011). Another study used LCA to compare recycled paper to polystyrene egg packaging (Zabaniotou & Kassidi, 2003). Unlike the writing papers LCA, the goal of this study was to measure and compare the environmental impacts of two different materials for the same product. These studies provided estimations of one/multiple product(s) from a specific site and their results may be used as general estimations for similar products. Given the large variety of pulp and paper products, their results may not be applied to products that are not similar with those studied in previous literature. However, performing An LCA could take a substantial amount of resources and time to produce
4 This research addressed the knowledge gaps by calculating GHG emissions from the 252 active US pulp and paper mills while exploring emission intensity and source differences
between product types. Since a majority of mills have multiple product lines, 865 of these product lines were sorted based on manufacturing method and end use. By doing so, this research presents an in-depth analysis of emissions differences between product types and provides catered emission saving strategies for each category. This research also seeks to be as transparent as possible and provides all emission factors and totals used. The results and data shown in this study can be used as a transparent and reliable data sources by other researchers for future LCA, energy, and environmental analysis related to the pulp and paper industry.
5 CHAPTER 2
METHODOLOGY Scope
The scope of this study includes operating pulp and paper mills in the United States that reported a finished product in the first quarter of 2018. Sixteen mills, representing >1% of production by weight, did not report or lacked complete data and were excluded. This study focused on GHG emissions and the system boundary is cradle-to-gate, including upstream production of fuels, electricity, chemicals, and wood, production of pulp and paper, and transportation of all materials to the mill.
The Life Cycle Inventory (LCI) data (e.g., production capacity and usage of fuels and chemicals) related to mills and product lines were collected from FisherSolve, a global database on pulp and paper mills. FisherSolve provides data that is updated quarterly, allowing the use of 2018 data from all U.S. mills. Data from FisherSolve is a combination of self-reported totals and data-mined estimates. Names of mills were removed for anonymity.
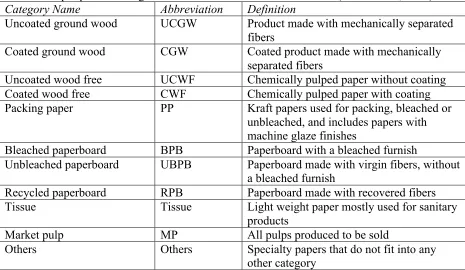
6 Table 2.1 Paper product categories with abbreviations and definitions (Wedel et al., 2013).
Category Name Abbreviation Definition
Uncoated ground wood UCGW Product made with mechanically separated fibers
Coated ground wood CGW Coated product made with mechanically separated fibers
Uncoated wood free UCWF Chemically pulped paper without coating Coated wood free CWF Chemically pulped paper with coating Packing paper PP Kraft papers used for packing, bleached or
unbleached, and includes papers with machine glaze finishes
Bleached paperboard BPB Paperboard with a bleached furnish
Unbleached paperboard UBPB Paperboard made with virgin fibers, without a bleached furnish
Recycled paperboard RPB Paperboard made with recovered fibers
Tissue Tissue Light weight paper mostly used for sanitary
products
Market pulp MP All pulps produced to be sold
Others Others Specialty papers that do not fit into any
other category
Calculations and Definitions
For the pulp and paper production, GHG emissions mainly generated by fuel combustion. In this study, on-site GHG emissions were estimated based on the fuel usage and GHG emission factors of each fuel used by mills. Emission factors, which provide the amount of GHG
7 kg CO2eq, fossil = 1(kg CO2) + 30(kg CH4, fossil) + 265(kg N2O) (1)
kg CO2eq, bio = 28(kg CH4, bio) + 265(kg N2O) (2)
Equation (2) does not include biogenic CO2 as it is separately tracked in this study. Bio-based fuels are typically assumed to be carbon neutral as the biogenic CO2 released from combustion is assumed to be captured by new biomass growth. This study does not include carbon sequestration, but separately accounted biogenic carbon and fossil-based carbon which can be used by future studies that do want to take carbon sequestration in to consideration. It should be noted that in this study CO2 emissions from upstream activities related to bio-based fuels (e.g., transportation) are not considered biogenic.
Total emissions for each aspect (fuels, chemicals, electricity etc.) tracked were calculated through multiplication of the emission factor (kg CO2eq/unit of material) by the total annual amount used. This was done for each product line and then totaled for each product category and overall. For comparison purposes, the total emissions for each product category is then divided by the total annual metric tons of product produced to give then GHG intensity (GHGI, kg CO2eq/metric ton product). The GHGI were also used to compare results with previous studies. Greenhouse Gas Emission Factors
This paper uses GHG emission factors collected from a variety of sources. In some cases, proxies were used and are noted as needed throughout.
8 compressed natural gas, and liquefied natural gas were assumed to have equivalent emissions on a per heating unit basis.
Table 2.2 GHG emission factors for fuels (FisherSolve, 2018; U. S. Environmental Protection Agency, 2018). Biogenic carbon dioxide sources are highlighted in green and are excluded from the total GHG emission factor and total annual GHG emissions.
Fuel
Pre-combustion
Emission Factor (kg CO2eq/ GJ)
Combustion Emission Factors
Total GHG Emission Factor (kg CO2eq/ GJ)
Carbon Dioxide (kg CO2/
GJ)
Methane (kg CH4/
GJ
Nitrous Oxide (kg N2O/
GJ)
Total GHG
(kg CO2eq/
GJ)
Biodiesel 0.002 70.0* 1.04x10-3 1.04x10⁻⁴ 0.06 0.06
Biogas 2.890 49.4 3.03x10⁻³ 5.97x10⁻⁴ 0.25 3.14
Compressed Natural Gas (CNG)
0.017 50.3 9.48x10⁻⁴ 9.48x10⁻⁵ 50.35 50.36
Coal 6.120 89.7 1.04x10⁻² 1.52x10⁻³ 90.45 96.57
Natural Gas 0.009 50.3 9.48x10⁻⁴ 9.48x10⁻⁵ 50.35 50.36
Liquefied Natural Gas (LNG)
0.008 50.3 9.48x10⁻⁴ 9.48x10⁻⁵ 50.35 50.36
Methanol 0.004 67.9 0.00 0.00 0.00 0.00
Number 2 Oil 0.013 70.1 2.84x10⁻³ 5.69x10⁻⁴ 70.34 70.35
Number 6 Oil 0.013 71.2 2.84x10⁻³ 5.69x10⁻⁴ 71.42 71.43
Petcoke 0.034 97.1 2.84x10⁻³ 5.69x10⁻⁴ 97.31 97.34
Pulping
Liquor 0.000 89.1 1.80x10⁻³ 3.98x10⁻⁴ 0.16 0.16
Rail Road
Ties 0.000 88.9 6.82x10⁻³ 3.41x10⁻³ 1.11 1.11
Refuse-derived fuel (RDF)
0.000 86.0 3.03x10⁻³ 5.97x10⁻⁴ 86.22 86.22
Recycled Fuel
Oil 0.000 70.1 2.84x10⁻³ 5.69x10⁻⁴ 70.36 70.36
Sludge 0.000 88.9 6.82x10⁻³ 3.41x10⁻³ 1.11 1.11
Steam
Purchases 0.086 62.9 1.18x10
-3 1.18x10⁻⁴ 62.94 63.03
Tires 0.000 81.5 3.03x10⁻² 4.08x10⁻³ 83.48 83.48
Waste Wood 0.000 88.9 6.82x10⁻³ 3.41x10⁻³ 1.11 1.11
9 The cradle-to-gate GHG emission factors for chemicals were collected from the
EcoInvent database (version 3.4, 2017) and literature as noted in Table 2.3. FisherSolve listed 46 unique chemicals, five were excluded because less than 100 metric tons were used in 2018. These chemicals have been grouped into 10 categories, by FisherSolve, based on the intended purpose and what stage of the process they were used (e.g., bleaching, pulping, and coating). There are chemicals that are listed in more than one group, in those cases FisherSolve has allocated the chemical between the two categories. The emission factor used for all starches is corn starch and for dyes the emission factor for synthetic dyes and pigments was used. Both of these chemicals vary in composition and by mill, making them challenging to track.
Table 2.3 Cradle-to-gate GHG emission factors for chemicals along with total industry use (FisherSolve, 2018) and total upstream emissions. These factors include upstream emissions from manufacturing. Does not include transportation emissions.
Chemical
Type Chemical Name
GHG Emission Factor (kg CO2eq/ kg dry basis) Total Annual Consumption (kg dry basis/
year) Total Annual GHG Emissions (kg CO2eq/ year) Reference Bleaching
Chlorine 1.07 5.88 x10⁶ 6.29 x10⁶
(Wernet et al., 2016) Hydrogen peroxide 1.18 1.19 x10⁸ 1.40 x10⁸
Methyl alcohol 0.18 2.94x10⁷ 5.28 x10⁶
Oxygen 0.11 3.42 x10⁸ 3.76 x10⁷
Ozone 6.52 2.77 x10⁶
10 Table 2.3 (continued).
Pulping
Ammonium 2.89 5.97 x10⁷ 1.72 x10⁸
(Wernet et al., 2016) Calcium carbonate 1.45 6.41 x10⁸ 9.30 x10⁸
Caustic soda 1.35 4.46 x10⁸ 6.02 x10⁸
Lime 1.14 4.07 x10⁸ 4.64 x10⁸
Magnesium sulfate 0.24 3.44 x10⁷ 8.25 x10⁶ Sodium carbonate 0.52 1.15 x10⁸ 5.99 x10⁷ Sodium sulfate 0.51 9.35 x10⁷ 4.81 x10⁷ Sodium sulfite 1.50 2.46 x10⁷ 3.69 x10⁷ Sodium sulfide 3.04 4.55 x10⁷ 1.38 x10⁸
Sulfur 0.23 1.69 x10⁷ 3.88 x10⁶
Pigment Filler
Clay 0.001 1.09 x10⁵ 1.09 x10²
(Wernet et al., 2016)
GCC 0.02 7.52 x10⁴ 1.65 x10³
PCC 0.32 5.25 x10⁵ 1.69 x10⁵
Talc 0.01 5.04 x101 5.04 x10⁻¹
(U. S. Environmental
Protection Agency, 1995) Titanium Dioxide 4.60 1.28 x10⁴ 5.88 x10⁴ (Wernet et al., 2016)
Pigment Coating
Clay 0.001 5.24 x10⁵ 5.24 x10²
(Wernet et al., 2016)
GCC 0.02 2.67 x10⁵ 5.88 x10³
PCC 0.32 4.36 x10⁴ 1.40 x10⁴
Synthetic Pigments 0.78 3.31 x10³ 2.59 x10³
(National Renewable
Energy Labratory,
2015) Titanium Dioxide 4.60 1.10 x10⁴ 5.06 x10⁴ (Wernet et al., 2016) Pulping
Mineral
Talc 0.01 2.17 x10⁵ 2.17 x10³
(U. S. Environmental
Protection Agency, 1995)
Wet End
Alkaline Size 3.50 4.00 x10⁷ 1.40 x10⁸ (Triantou, 2009)
Alum 0.57 2.62 x10⁸ 1.48 x10⁸
(Wernet et al., 2016) Retention Aid PAM 2.78 1.01 x10⁷ 2.80 x10⁷
Rosin Size 1.63 2.38 x10⁷ 3.88 x10⁷
11 Table 2.3 (continued).
Paper Dyes
Dyes 0.78 4.13 x10⁶
3.23 x10⁶
(National Renewable
Energy Labratory,
2015)
Dyes FWA 0.78 3.75 x10⁷ 2.93 x10⁷
Paper Other
Creping Aid 2.06 1.43 x10⁷ 2.95 x10⁷
(Wernet et al., 2016) Dry Strength 1.84 1.71 x10⁷ 3.15 x10⁷
Wet Strength 2.29 6.10 x10⁶
1.40 x10⁷ Paper
Coating
Coating Starch 0.97 6.76 x10⁷ 6.56 x10⁷
(Wernet et al., 2016)
Latex 2.62 1.72 x10⁸ 4.52 x10⁸
Size Press Starch 0.97 7.65 x10⁸ 7.42 x10⁸
Recycling Deinked Chemicals 0.87 2.08 x10⁶ 1.82 x10⁶ (Wernet et al., 2016)
Pulp and paper mills obtain their fibers from four main sources; logs, wood chips, pre-made market pulps, and recovered paper materials. Logs and chips are considered as wood fibers and their emission factors are shown in Table 2.4. These emissions factors reflect only upstream emissions from wood procurement, including forest cultivation and harvest activities.
Transportation is not included. Emissions from purchased pulps are assumed to be accounted only in the Market Pulp category. Any recovered fiber was assumed be burden free, as it is a waste product, and the only associated emissions are from transportation.
Table 2.4 GHG emission factors and total annual consumption of wood from 2018 data (FisherSolve, 2018; National Renewable Energy Labratory, 2015). These emissions factors reflect only upstream emissions from wood procurement. Transportation is not included.
Wood Type
GHG Emission Factor (kg CO2eq/ kg dry
basis)
Total Annual Consumption (Metric tons, dry
basis)
Total Annual
GHG Emissions (kg CO2 eq/
year)
Northern hardwood chips 0.22 7.90 x10⁵ 3.51 x10⁷
Northern hardwood logs 0.05 7.49 x10⁴ 1.67 x10⁷
Northern softwood chips 0.22 6.33 x10⁴ 2.17 x10⁹
Northern softwood logs 0.05 1.62 x10⁵ 2.20 x10⁸
Northern softwood sawdust 0.12 1.29 x10⁵ 3.13 x10⁸
12 Table 2.4 (continued).
Southern hardwood logs 0.05 6.82 x10⁵ 6.51 x10⁴
Southern softwood chips 0.09 6.25 x10⁵ 3.62 x10⁴
Southern softwood logs 0.05 1.69 x10⁵ 1.14 x10⁴
Transportation emissions are considered for fuels, chemicals, and fibers from the suppliers to the mill. The estimated distances and transportation methods are collected from the 2012 US Census Bureau's Commodity Flow Survey and are shown in table 2.5 (US Census Bureau, 2015). This survey provides an average distance a commodity is transported for various transportation methods along with a percent by weight break down showing the fraction traveled by each transportation method. For fuel oils and other petroleum fuels, the total percent from land, water, and air travel does not add up to 100 because a fraction of these products are transported by pipeline. The fugitive emissions and emissions related to pumps are difficult to track and could be low compared to the other transportation methods. Thus, pipeline emissions were not considered in this study.
13 Table 2.5 Distances and transportation method percent related to materials consumed (US
Census Bureau). Commodity Type Total Average Distance (km) Truck (km) Truck % by Weight Rail (km) Rail % by Weight Water (km) Water % by Weight Air (km) Air % by Weight
Coal 140 93 18% 922 68% 548 6% 0 0%
Fuel oils 50 48 54% 1232 1% 0 0% 0 0%
Other petroleum fuels
158 122 68% 1419 13% 288 12% 0 0%
Chemicals 1065 216 54% 674 26% 562 13% 1034 0.1%
Logs and wood
296 165 98% 1568 2% 0 0% 0 0%
Pulp 420 261 78% 1502 22% 0 0% 0 0%
Waste and Scrap
194 240 60% 502 25% 453 14% 0 0%
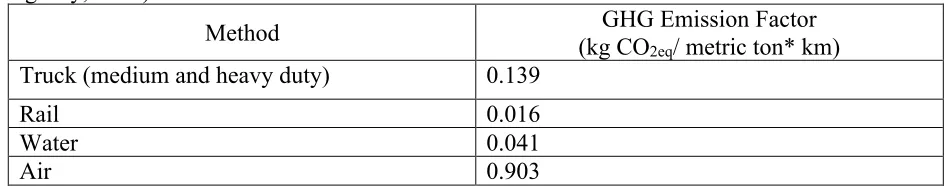
* Percent’s may not add up to 100 due to rounding errors or because a pipeline was used. Table 2.6 GHG emission factors for transportation methods (U. S. Environmental Protection Agency, 2018).
Method (kg COGHG Emission Factor
2eq/ metric ton* km) Truck (medium and heavy duty) 0.139
Rail 0.016
Water 0.041
Air 0.903
14 CHAPTER 3
RESULTS & DISCUSSION Overall
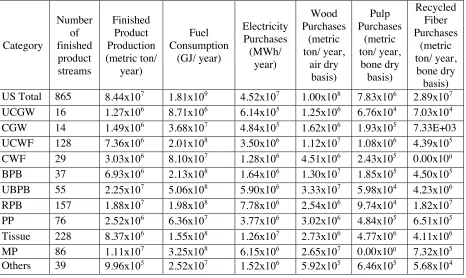
This study analyzed the data from 865 product streams in the US and summarized annual energy consumption, raw material purchase, and production in Table 3.1. The results of GHG emissions by product categories and sources are provided in Table 3.2. The results estimates that the US pulp and paper industry produced 84.4 million metric tons of product and emitted 79.5 million tons of CO2eq. Table 3.2 shows 40 million tons CO2eq of on-site GHG emissions/year from fuel combustion that is close to the data from EPA (34 million tons CO2eq/year in 2017), which validates the results of this study.
Table 3.1 Annual production, energy consumption, and raw material purchase of the U.S. pulp and paper industry by product grades (FisherSolve, 2018).
Category Number of finished product streams Finished Product Production (metric ton/ year) Fuel Consumption (GJ/ year) Electricity Purchases (MWh/ year) Wood Purchases (metric ton/ year, air dry basis) Pulp Purchases (metric ton/ year, bone dry basis) Recycled Fiber Purchases (metric ton/ year, bone dry basis) US Total 865 8.44x10⁷ 1.81x10⁹ 4.52x10⁷ 1.00x10⁸ 7.83x10⁶ 2.89x10⁷ UCGW 16 1.27x10⁶ 8.71x10⁶ 6.14x10⁵ 1.25x10⁶ 6.76x10⁴ 7.03x10⁴ CGW 14 1.49x10⁶ 3.68x10⁷ 4.84x10⁵ 1.62x10⁶ 1.93x10⁵ 7.33E+03 UCWF 128 7.36x10⁶ 2.01x10⁸ 3.50x10⁶ 1.12x10⁷ 1.08x10⁶ 4.39x10⁵ CWF 29 3.03x10⁶ 8.10x10⁷ 1.28x10⁶ 4.51x10⁶ 2.43x10⁵ 0.00x100
BPB 37 6.93x10⁶ 2.13x10⁸ 1.64x10⁶ 1.30x10⁷ 1.85x10⁵ 4.50x10⁵ UBPB 55 2.25x10⁷ 5.06x10⁸ 5.90x10⁶ 3.33x10⁷ 5.98x10⁴ 4.23x10⁶ RPB 157 1.88x10⁷ 1.98x10⁸ 7.78x10⁶ 2.54x10⁶ 9.74x10⁴ 1.82x10⁷ PP 76 2.52x10⁶ 6.36x10⁷ 3.77x10⁶ 3.02x10⁶ 4.84x10⁵ 6.51x10⁵ Tissue 228 8.37x10⁶ 1.55x10⁸ 1.26x10⁷ 2.73x10⁶ 4.77x10⁶ 4.11x10⁶ MP 86 1.11x10⁷ 3.25x10⁸ 6.15x10⁶ 2.65x10⁷ 0.00x100 7.32x10⁵
15 Table 3.2 Annual GHG emissions of the U.S. pulp and paper industry by product grades and sources.
Categories
Total GHG emissions
Total GHG Emissions from:
Total biogenic
CO2
emissions from fuel (kg CO2/
year) Fuel s El ec tr ic it y Pur chas es Wo od , ups tr eam Ch em ic al s, ups tr eam Tr an sp or ta ti on
(kg CO2eq/ year)
US Total 7.95x10¹⁰ 4.00x10¹⁰ 1.88x10¹⁰ 8.17x10⁹ 5.02x10⁹ 7.44x10⁹ 1.04x10¹¹ UCGW 7.70x10⁸ 2.87x10⁸ 2.12x10⁸ 1.44x10⁸ 5.66x10⁷ 6.97x10⁷ 3.43x10⁸ CGW 2.25x10⁹ 1.64x10⁹ 2.28x10⁸ 1.15x10⁸ 1.56x10⁸ 1.05x10⁸ 1.28x10⁹ UCWF 8.46x10⁹ 4.80x10⁹ 1.33x10⁹ 8.46x10⁸ 7.52x10⁸ 7.28x10⁸ 1.14x10¹⁰ CWF 3.21x10⁹ 1.55x10⁹ 6.00x10⁸ 3.94x10⁸ 3.98x10⁸ 2.65x10⁸ 5.31x10⁹ BPB 5.94x10⁹ 2.88x10⁹ 5.89x10⁸ 1.05x10⁹ 6.62x10⁸ 7.56x10⁸ 1.48x10¹⁰ UBPB 1.60x10¹⁰ 7.98x10⁹ 2.50x10⁹ 2.58x10⁹ 9.68x10⁸ 2.01x10⁹ 3.40x10¹⁰ RPB 1.30x10¹⁰ 7.93x10⁹ 3.31x10⁹ 2.62x10⁸ 4.76x10⁸ 1.04x10⁹ 4.80x10⁹ PP 3.93x10⁹ 1.81x10⁹ 1.43x10⁹ 3.22x10⁸ 1.36x10⁸ 2.34x10⁸ 3.31x10⁹ Tissue 1.44x10¹⁰ 7.41x10⁹ 5.71x10⁹ 3.28x10⁸ 2.16x10⁸ 7.28x10⁸ 2.88x10⁹ MP 9.51x10⁹ 2.68x10⁹ 2.24x10⁹ 2.07x10⁹ 1.13x10⁹ 1.34x10⁹ 2.51x10¹⁰ Others 1.97x10⁹ 1.06x10⁹ 6.64x10⁸ 6.02x10⁷ 7.47x10⁷ 1.13x10⁸ 7.82x10⁸
16 study used bottom-up approach to calculate GHG emissions based on 2018 data of mill-specific fuels and chemicals, while the previous study used 2017 EPA’s GHG emission data of each mill in the U.S. In addition, Nabinger et al. used the production data of five major paper grades, while this study used the data for eleven paper grades with a higher-resolution.
Table 3.3. also shows the biogenic CO2 intensity for different paper products. As mentioned earlier, biogenic CO2 is generally considered to have zero impact on climate change as it can be taken back into new growth of biomass. However, previous studies indicated that the impacts of biogenic carbon from burning wood-based fuels are time-dependent (Repo et al., 2015; Zanchi et al., 2012). In this study, although carbon sequestration by forest is not
considered due to the lack of data, biogenic CO2 is separately tracked and can be used for future dynamic carbon accounting analysis.
In general, biogenic CO2 emissionsare greater than total emissions from all other sources. The two categories with the highest biogenic CO2 intensity, as shown in Table 3.3, are Market Pulp (MP) and Bleached Paperboard (BPB). This is due to the high consumption of bio-based fuels such as wood, pulping liquor, biogas, and sludge. The chemical recovery process is responsible for bringing in a majority of the energy a mill needs. MP and BPB also have the highest GHGI from wood procurement, which further explains the high levels of biogenic CO2.
The product categories with the lowest biogenic CO2 intensities are Recycled Paperboard (RPB) and Uncoated Ground Wood (UCGW). RPB also has the lowest GHGI from wood
17 Table 3.3 GHG intensities for all US pulp and paper product categories.
Categories GHG Intensity Biogenic CO2 Intensity (kg CO2/ metric ton product) To ta l Fuel El ec tr ic ity Pur chas es Wo od , ups tr eam Ch em ic al s, ups tr eam Tr an sp or ta tio n
(kg CO2eq/ metric ton product)
US Total 942 474 223 97 60 88 1232
UCGW 608 227 168 114 45 55 271
CGW 1511 1105 154 77 105 70 864
UCWF 1148 651 181 115 102 99 1552
CWF 1057 511 198 130 131 88 1749
BPB 857 416 85 151 96 109 2131
UBPB 714 355 111 115 43 89 1515
RPB 691 421 176 14 25 55 255
PP 1559 718 567 127 54 93 1313
Tissue 1720 886 682 39 26 87 344
MP 855 241 202 186 101 125 2253
Others 1978 1063 667 60 75 114 785
Given the large quantity of GHG emissions from the pulp and paper industry, carbon capture could be a promising technology to reduce industry-wide GHG emissions. Many studies evaluated the technical and economic feasibility of carbon capture applications in other
industries. For example, Yao et al. concluded that US refineries could reduce CO2 emissions by 62-71% with the application of carbon capture technologies (Yao et al., 2018). Both technology and infrastructure, however, need further development and research to lower the cost and
18 Figure 3.1 Greenhouse gas intensities for each paper category broken down by source. Biogenic CO2 is from bio-based fuels only.
Among different product categories, the source of emissions varies as observed in Figure 3.1. “Fuel” (blue bar) include GHG emissions from burning fossil fuels and non-CO2 emissions from biogenic fuels. Biogenic CO2 is separately shown (green bar) given their potential to be sequestrated by forest. Even when biogenic CO2 is excluded, fuels are consistently the greatest source of GHG emissions, with electricity a close second. Transportation, while a small GHG contributor, is the most consistent in GHGI between all categories. This suggests that
transportation emissions may be out of the control of the mill without great efforts in local sourcing.
Fuels
19 While FisherSolve reports the US Pulp and Paper industry using 18 different types of fuels (FisherSolve, 2018), coal and natural gas are the most impactful of the fuels for all
categories, as reflected in Table 3.4 and Figure 3.2. This is likely due to the availability of these two fossil fuels and their low cost, as shown in in Figure 3.3. In general, renewable energy provides over half of the energy demand while only contributing less than 10% of GHG emissions (when excluding biogenic CO2).
Table 3.4 Summary of total annual energy consumed by the US Pulp and Paper industry for all fuel types.
Fuel Total
Consumption (GJ/ year)
Total GHG Emissions (kg CO2eq/ year)
% of Total Energy Provided
% of Total Fuel Emissions Produced
Biodiesel 1.25x10⁵ 7.60E+03 0.007% 0.000%
Biogas 9.14x10⁴ 2.87x10⁵ 0.005% 0.001%
Compressed Natural
Gas (CNG) 1.83x10⁶
9.19x10⁷ 0.101% 0.226%
Coal 1.14x10⁸ 1.10x10¹⁰ 6.31% 27.1%
Natural Gas 4.37x10⁸ 2.20x10¹⁰ 24.1% 54.1%
Liquefied Natural Gas
(LNG) 2.02x10⁶
1.02x10⁸ 0.111% 0.250%
Methanol 1.01x10⁵ 4.48E+02 0.006% 0.000%
Number 2 Oil 7.22x10⁶ 5.08x10⁸ 0.398% 1.24%
Number 6 Oil 7.70x10⁶ 5.50x10⁸ 0.424% 1.35%
Petcoke 1.77x10⁷ 1.73x10⁹ 0.978% 4.24%
Pulping Liquor 7.97x10⁸ 1.27x10⁸ 43.9% 0.312%
Rail Road Ties 8.81x10⁵ 9.77x10⁵ 0.049% 0.002%
Refuse-derived
fuel (RDF) 2.93x10⁶
2.52x10⁸ 0.161% 0.620% Recycled Fuel Oil 5.85x10⁵ 4.12x10⁷ 0.032% 0.101%
Sludge 5.69x10⁵ 6.31x10⁵ 0.031% 0.002%
Steam 3.76x10⁷ 2.37x10⁹ 2.07% 5.82%
Tires 1.74x10⁷ 1.46x10⁹ 0.961% 3.57%
Waste Wood 3.69x10⁸ 4.09x10⁸ 20.3% 1.00%
20 accounts for 0.3% of fuel-related GHG emissions excluding biogenic CO2. Waste wood, as the third largest fuel source, shows a similar trend, providing 20% of energy needs and 1% of GHG emissions. Other bio-based fuels are much smaller in energy contributions, >0.1%, likely due to availability.
Figure 3.2 Fuel GHG intensity for each paper category broken down by source.
Figure 3.2 shows the GHG intensity of each paper grades by emission sources excluding biogenic CO2. As seen in figure 3.2, coal and natural gas are major fuel types for most
categories. This is likely due to their availability and low cost. The EIA reports that coal consumption in the US is declining, while natural gas consumption is on the rise (EIA, 2017, 2019). If this trend continues, mills may need to switch their fuel source. Since conversion from a solid fuel to a gaseous one may have a high capital cost, alternative fuels may be considered.
21 use more fuel and electricity to meet their energy needs. A potential GHG emissions and cost saving strategy is fuel switching, particularly from fossil base to bio-based fuels. Figure 3.3 shows the relationship between cost, on a heating unit basis, and GHGI of common fuels already used by the US pulp and paper industry. The size of the bubble represents relative annual use of fuels. All bio-based fuels have a much lower GHGI than fossil fuels while also having similar if not lower prices. The lowest price fuels, pulping liquor and sludge, are by-products that are limited in availably. Waste wood is an option for most mills and can even be co-fired with coal (Morrison & Golden, 2017).
Figure 3.3 Emission intensity and cost comparison for various fuels used in the US pulp and paper industry.
Electricity
Electricity purchased from the grid is assumed to come from the state the mill is located in. In most cases, fuel is preferred over electricity, but electricity is a convenient way to
22 buy only pulp and do not have a chemical recovery loop to recover steam. This increases the need of electricity or other fuels. This shows in Figure 3.1 as tissue has the highest level of emissions from electricity.
In Figure 3.4 the total MWh consumed in each state is also labeled. States with no pulp or paper mill data have been labeled with ‘-‘, Alaska and Hawaii (not shown) also have no data. States with 0 GWh do not have a significant amount of electricity purchases.
Electricity emissions vary by state and it is impractical to move a mill. However, mills in States with high electricity emissions, shown in a bright red in Figure 3.4, may consider
combusting additional, low emission fuels to meet their energy needs using turbine generators. Conversely, mills in states with low emission electricity, shown in a dark green in Figure 3.4, may not find a need to reduce electricity purchases.
23 Given the large impacts of fuels and electricity use on the GHGI of pulp and paper
products, improving energy efficiency is a direction that has been explored by both industry and academia for many years (Fleiter et al., 2012; Miller et al., 2015). Many opportunities have been identified by the industry, but the potential of those technologies in reducing GHG emissions and how they could be adopted by the industry still needs more efforts in analysis, research, and development.
Chemicals
Each process of paper making has its own set of unique chemicals and each mill uses a different composition to best suit their needs. In general, however, four main categories of chemicals are responsible for the majority of GHG emissions; bleaching, coating, pulping, and wet end. These categories are shown in Figure 3.5. Only upstream emissions from the production of each chemical is included. See table 2.3 for chemicals included in each type.
As can be seen in Table 3.2 and Figure 3.1, the more wood a mill takes in, rather than pulp or recycled fibers, the more chemicals the mill consumes. This trend can be more clearly seen in market pulp, which has the highest GHGI from pulping chemicals, as seen in Figure 3.5, and the highest GHGI from wood procurement, as seen in Figure 3.6. Recycled paperboard (RPB) shows the inverse, as it is mostly taking in recycled materials to convert to product and thus needs fewer pulping chemicals. However, some RPB mills supplement their feeds with other fiber sources, explaining the pulping chemicals.
24 stream was labeled as ‘offset paper’ by FisherSolve the TAPPI TIPS classifications mark this product as belonging to both coated and uncoated wood free (Wedel et al., 2013). This example was assumed to all belong to the uncoated wood free category, due to insufficient confidence to sort individual product lines based on the chemicals used.
Figure 3.5 Chemical greenhouse gas intensities for each paper category broken down by chemical type. Only upstream emissions from the production of each chemical is included. See table 2.3 for chemicals included in each type.
25 Wood
The emissions factors for wood procurement, as shown in Table 2.4 vary by wood type and delivered form (chips or logs). As expected, Figure 3.6 shows that RPB has the lowest GHGI in this case as a vast majority of the fiber is recovered that was assumed to be burden free. As mentioned in the previous section, RPB may supplement feeds with wood to enhance physical properties, which explains the presence of wood fiber. Tissue also has a low GHGI in Figure 3.6 as a majority of tissue mills purchase pulp as feedstock and the GHG emissions of pulp were not included in the tissue category but in MP to avoid double accounting. Including the GHG
emissions from MP, the GHGI of tissue will be the highest given that market pulp has the highest in Figure 3.6 as it takes in the most wood to produce pulp.
Figure 3.6 Greenhouse gas intensity from wood procurement, logs and chips, for each product category.
Transportation
26 Figure 3.7 GHG intensity from transportation of fuels, chemicals, and fibers.
The emissions factors for transportation methods is given in kg CO2eq/ metric ton*km, making the total emissions dependent on the weight and distance a material travels. This explains why fiber emissions are so high, and chemical so low, despite the lower average distance
traveled for wood fibers versus chemicals, as shown in Table 2.5. Distributions of GHGI Results
All previous results and discussions refer to the weighted average for each paper category. To understand the variations of GHG emissions for each paper category, the
distributions of GHGI for all mills are plotted in Figure 3.7. The height of the bar represents the total metric tons that fall into the respective GHGI. Product lines with GHGI’s higher than 500 kg CO2eq/ metric ton were excluded from Figure 3.7 (<10% of production) for a better
readability, however these are included in the statistical summary in Table 3.5.
0 20 40 60 80 100 120 140
UCGW CGW UCWF CWF BPB UBPB RPB PP Tissue MP Others
kg C
O
2e
q/
m
et
ric
to
n p
ro
du
ct
Fuels
Chemicals
27 The ranges, averages, and standard deviations are summarized in Table 3.5 that the average is not weighted.
28 Table 3.5 Statistical summary for GHGI of each category.
Category Minimum Maximum Average Standard Deviation kg CO2eq/ metric ton product
UCGW 30 239 106 55
CGW 24 98 60 23
UCWF 11 1805 91 198
CWF 14 149 51 31
BPB 9 1928 83 308
UBPB 7 125 36 22
RPB 3 3778 306 609
PP 13 4193 238 583
Tissue 2 3631 203 469
MP 11 1052 67 144
Others 14 1702 189 323
The goal of these distributions is to show how varied individual product lines are within a category. If all of the production lines within the same paper category have similar GHGI’s, or say narrow distribution of GHGIs, then it is a sign that those types of products are made with similar methods and either have little room or incentive for emissions improvements. On the other hand, a widely spread GHGI range indicates either a large variety of products represented or significant differences of manufacturing technologies.
29 CHAPTER 4
CONCLUSIONS
This thesis calculated that on average, a metric ton of pulp or paper product in the US creates 942 kg CO2eq of GHG emissions. This number varies from 608-1978 kg CO2eq/ metric ton for different types of products and the variations are mainly due to differences in fuel and material use structure.
The pulp and paper industry generate significant biogenic CO2 given the intensive use of biomass-based fuels. Excluding biogenic CO2, the greatest contributor to the cradle-to-gate GHG emissions was fossil fuels, causing 50% of the industry’s emissions. These emissions can be reduced through fuel switching, replacing fossil based with bio-based, or carbon capture. Techno-Economic analysis for fuel switching or carbon capture should be done to further explore these opportunities. Energy efficiency should also be considered as a GHG reduction strategy to reduce the reliance on fossil fuels, as encouraged by the 5th Assessment Report by the IPCC and other case studies (Fleiter et al., 2012; K. Möllersten et al., 2003; Myhre et al., 2013).
Another major contributor to GHG emissions is electricity. GHG emissions from electricity generation are subject to mill locations that may be challenging to change. Mills in high emission electricity states could consider increasing biomass fuels to increase energy self-sufficiency.
30 To gain a better insight on the effects of recycled fibers, a cradle-to-grave study could be a future work with a consideration of the emissions related to fiber sorting versus landfilling.
This research calculated that 11% of the US pulp and paper industries emissions were from transportation of materials to the mill. The GHGI from transportation was relatively
constant between categories, suggesting that this emission source is limited in reduction potential without transportation infrastructure changes, for example electric vehicles.
31 REFERENCES
Bureau, U. S. C. (2015). United States : 2012. (February). EIA. (2017). Annual Coal Report 2017.
EIA. (2019). Natural Gas Consumption by End Use. Retrieved from https://www.eia.gov/dnav/ng/ng_cons_sum_dcu_nus_m.htm EPA. (2017). Greenhouse Gas Reporting Program Dataset.
Fischedick M., J. Roy, A. Abdel-Aziz, A. Acquaye, J.M. Allwood, J.-P. Ceron, Y. Geng, H. Kheshgi, A. Lanza, D. Perczyk, L. P., & E. Santalla, C. Sheinbaum, K. T. (2014). Climate Change 2014: Mitigation of Climate Change. Contribution of Working Group III to the Fifth Assessment Report of the Intergovernmental Panel on Climate Change.
FisherSolve. (2018). Retrieved from https://www.fisheri.com/
Fleiter, T., Fehrenbach, D., Worrell, E., & Eichhammer, W. (2012). Energy efficiency in the German pulp and paper industry – A model-based assessment of saving potentials. Energy, 40(1), 84–99. https://doi.org/10.1016/j.energy.2012.02.025
Gemechu, E. D., Butnar, I., Gomà-Camps, J., Pons, A., & Castells, F. (2013). A comparison of the GHG emissions caused by manufacturing tissue paper from virgin pulp or recycled waste paper. International Journal of Life Cycle Assessment, 18(8), 1618–1628. https://doi.org/10.1007/s11367-013-0597-x
Jönsson, J., & Berntsson, T. (2012). Analysing the potential for implementation of CCS within the European pulp and paper industry. Energy, 44(1), 641–648.
32 Lindmark, M., Bergquist, A.-K., & Andersson, L. F. (2011). Energy transition, carbon dioxide
reduction and output growth in the Swedish pulp and paper industry: 1973–2006. Energy Policy, 39(9), 5449–5456. https://doi.org/10.1016/j.enpol.2011.05.018
Ma, X., Shen, X., Qi, C., Ye, L., Yang, D., & Hong, J. (2018). Energy and carbon coupled water footprint analysis for Kraft wood pulp paper production. Renewable and Sustainable Energy Reviews, 96(August), 253–261. https://doi.org/10.1016/j.rser.2018.07.054
Miller, T., Kramer, C., & Fisher, A. (2015). Bandwidth Study on Energy Use and Potential Energy Saving Opportunities in US Pulp and Paper Manufacturing.
Möllersten, K., Yan, J., & Westermark, M. (2003). Potential and cost-effectiveness of CO2 reductions through energy measures in Swedish pulp and paper mills. Energy, 28(7), 691– 710. https://doi.org/10.1016/S0360-5442(03)00002-1
Möllersten, Kenneth, Gao, L., & Yan, J. (2006). CO2 Capture in Pulp and Paper Mills: CO2 Balances and Preliminary Cost Assessment. Mitigation and Adaptation Strategies for Global Change, 11(5–6), 1129–1150. https://doi.org/10.1007/s11027-006-9026-9
Morrison, B., & Golden, J. S. (2017). Life cycle assessment of co-firing coal and wood pellets in the Southeastern United States. Journal of Cleaner Production, 150, 188–196.
https://doi.org/10.1016/j.jclepro.2017.03.026
33 Nabinger, A., Tomberlin, K., Venditti, R., & Yao, Y. (2019). Using a Data-Mining Approach to
Unveil Greenhouse Gas Emission Intensities of Different Pulp and Paper Products. 26th CIRP Life Cycle Engineering (LCE) Conference.
National Renewable Energy Labratory. (2015). U.S. Life Cycle Inventory Database. Retrieved from U.S. Life Cycle Inventory Database website:
https://www.lcacommons.gov/nrel/search
Onarheim, K., Santos, S., Kangas, P., & Hankalin, V. (2017). Performance and cost of CCS in the pulp and paper industry part 2: Economic feasibility of amine-based post-combustion CO 2 capture. International Journal of Greenhouse Gas Control, 66, 60–75.
https://doi.org/10.1016/j.ijggc.2017.09.010
Repo, A., Tuovinen, J.-P., & Liski, J. (2015). Can we produce carbon and climate neutral forest bioenergy? GCB Bioenergy, 7(2), 253–262. https://doi.org/10.1111/gcbb.12134
RISI. (2018). Fastmarkets RISI Annual Review 2018.
Stevenson, M., Lesage, P., & Phenicie, D. (2011). Printing & Writing Papers Life-Cycle Assessment Summary Report. The American Forest & Paper Association, 24. Retrieved from http://www.afandpa.org/docs/default-source/default-document-library/printing-and-writing-lca-report.pdf?sfvrsn=0
Sun, M., Wang, Y., Shi, L., & Klemeš, J. J. (2018). Uncovering energy use, carbon emissions and environmental burdens of pulp and paper industry: A systematic review and meta-analysis. Renewable and Sustainable Energy Reviews, 92, 823–833.
34 Szabó, L., Soria, A., Forsström, J., Keränen, J. T., & Hytönen, E. (2009). A world model of the
pulp and paper industry: Demand, energy consumption and emission scenarios to 2030. Environmental Science & Policy, 12(3), 257–269.
https://doi.org/10.1016/j.envsci.2009.01.011
Triantou, A.-D. (2009). Carbon, Energy and Water Footprint of Three AkzoNobel Internal Sizing Chemicals: A Cradle to Gate LCA Related Study. Skolan för industriell teknik och
management.
U. S. Environmental Protection Agency. (1995). Compilation of Air Pollutant Emission Factors, Publication AP-42.
U. S. Environmental Protection Agency. (2018). Emission Factors for Greenhouse Gas Inventories. 1–5. Retrieved from
https://www.ecfr.gov/cgi-bin/text-idx?SID=ae265d7d6f98ec86fcd8640b9793a3f6&mc=true&node=pt40.23.98&rgn=div5#ap 40.23.98_19.1
U.S. Energy Information Administration (EIA). (2014). Manufacturing Energy Consumption Survey.
Wang, Y., Yang, X., Sun, M., Ma, L., Li, X., & Shi, L. (2016). Estimating carbon emissions from the pulp and paper industry: A case study. Applied Energy, 184, 779–789.
https://doi.org/10.1016/j.apenergy.2016.05.026
Wedel, G. L., Xu, J., & Shands, J. (2013). TIP 0404-36. TAPPI, 1–23.
35 Yao, Y., Marano, J., Morrow, W. R., & Masanet, E. (2018). Quantifying carbon capture potential
and cost of carbon capture technology application in the U.S. refining industry. International Journal of Greenhouse Gas Control, 74(April), 87–98.
https://doi.org/10.1016/j.ijggc.2018.04.020
Zabaniotou, A., & Kassidi, E. (2003). Life cycle assessment applied to egg packaging made from polystyrene and recycled paper. Journal of Cleaner Production, 11(5), 549–559.
https://doi.org/10.1016/S0959-6526(02)00076-8