| INVESTIGATION
An Evolving Genetic Architecture Interacts with
Hill
–
Robertson Interference to Determine the
Bene
fi
t of Sex
Alexander O. B. Whitlock,* Kayla M. Peck,†Ricardo B. R. Azevedo,‡and Christina L. Burch†,1
*Curriculum in Genetics and Molecular Biology and†Biology Department, University of North Carolina, Chapel Hill, North Carolina 27599-3820, and‡Department of Biology and Biochemistry, University of Houston, Houston, Texas 77204-5001 ORCID IDs: 0000-0002-2717-0590 (A.O.B.W.); 0000-0001-7745-6995 (K.M.P.); 0000-0001-5402-7071 (R.B.R.A.); 0000-0001-7830-0124 (C.L.B.)
ABSTRACTSex is ubiquitous in the natural world, but the nature of its benefits remains controversial. Previous studies have suggested that a major advantage of sex is its ability to eliminate interference between selection on linked mutations, a phenomenon known as Hill– Robertson interference. However, those studies may have missed both important advantages and important disadvantages of sexual reproduction because they did not allow the distributions of mutational effects and interactions (i.e., the genetic architecture) to evolve. Here we investigate how Hill–Robertson interference interacts with an evolving genetic architecture to affect the evolutionary origin and maintenance of sex by simulating evolution in populations of artificial gene networks. We observed a long-term advantage of sex— equilibrium meanfitness of sexual populations exceeded that of asexual populations—that did not depend on population size. We also observed a short-term advantage of sex—sexual modifier mutations readily invaded asexual populations—that increased with population size, as was observed in previous studies. We show that the long- and short-term advantages of sex were both determined by differences between sexual and asexual populations in the evolutionary dynamics of two properties of the genetic architecture: the deleterious mutation rate (Ud) and recombination load (LR). These differences resulted from a combination of selection to minimizeLR;which is experienced only by sexuals, and Hill–Robertson interference experienced primarily by asexuals. In contrast to the previous studies, in which Hill–Robertson interference had only a direct impact on thefitness advantages of sex, the impact of Hill–Robertson interference in our simulations was mediated additionally by an indirect impact on the efficiency with which selection acted to reduceUd:
KEYWORDSevolution of sex; gene network; deleterious mutation rate; recombination load; population size
T
HE vast majority of organisms alive today have experi-enced some form of genetic exchange, or sex, in their re-cent evolutionary history, despite substantial costs (Weismann 1887; Maynard Smith 1978; Bell 1982; Otto and Lenormand 2002). Sex breaks up favorable genetic combinations and increases the risk of transmission of pathogens and selfish genetic elements. Sexual reproduction is often slower than asexual reproduction. In many sexually reproducing eukary-otes, sex involves costs offinding and attracting a mate and of mating in itself; in anisogamous species, if one sex contrib-utes little to progeny production, sexual reproduction carriesa twofold cost of producing that sex. The ubiquity of sex implies that it must confer considerable benefits to overcome these costs. However, the nature of these benefits is not well understood. In fact,.20 hypotheses have been proposed to explain the benefits of sex (Bell 1982; Kondrashov 1993; Hurst and Peck 1996; Otto and Lenormand 2002). While hypotheses predicting direct benefits exist [e.g., improved DNA repair (Bernstein et al.1985)], the main benefits of sex are believed to be indirect, such as increased evolvabil-ity (Weismann 1887; Maynard Smith 1978; Bell 1982; Kondrashov 1993; Burt 2000; Otto and Lenormand 2002).
Indirect benefits of sex result from the ability of recombi-nation to break down the linkage disequilibrium (LD) gener-ated by mutation, genetic drift, and natural selection. If LD is predominantly negative, that is, if genotypes with the highest and lowest fitness are underrepresented in the population, then recombination can generate these extreme genotypes and increase the efficiency of natural selection (Otto and Copyright © 2016 by the Genetics Society of America
doi: 10.1534/genetics.116.186916
Manuscript received January 10, 2016; accepted for publication April 6, 2016; published Early Online April 19, 2016.
Supplemental material is available online atwww.genetics.org/lookup/suppl/doi:10. 1534/genetics.116.186916/-/DC1.
1Corresponding author: Biology Department, University of North Carolina, Chapel Hill,
Lenormand 2002). In the absence of recombination, negative LD can accumulate in a population either through the action of natural selection alone [red queen hypothesis (Hamilton 1980) or mutational deterministic hypothesis (Kimura and Maruyama 1966; Kondrashov 1982, 1988; Charlesworth 1990; Barton 1995; Otto and Feldman 1997)] or through the combined actions of selection and genetic drift [Hill– Rob-ertson interference (Hill and RobRob-ertson 1966; Felsenstein
1974; Comeron et al. 2008)]. Although there is evidence
supporting the existence of red queen and mutational deter-ministic benefits of sex in specific populations, the conditions required to generate these benefits are thought to be too re-strictive to provide a general explanation for the ubiquity of sex (Charlesworth 1993; Barton 1995; Otto and Feldman 1997; Otto and Nuismer 2004). In contrast, Hill–Robertson interference is thought to operate broadly (Comeron et al.
2008) and to provide strong benefits of sex (Otto and Barton 2001; Ileset al.2003; Barton and Otto 2005; Keightley and Otto 2006; Gordo and Campos 2008; Hartfieldet al.2010). Hill–Robertson interference is a phenomenon whereby, in afinite population, selection acting at one locus reduces the efficiency of selection at linked loci (Hill and Robertson 1966; Felsenstein 1974; Comeronet al.2008). It takes at least four forms. First, deleterious allelesfix stochastically—a process known as Muller’s ratchet (Muller 1964; Haigh 1978; Gordo and Charlesworth 2000). Second, selection against deleteri-ous alleles removes linked beneficial alleles from the
popu-lation as a side effect—a process known as background
selection (Charlesworthet al.1993; Charlesworth 1994; Peck 1994). Third, competition between individuals carrying in-dependent beneficial alleles slows down the spread of these beneficial alleles—a process known as the Fisher–Muller ef-fect (Fisher 1930; Muller 1932; Gerrish and Lenski 1998). Fourth, selection for beneficial alleles causes linked deleteri-ous alleles to rise in frequency in the population as a side
effect—a process known as hitchhiking (Maynard Smith
and Haigh 1974; Peck 1994). All forms of Hill–Robertson interference are strongest in asexuals, whose entire genomes are completely linked, and are weakened by sex.
The relative strengths of the benefits of sex arising from these different forms of Hill–Robertson interference are known to depend critically on population size and on the distribution of mutational effects on fitness. For example, Muller’s ratchet is strongest in small populations that often experience deleterious mutations, whereas the Fisher–Muller effect is strongest in large populations that often experience beneficial mutations. The increase in the strength of the Fisher–Muller effect betweenbeneficialmutations with pop-ulation size is intuitive because poppop-ulation size (N) affects the beneficial mutation supply rate (NUb;whereUb is the bene-ficial mutation rate).
More surprising is the recent finding from evolutionary simulations that interference betweendeleteriousmutations can, on its own, also generate a large benefit of sex that increases with population size (Otto and Barton 2001; Iles
et al.2003; Barton and Otto 2005; Keightley and Otto 2006;
Gordo and Campos 2008; Hartfieldet al.2010). Thisfinding is surprising because neither Muller’s ratchet (Muller 1964; Haigh 1978; Gordo and Charlesworth 2000) nor background selection (Hudson and Kaplan 1994, 1995) is expected to increase in strength with population size. The mechanism underlying the dependency of the benefit of sex on popula-tion size was little explored in this previous body of work and is our focus here.
Our intuition is that assumptions made in previous work on the evolution of sex—that one or more of the deleterious
mutation rate, distribution of mutation effects, and the
epi-static interactions between mutations do not evolve—
affected the magnitude and nature of the advantages of sex generated by Hill–Robertson interference in that work (e.g., Fisher 1930; Muller 1932, 1964; Hill and Robertson 1966; Felsenstein 1974; Haigh 1978; Peck 1994; Charlesworth 1994; Barton 1995; Otto and Feldman 1997; Gordo and Charlesworth 2000; Otto and Barton 2001; Ileset al.2003; Barton and Otto 2005; Keightley and Otto 2006; Gordo and
Box 1: Genetic architecture
The genetic architecture refers to the patterns of gene action and interaction that specify a given phenotype and its variational properties. The distribution of allelic and mutational effects and the patterns of pleiotropy, dom-inance, and epistasis are all determined by the underly-ing genetic architecture (Hansen 2006; Rice 2008).
In our study, we focus on two components of the genetic architecture.
Deleterious mutation rateðUdÞ
The deleterious mutation rate is determined by the mutation rateðUÞand by the distribution of the effects of mutations onfitness. The latter, in turn, is influenced by epistatic interactions between new mutations and the genetic background of an individual. Thus,Udis a prop-erty of individual organisms. The meanfitness of large populations at mutation–selection balance is expected to be
^
We2Ud
(Haldane 1937; Kimura and Maruyama 1966).
Recombination loadðLRÞ
Campos 2008; Hartfieldet al.2010). The deleterious muta-tion rate, the distribumuta-tion of mutamuta-tional effects, and the epi-static interactions between mutations are all properties of the genetic architecture (Box 1) that are known to play an impor-tant role in the indirect benefits of sex (Kondrashov 1982, 1988; Charlesworth 1990; Otto and Feldman 1997). These properties can evolve in just a few generations (Burch and Chao 2004; Montvilleet al.2005; Sanjuánet al.2007; Silanderet al.
2007). We know, from both theoretical (Poon and Otto 2000) and empirical (Silanderet al.2007) studies, that an evolving genetic architecture affects the benefits of sex in populations that are sufficiently small to be subject to Muller’s ratchet. As thefitness of asexual populations declines through operation of the ratchet, the rate of compensatory mutations increases, eventually halting the ratchet and limiting this cost of asexual-ity. We know less about how an evolving genetic architecture affects the benefit of sex in large populations.
In previous work, we studied a gene network model that explicitly incorporates an evolving genetic architecture (Wagner 1996; Siegal and Bergman 2002) and found that sex selects for a lower deleterious mutation rate, lower recombination load, and negative epistasis (Azevedo et al. 2006; Lohaus
et al.2010), three changes in the genetic architecture predicted to favor the maintenance of sex. We noted that population size affected the extent to which sexual reproduction led to an increase in mean fitness at equilibrium (the long-term advantage) and successfully invaded asexual populations (the short-term advantage), but we did not systematically explore these effects (Lohauset al.2010).
Here we build on our earlier work on the gene network model to investigate the extent to which Hill–Robertson in-terference interacts with the evolving genetic architecture to determine the advantage of sex. We compare sexual and asexual reproduction, manipulating the contribution of Hill–Robertson interference by altering population size. We look for a long-term advantage of sex by monitoring the evolution offitness and the genetic architecture as sexual and asexual populations approach equilibrium. We also look for a short-term advantage of sex by monitoring the invasion of equilibrium sexual populations by asexual mutants and vice versa. We show that both genetic architecture evolution and Hill–Robertson interference contribute to the advantages of sex in the gene network model and that the magnitudes of their relative contributions depend on population size, as expected. As population size increased, the contribution of Hill–Robertson interference to both the short- and long-term advantages of sex increased.
Materials and Methods
Our gene network model is based on a model introduced by Wagner (1994, 1996).
Genotype
A haploid genotype is modeled as a network ofngenes, each encoding a transcription factor that can, potentially, regulate
its own expression or the expression of other genes. The gene network is represented by ann3nmatrix,R;whererij2Ris the regulatory effect of the product of genejon genei.
Thus, rowiofRrepresents genei, including itscis-regulatory elements. Genes are evenly distributed on a linear
chromo-some in the same order as the rows in the R matrix
ði¼1;2;. . .;nÞ:Genes 1 andnare at a map distancelfrom
each other. Adjacent pairs of genes are at a map distance l=ðn21Þfrom each other.
Phenotype
The expression pattern of an individual is represented by the vector S; where si2S is the expression state of gene
i¼1;2;. . .;n:Expression states are discrete: a gene is either
onðsi¼ þ1Þor offðsi¼ 21Þ:
The expression pattern of an individual at timetis given by the system of difference equations
siðtþ1Þ ¼f
" Xn
j¼1
rijsjðtÞ
#
; (1)
wherefis a step function that determines how the input from the gene network controls the expression of the target gene:
fðxÞ ¼
þ1 if x$0
21 if x,0:
Starting from an initial gene expression patternSð0Þat time
t¼0;gene expression changes according to Equation 1 and is judged to reach a steady state if the following criterion is met:SðtÞ ¼Sðt21Þ:If a genotype does not achieve a gene expression steady state withint#100 time steps, it is con-sidered inviable (W¼0; see next section). If a genotype achieves a gene expression steady state withint#100 time steps, it is considered viable ðW.0Þ;and the steady-state gene expression patternS^is itsphenotype. Most random ge-notypes (see below) fail to produce a gene expression steady state (Pinhoet al.2014).
Fitness
Thefitness of a viable genotype is given by
W¼exp
2D
^
S;S_ s
; (2)
whereDðS;S9Þ ¼Pni¼1ðsi2s9iÞ2=ð4nÞmeasures the difference
between expression patterns S and S9;S^ is the phenotype corresponding to the genotype,S_is the optimal phenotype, and s.0 is inversely related to the strength of stabilizing selection.
Random genotype
A random genotype is created by generating a random gene network, R; and a random initial gene expression pattern, Sð0Þ: A random gene network is generated by randomly assigning to its rij regulatory elementsð12cÞn2 zeros and
distribution (i.e., with zero mean and unit variance), wherec
is the connectivity density of the network. Networks with more than one weakly connected component (Newman 2010) are discarded. A random initial gene expression pat-tern is generated byfilling thenentries ofSð0Þwith either21 orþ1 with equal probability.
Evolution
Evolution is simulated using an individual-based, Wright– Fisher model with constant population size, N, and non-overlapping generations. Individuals undergo a selection– reproduction–mutation life cycle. At the beginning of a
simulation, a viable random genotype is cloned N times
to found a population. The optimal phenotype is defined as the phenotype of the founder. This aspect of the envi-ronment remains constant throughout the simulation.
Reproduction:Parents for the next generation are chosen at
random, with replacement, with probability proportional to theirfitness (Equation 2). If the parent reproduces asexually, it generates a clone of itself. If two parents reproduce sexu-ally, they form a transient diploid and produce one haploid recombinant offspring. The recombinantR matrix is gener-ated by choosing one parent at random and copying thefirst row of itsRmatrix; the next row ofRis copied from the same parent except if a crossover occurs, in which case the corre-sponding row of theR matrix of the other parent is copied instead. The process repeats for each row, switching between parents each time a crossover location is encountered. For each offspring, the number of crossovers is drawn randomly from a Poisson distribution with mean 2l;where l is the genetic map length in morgans. Crossover locations are cho-sen randomly and occur between genes. No crossovers occur within the regulatory regions of a gene, maintaining each row as a completely linked locus. Unless otherwise stated, sexual reproduction occurs with free recombination [i.e.,
l=ðn21Þ ¼0:5 morgans].
Both asexually and sexually produced offspring inherit the initial pattern of gene expression,Sð0Þ;of the parents. This aspect of the environment also remains constant throughout the simulation.
Mutation:Each individual offspring acquires a random
num-ber of mutations drawn from a Poisson distribution with mean
U, the genomic mutation rate. A mutation is represented by a change to the value of one of thecn2 nonzero regulatory elementsrij;chosen at random; the mutated value is drawn randomly from a standard normal distribution. Mutation can-not create new regulatory interactions (i.e., a zero entry can-not become nonzero), but can transiently remove regulatory interactions (i.e., a nonzero entry may become approximately zero).
Reproductive mode
The reproductive mode of an individual is determined by its genotype at a modifier locus M. Unless otherwise stated, the
M locus is unlinked to the genes involved in the gene network. There are two alleles at the modifier locus:mandM. We have implemented three different genetic bases for these repro-ductive modes, described below. Under all implementations, if a population isfixed for themallele every individual re-produces asexually, and if it is fixed for theM allele every individual reproduces sexually. Thus, we refer to themandM
alleles as beingforasexual and sexual reproduction, respec-tively. In all simulations where the M locus modifies repro-ductive mode, themallele specifies no recombination (i.e.,
l¼0 morgans), and theMallele specifies free recombina-tion [i.e.,l=ðn21Þ ¼0:5 morgans].
Separate sex: The sexual and asexual subpopulations are
reproductively isolated from each other. Sexuals do not ex-perience a cost offinding mates. One individual is chosen for every reproductive event with probability proportional to its fitness. If it carries themallele, it reproduces asexually. If it carries theMallele, a second individual carrying anMallele is chosen with probability proportional to itsfitness, and the two individuals reproduce sexually and produce one recombinant offspring.
Recessive sex: Asexual individuals always reproduce
asexu-ally; sexual individuals sometimes reproduce asexually. Two individuals are chosen for every reproductive event with probability proportional to their fitness. If one or both of the individuals carries themallele, one of them reproduces asexually, regardless of its genotype at the M locus. If both individuals carry theMallele, they reproduce sexually and produce one recombinant offspring.
Dominant sex: Sexual individuals always reproduce sexually,
but they may recombine with asexual individuals. Two indi-viduals are chosen for every reproductive event with proba-bility proportional to theirfitness. If both individuals carry the mallele, one of them reproduces asexually. If one or both of the individuals carry the Mallele, they reproduce sexually and produce one recombinant offspring. The off-spring inherits one of the parental alleles at the M locus, chosen randomly.
Population metrics
Meanfitness and logfitness:Wis the meanfitness and ln W
is the mean logfitness of all individuals present in the pop-ulation at a given time (see Equation 2).
Genetic variance in log fitness: varðlnW) is the total
vari-ance among all individuals present in the population at a given time.
Mean and variance in log fitness under linkage
equilib-rium: We estimated mean and variance in lnWfor a
picking each row from theRmatrices of any individual in the population with equal probability.
Effective population size: To estimate effective population
size,Ne;a neutral locus was incorporated into the simulation. In sexuals, the neutral locus was not linked to the gene net-work loci. In each generation, the neutral locus acquired a random number of mutations drawn from a Poisson distribu-tion with mean 1. Each mutadistribu-tion added to the neutral locus value a random draw from the standard normal distribution. The equilibrium varianceðV^Þat an unlinked neutral locus is expected to beN, the census population size. We calculated
NeasV^ at the neutral locus.Neestimates were obtained at generation 104;at which time all but the largest populations (N¼104) had achieved equilibrium variance at the neutral locus.
Genetic architecture
Deleterious mutation rate:The deleterious mutation rate is
defined asUd¼UðpdþplÞ;whereUis the genomic mutation rate, andpdandplare the proportions of nonlethal deleteri-ous and lethal mutations, respectively (seeBox 1).Uis con-stant throughout the course of a simulation butpdandplcan evolve. We estimate the quantitypdþpl for a genotype by generating 100 copies of the genotype carrying a single mu-tation and evaluating the proportion of them that have lower fitness than the original genotype.
Recombination load: The recombination load is defined as
LR ¼v2r;wherevis the meanfitness of a pair of parental genotypes and r is thefitness of a single recombinant off-spring from them, without mutation (seeBox 1).LRwas cal-culated by averaging this measure across Nindependently chosen pairs of individuals, where each parent was chosen with probability proportional to their fitness (i.e., in the same way the population reproduced in the evolutionary simulations).
Epistasis: We define multiplicative epistasis between two
mutations, i and j, as e¼Wi;j=W2WiWj=W2; where W is
thefitness of the unmutated (test) genotype,WiandWjare thefitnesses of the single mutants, andWi;jis thefitness of
the double mutant. Otto and Feldman (1997) introduced the standardized epistasis coefficient e*¼e=s2; where
s¼ ðWiþWjÞ=ð2WÞ21 is the mean effect of a single muta-tion. We calculated means and variances ofe* across pairs of random nonlethal deleterious mutations, introduced individ-ually and in combination into a random sample of 100 viable individuals without replacement (for N,100;we sampled 100 viable individuals with replacement).
Invasion analysis
Populations were evolved for 104 generations under either asexual or sexual reproduction (i.e., the population was fixed for either themor theMallele, respectively), to allow sufficient time for the population to approach mutation–
recombination–selection–drift equilibrium. We then mutated the allele at the modifier locus M (see Reproductive mode, above) in a single randomly chosen individual. In most pop-ulation size 3 reproductive mode treatments, we measured thefixation probability of the novel modifier allele,u, relative to that of a neutral mutation (u*¼1=N) inNreplicate inva-sion trials per independently evolved population, for a total of 50Nreplicates. For the largestN¼104populations, com-putational time limited us to 5Nreplicate asexual invasion trials and 10Nreplicate sexual invasion trials.
Evolution of recombination rate
Populations were evolved for 104generations with a modifier locus that was linked to a randomly chosen row of theRmatrix andfixed for an allele that specified a map length of l¼0 morgans. After generation 104;the modifier locus experienced mutations at a rate of 1023 per generation. Mutational effects onlwere60:05 morgans, with equal probability. Alleles con-ferringl,0 were discarded. When two individuals with map lengthsl1andl2 reproduced, the expected number of cross-overs in the offspring wasl1þl2:
Parameter values
The parameter values used here differed from those used in previous work on the evolution of genetic architecture (Siegal
and Bergman 2002; Azevedo et al. 2006; MacCarthy and
Bergman 2007; Lohaus et al.2010): the random gene
net-works were larger (n¼100 genes) and sparserðc¼0:05Þ;
and the genomic mutation rate was higher ðU¼1Þ:These modifications have three advantages. First, the greater num-ber of genes allows mutations to have a broad range of po-tential fitness effects, including beneficial, neutral, slightly deleterious, and lethal. Second, the higherUallows popula-tions to show considerable mutation load at equilibrium (see
Box 1) (Martin and Wagner 2009). Third, real gene networks are relatively sparse (Leclerc 2008).
Statistical analysis
All statistics were conducted using the R statistical package, version 3.2.1 (Ihaka and Gentleman 1996). Comparisons of evolutionary trajectories were conducted using the function
lme of the nlme package to generate linear mixed-effects models (Pinheiro and Bates 2000). In these models, ln(time) in generations, sex (i.e., reproductive mode: sexual or asex-ual), and lnðNÞwere modeled asfixed effects. Statistical tests using linear models with only onefixed effect or with multi-plefixed effects are described in text or in a detailed table, respectively. In all linear models, population founder was modeled as a random effect.
Data availability
Programs used to run all simulations were written in Python 2.7 and are available at
https://bitbucket.org/cburch/whitlock-et-al-2016. The authors state that all data necessary for
Results
Sex has a long-term advantage
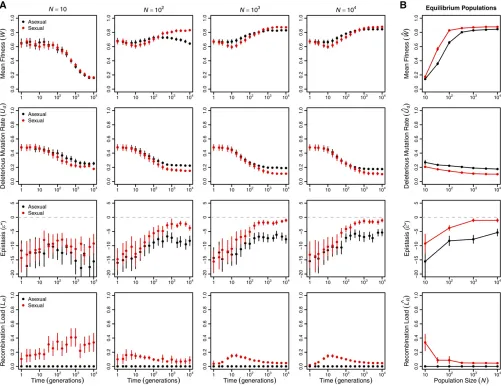
We simulated the evolution of haploid gene networks in populations ranging in size fromN¼10 to 104 individuals. We set the genomic mutation rate to be high ðU¼1Þ and stabilizing selection to be moderate (s¼0:2) to ensure the operation of all components of Hill–Robertson interference: Muller’s ratchet in smaller populations, the Fisher–Muller effect in larger populations, and hitchhiking and background selection at all population sizes. Mutants differing from the target expression state atiandiþ1 genes differed infitness by no more than 5% (i.e.,Wi2Wiþ1,0:05;for alli). Pop-ulations were evolved for 104 generations, allowing suffi -cient time for populations of all sizes to approach mutation– recombination–selection–drift equilibrium. To examine the evolutionary contributions of changes in the genetic architec-ture in these populations, we monitored mean fitnessðWÞ;
deleterious mutation rateðUdÞ;epistasisðe*Þ;and recombi-nation loadðLRÞover the course of the simulations (Figure 1; note that time is plotted on a log scale).
Over the short term (generations 1–10), the most striking difference between sexual and asexual populations is that meanfitness declines significantly more quickly in large sex-ual populations than in large asexsex-ual populations (statis-tical analysis in Supplemental Material, Table S1). This pattern characterizes populations of at least 100 individuals [ln(time) 3 sex interaction estimated separately for each
N$100:jtj$3:989;d:f:¼447;P,0:0001;all tests] and appears to be largely the result of the recombination load increasing in sexual populations through generation 10 [ef-fect of ln(time) onLR:jtj ¼3:975;d:f:¼1699;P,0:0001]. Smaller populations did not show a significant change in mean fitness in the first 10 generations [main effect of
ln(time) and ln(time) 3 sex interaction estimated
sepa-rately for each N,100:jtj$1:946;d:f:¼447;P.0:05;
all tests].
Over the longer term (at 104 generations; Figure 1B), sexual populations evolved significantly higher meanfitness at equilibrium than asexual populationsðW^sex.W^asexÞ;and the magnitude of the difference depended on population size
(Table S2). In populations of #100 individuals, the
differ-ence appears primarily attributable to Muller’s ratchet, as all asexual populations in this size range exhibited afitness de-cline between generations 100 and 104 [Figure 1A; effect of ln(time) on mean fitness estimated separately for each
N#100:jtj$8:469;d:f:¼399;P,0:0001;all tests]. Only
the smallest sexual and asexual populations (N¼10)
evolved to indistinguishable equilibrium meanfitnesses, sug-gesting that the costs of recombination load in sexual popu-lations and of Muller’s ratchet in asexual populations were of similar magnitude at this population size.
In populations of.100 individuals, the equilibrium mean fitness was determined by the evolving genetic architecture (Figure 1B). Both the deleterious mutation rate,Ud(Table
S3;P,0:0001), and the recombination load,LR(in sexuals:
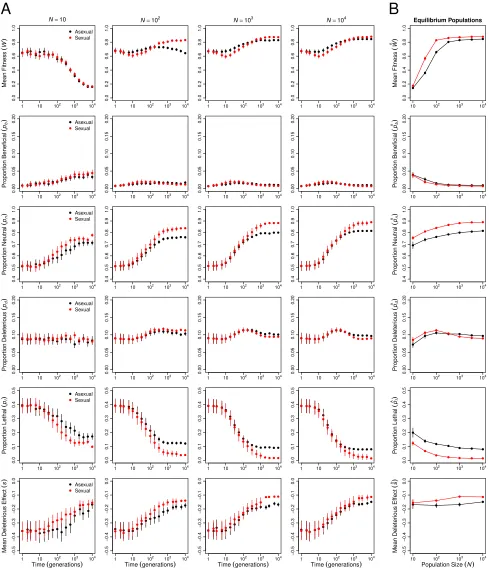
jtj ¼7:251;d:f:¼299;P,0:0001), decreased significantly with population size. The proportions of all types of muta-tions—beneficial, neutral, deleterious, and lethal—evolved, but reductions in the proportion of lethal mutations (pl) and parallel increases in the proportion of neutral mutations (pn) made the strongest contributions to the decreases inUd(
Fig-ure S1). The equilibrium meanfitness of large populations
was well predicted by the mutation–selection balance equa-tion in Box 1 (Figure 2), with large asexual populations closely matching the prediction (all N$333 differing by , 1%) and sexual populations falling slightly below the pre-diction due to recombination load (allN$100 differing by
. 2:5%).
Sexual populations evolved negative epistasis between deleterious mutations (Figure 1), consistent with earlier results using a similar model with fewer genes (n = 10) (Azevedoet al.2006; MacCarthy and Bergman 2007; Lohaus
et al.2010). However, the negative epistasis cannot account for the long-term advantage of sex in our model. If the neg-ative epistasis we observed had produced a long-term advan-tage of sex, as expected (Kimura and Maruyama 1966; Kondrashov 1988; Charlesworth 1990), then sexual popula-tions would have evolved a higherfitness at equilibrium than that predicted by the equation inBox 1. We found the oppo-site pattern (Figure 2).
Although the operation of Muller’s ratchet (Kimuraet al.
1963) was apparent only in populations of#100 individuals (W^ e2Ud;Figure 2), Hill–Robertson interference was also
operating in larger asexual populations. Background selec-tion reduced neutral genetic variaselec-tion, a metric ofNe; signif-icantly more in large asexual populations than in small asexual populations (Figure 3B and Table S4). Thus, Hill– Robertson interference had an indirect effect on the mean fitness of larger populations via its effect on the efficiency with which selection acted to reduceUd(Figure 1B). In fur-ther support of this conclusion, when sexual and asexual populations were subjected to a mutation rateðU¼0:1Þthat was too low for changes inUdto have an appreciable effect on meanfitness, but sufficiently high to drive background selec-tion, we observed no difference in meanfitness between sex-ual and asexsex-ual populations even atN¼104(Figure S2). In addition, when network connectivity (c) was too low to drive differences among sexual and asexual populations in equilib-rium Ud;we again observed no difference in mean fitness between sexual and asexual populations (Figure S3).
Sex has a short-term advantage in large populations
population has an immediate disadvantage because itstarts
experiencing recombination load, whereas an asexual mu-tant arising in a sexual population has an immediate advan-tage because itstopsexperiencing recombination load.
We next investigated whether the short-term advantages of sex were sufficient to enable sexual mutants to invade equilibrium asexual populations, despite this short-term dis-advantage. Following the approach of Keightley and Otto (2006), we investigated the origin of sex by introducing a sexual mutant into equilibrium asexual populations. We sim-ilarly investigated the maintenance of sex by introducing an asexual mutant into equilibrium sexual populations. We then monitored the fate of the mutations until they were either fixed or lost from the population. We measured thefixation probability of the invading allele ðuÞ relative to that of a neutral mutationðu*¼1=NÞin at least 5Nreplicate invasion trials at each population size.
In Figure 4, we show the effect of population size on these relative fixation probabilities, u=u*: At small population
sizes, asexual modifiers invaded successfully more often than sexual modifiers, and this difference increased with popula-tion size until it achieved a maximum nearN¼100:As pop-ulation size increased further, the trend reversed so that sexual modifiers invaded successfully more often than asex-ual modifiers in large populations (N.103; Figure 4). In the largest populations we tested (N¼104), sexual mutants invaded asexual populations significantly more often than the neutral expectation (u=u*¼1:987; n¼1:563105;
P¼0:0005 by an exact binomial test). Although we report
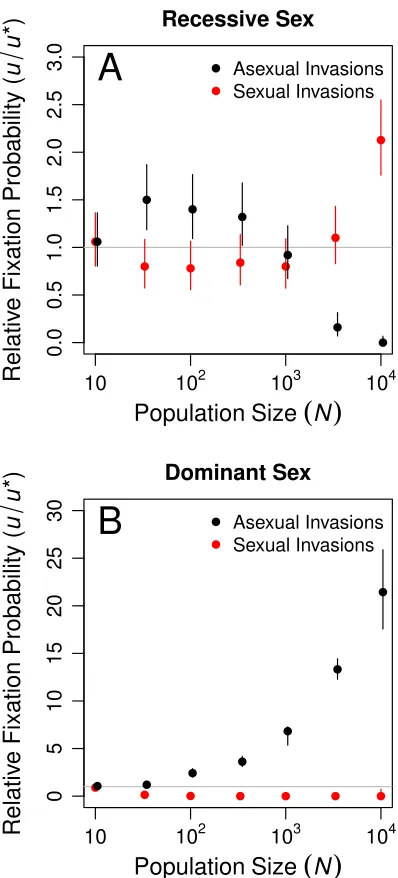
only the results of our separate sex implementation of sexual reproduction (seeMaterials and Methods,Reproductive mode) in Figure 4, we obtained qualitatively identical results using recessive sex (Figure S4A). Dominant sex was neither able to invade nor able to resist invasion by asexual modifiers (
Fig-ure S4B) for reasons we discuss inFile S1.
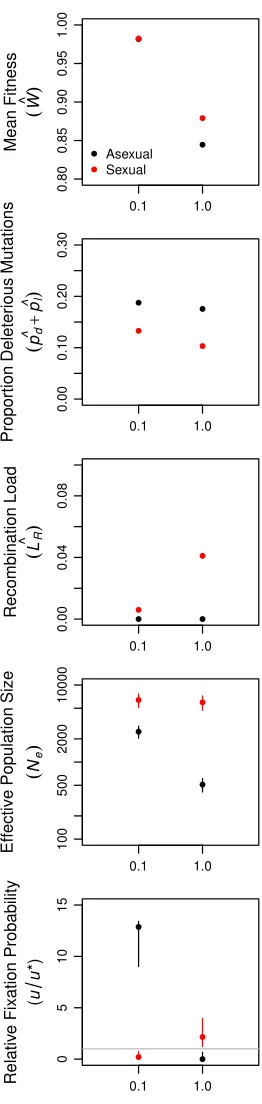
Examining only the largest populationsðN¼104Þ;we ex-plored the sensitivity of the modifier fixation probabilities to the genome-wide mutation rate (U). Like the long-term
Figure 1 Sex has a long-term advantage. (A) Changes in meanfitnessðWÞ;deleterious mutation rateðUdÞ;epistasisðe*Þ;and recombination loadðLRÞover
advantage described above, this short-term advantage of sex disappeared when we reduced the mutation rate toU¼0:1
(Figure S2). Although this mutation rate was sufficiently high
to cause evolution of genetic architecture in the form of a decreasedUd;it did not translate to afitness advantage be-cause mutations, deleterious or otherwise, are rare. Despite the substantial background selection at this mutation rate (Keightley and Otto 2006), asexual modifiers readily invaded equilibrium sexual populations and sexual modifiers were un-able to invade equilibrium asexual populations (Figure S2).
The short-term advantage of sex is caused by Hill–Robertson interference, not epistasis
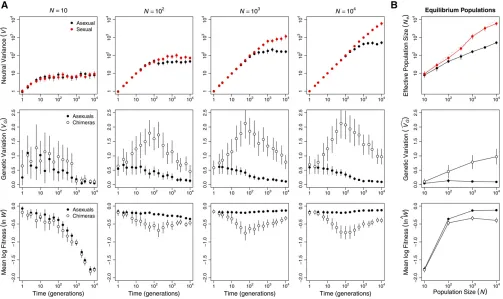
In our invasion simulations, the immediate population genetic consequence of introducing sex into an asexual population is the breakup of LD. Breaking up LD is expected to have two consequences. First, mean fitness will decline as beneficial combinations of alleles (positive LD) built up by selection are broken up; this selects against sex. Second, additive genetic variance in fitness will rise as negative LD built up by a combination of selection and genetic drift is broken up; this selects for sex. Figure 3 shows that both of these predictions are met for log fitness ðlnWÞ for populations of $100 individuals.
If these immediate consequences of sex determined the invasion success of sexual modifiers, then we expect the increase in additive genetic variance to outweigh the decrease in mean fitness only in the largest populations (N¼104; Figure 4 andFigure S4A). More precisely, higher recombina-tion is expected to evolve if the net advantage of eliminating LD is positive,i.e., ifDln WþDvarðln WÞ.0;whereD indi-cates the difference between a statistic in the real population and that in a hypothetical population with the same allele frequencies but in linkage equilibrium (Barton 1995). Figure 3B shows that at generation 104 the net advantage of elimi-nating LD increases with population size and that Dln WþDvarðln WÞ.0 for all asexual populations of $100 individuals (paired t-test: t$3:417; d:f:¼49; P#0:0013).
These results agree qualitatively, but not quantitatively, with the data in Figure 4 andFigure S4A, where sex invades
successfully only in much larger populations. One possible reason for the discrepancy is that the Barton (1995) predic-tion is for weak modifiers of recombination, whereas our results are for a maximal increase in the rate of recombina-tion (increasing the genetic map length froml¼0 to 49.5 morgans). To test this possibility, we ran additional invasion simulations where we introduced into equilibrium asexual populations a weaker modifier of recombination that
in-creased map length from l¼0 to only 0.05 morgans. The
weaker modifier mutations exhibited higherfixation proba-bilities, exceeding the neutral expectation in populations of at least 103individuals (Figure S5).
In our model, the determinant of the short-term advantage of sex, negative LD, appears to have arisen from Hill–Robertson interference rather than from the negative epistasis that evolved in our simulations (Figure 1). Otto and Feldman (1997) predict the evolution of higher recombination rate only if the epistatic effects of mutations satisfy the condition
3e*þ ðe*Þ2þvarðe*Þ,0;
wheree* is a standardized epistasis coefficient (seeMaterials and Methods,Genetic architecture). None of the 50 popula-tions summarized in Figure 1 (sexual or asexual) satisfied that condition at generation 104:Thus, epistasis cannot ex-plain the accumulation of negative LD in large asexual pop-ulations. Instead, it must have been caused by Hill–Robertson interference.
Changes in the genetic architecture influence both the origin and maintenance of sex
Changes in the genetic architecture played a decisive role in generating a long-term advantage of sex (Figure 1). Here we investigate the role of changes in the genetic architecture in the short-term advantage of sex. To understand why the or-igin and maintenance of sex were favored only when
popu-lation size was large, we investigated the mean fitness
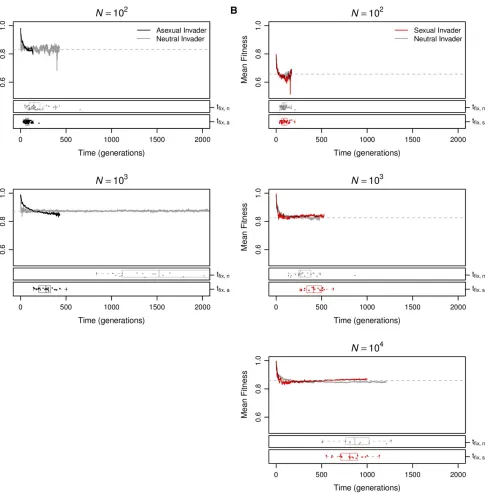
dynamics andfixation times of the sexual and asexual geno-types that successfully invaded (Figure 5). The immediate and short-termfitness consequences of mutations that alter reproductive mode were predictable from the dynamics of
Figure 2 Equilibrium meanfitness shows the
effects of Muller’s ratchet, mutation load, and recombination load. The equilibrium meanfi t-ness of large populations differed only slightly from the expectation at mutation–selection balance (Box 1). Values are means and 95% confidence intervals of the observedfitness in asexual (black) and sexual (red) populations af-ter 104 generations of evolution (replotted from Figure 1B). Solid lines show the expecta-tion under the mutaexpecta-tion load equaexpecta-tion inBox 1
genetic architecture evolution. Asexual modifiers arising in sexual populations experienced an immediatefitness benefit due to the disappearance of recombination load and the ad-vantageous genetic architecture (lowUd) they inherit from their sexual predecessors. The latter advantage decayed over time as asexual invaders evolved toward the asexual equilib-rium. Most successful asexual invasions occurred quickly (Figure 5A, black points and boxplots), before the meanfi t-ness of the invaders (Figure 5A, black lines) decayed below that of the resident sexual population (Figure 5A, dashed gray lines).
In contrast, sexual modifiers that successfully invaded asexual populations experienced a short-termfitness decline during the time when recombination load was accumulating, but evolved back toward the sexual equilibrium after sufficient time had passed to evolve an advantageous genetic architec-ture (comparefitness trajectories in Figure 5B toUdandLR trajectories in Figure 1A). Successful sexual modifiers arose by chance in high-fitness genomes, retained a higherfitness than the asexual mean for100 generations (Figure 5B, red lines), and hitchhiked to a relatively high frequency as a re-sult (Figure S6). In populations of sizeN#100; the only sexual modifiers that fix appear to do so by hitchhiking quickly tofixation. In larger populations (N$103), the initial
hitchhiking of sexual modifier mutations was critical to their invasion success because it enabled their persistence over the long timescale needed for the sexual invaders to evolve a higher mean fitness (Figure 5B, red lines) than that of the resident asexual population (Figure 5B, dashed gray lines). Similarly, population size (N) critically affected invasion probabilities because increasingNincreased the transit time
ðtfixÞ of new mutations tofixation (Figure 5, red and black points and boxplots). Because the evolution of asexual dis-advantages and sexual dis-advantages is time dependent, sexual resident populations and sexual invaders can be successful only if they persist long enough for these differences to evolve. Thus, our data reveal that the evolutionary success of sex at only the largest population sizes resulted from an interaction between the increase intfixand the differences in fitness dynamics between sexual and asexual invaders (Fig-ure 5).
Selection favors moderate recombination rates
Thus far, we have compared asexual reproduction to sexual reproduction with free recombination. However, we found that a small increase in recombination rate is favored even when sex is not (N¼103;compare Figure 4 andFigure S4A
with Figure S5), suggesting that“a little sex may go a long
Figure 3 Hill–Robertson interference affected asexual populations of all sizes. (A) Hill–Robertson interference depressed variance at a neutral locusðVÞ
in asexual (black) compared to sexual (red) populations (top row). The LD that accumulated in asexual populations also decreased genetic variance in log fitness,VG ¼varðln WÞ; and increased mean logfitness,ln W: Data in the middle and bottom rows compare these metrics in the real asexual populations (solid circles) and populations of chimeras with the same allele frequencies but no LD (open circles). (B) Means of each metric at generation 104:Effective population sizeðN
way”(Hurst and Peck 1996) in our model. To investigate this phenomenon further, we allowed recombination rate to evolve in populations ofN¼103individuals. Like our inves-tigations of the evolution of sexual reproduction, we began these simulations with populations that had evolved to a mutation–selection–drift equilibrium in the absence of re-combination. Unlike the earlier simulations, mutations at the modifier locus were recurrent and had only small effects on the length of the genetic mapl ð60:05 morgansÞand, therefore, on the recombination rate. Mean map length among 50
repli-cate simulations increased to l0:1 morgans within
1:53104generations (Figure 6). Thus, selection in the gene network model readily promoted the evolution of moderate, but not high, recombination rates in populations ofN¼103 individuals.
Discussion
We simulated evolution in a computational model of gene networks to determine how Hill–Robertson interference in-teracts with an evolving genetic architecture to affect the evolutionary origin and maintenance of sex. We found that the benefit of sex increased with population size, in agree-ment with earlier studies (Ileset al.2003; Keightley and Otto 2006; Gordo and Campos 2008; Hartfieldet al.2010). Those
studies identified Hill–Robertson interference as the principal cause of this pattern. We found that Hill–Robertson interfer-ence also played a role in our model in creating both a long-term and a short-long-term advantage of sex. But we also showed that the long- and short-term advantages of sex were deter-mined by differences between sexual and asexual popula-tions in the evolutionary dynamics of two properties of the genetic architecture,UdandLR:We next sought to quantify the contribution of Hill–Robertson interference to these dynamics.
We documented two differences between sexual and asex-ual populations that likely affected the evolution ofUd:First, sexual populations uniquely experienced recombination
load, LR: We know from previous work that selection
to minimizeLR;alone, results in increasing robustness to both recombination and mutation, lowering Ud (Azevedo et al. 2006; Gardner and Kalinka 2006; Misevicet al.2006; Martin and Wagner 2009; Lohauset al.2010). Second, asexual pop-ulations uniquely experienced Hill–Robertson interference
that reduced Ne (Figure 3B). As in Keightley and Otto
(2006), the reduction inNeincreased with population size,
N. AtN¼100;Newas reduced by 36% (from 72 to 46 indi-viduals); atN¼104;N
ewas reduced by 91% (from 5957 to 510 individuals). The reducedNein asexuals is expected to reduce the efficiency with which selection lowersUd:In sum, sexuals may have evolved lower Udthan asexuals both be-cause sexuals experienced stronger selection to do so and because Hill–Robertson interference reduced the efficiency of selection onUdin asexuals.
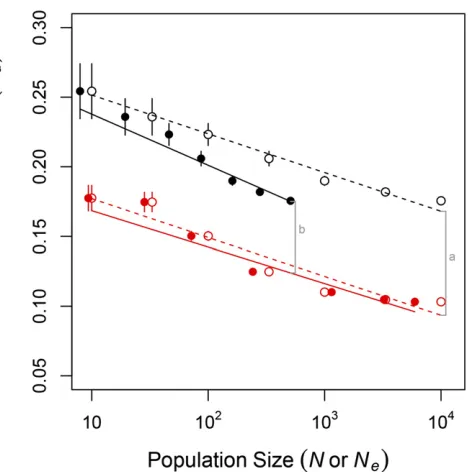
We quantified how these differences in the strength and efficiency of selection contributed to the equilibriumUd in sexual and asexual populations in Figure 7. In Figure 7, we compare the equilibriumUdbetween sexual and asexual pop-ulations of the same census size,N, and of the same effective size,Ne:Differences inUdbetween populations of the same census size resulted from differences in both the strength and efficiency of selection, whereas differences in Ud between populations of the same effective size resulted from differ-ences only in the strength of selection. In Figure 7 we see that the effect on Ud of differences in the strength of selection (line b) decreased as population size increased, whereas the combined effect of differences in the strength and effi -ciency of selection (line a) was constant across the population sizes we examined. Thus, although differences in the strength of selection played a larger role than differences in the efficiency of selection at all the population sizes we ex-amined, the relative contribution of selection efficiency grew with population size. In populations . 104individuals, the reduced selection efficiency caused by Hill–Robertson inter-ference may have eventually come to play the dominant role in determiningUdand, consequently, meanfitness in asexual populations.
Ourfinding that Hill–Robertson interference contributed to the advantages of sex in part through its indirect effect on the evolution of genetic architecture differs from thefindings of previous models in which the genetic architecture was
Figure 4 Sex has a short-term advantage in large populations. Asexual
static and Hill–Robertson interference directly determined the advantages of sex (Ileset al.2003; Keightley and Otto 2006; Gordo and Campos 2008; Hartfieldet al.2010). The evolvable genetic architecture in the gene network model likely affected the contribution of Hill–Robertson interfer-ence in a number of ways. We focused on the evolvingUd because it was the primary determinant of equilibrium mean
fitness in large populations, but we think that the evolving compensatory mutation rate (Figure S1) also played an im-portant role. Compensatory mutations increased in frequency asfitness declined, ensuring that our populations achieved a fitness equilibrium. Thefitness equilibrium was an important aspect of our model. The absence of compensatory mutations in the previous models (Muller 1964; Haigh 1978; Keightley
Figure 5 Changes in the genetic architecture influence both the origin and maintenance of sex. We monitored thefixation and loss of asexual mutants
and Otto 2006; Gordo and Campos 2008) ensured a perpet-ual decline in population meanfitness via Muller’s ratchet, regardless of population size, that would have been accelera-ted by Hill–Robertson interference in asexual populations. In our gene network model, Muller’s ratchet was eventually halted by an increasing frequency of compensatory mutations even at the smallest population sizes (Figure 1). As a result, direct effects of Hill–Robertson interference on advantages of sex in the gene network model were limited to populations that were small enough for Muller’s ratchet to operate over a widefitness range.
One major difference between our results and those of earlier studies of Hill–Robertson interference is that we ob-served only moderate advantages of sex. The long-term advantage of sex observed here (W^sex=W^asex¼1:04 for
N¼104) was substantial but may be considered weak com-pared to the twofold cost experienced by many sexual species in nature. The short-term advantage was even weaker: it disappeared when we imposed as little as a 1% cost of sex
(Figure S7). We note, however, that modifiers of sex
gener-ated smaller short-term advantages than modifiers of
recom-bination (compare the N¼103 populations in Figure 4,
Figure S5, and Figure 6), as has been observed in other
mod-els (Keightley and Otto 2006).
We identified two additional factors that contribute to the advantages of sex in our model. First, a higher mutation rateU
increases the advantage of sex. This has been found in other models (Keightley and Otto 2006; Gordo and Campos 2008). Note that the deleterious mutation rate evolved in our simulations
ðUd0:2Þ is high, but not unrealistically so. For example,
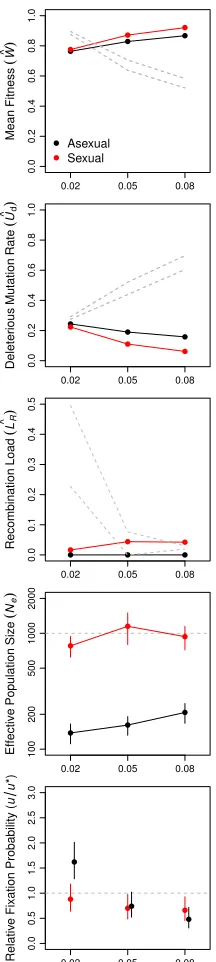
Drosophila melanogastershowsUd1 (Haag-Liautardet al. 2007). Second, a higher gene network connectivity increases the advantage of sex. We improved biological realism (Leclerc 2008) by using much sparser networks ðc¼0:05Þ
than earlier studies of this model (typically,c¼0:75) (Siegal
and Bergman 2002; Azevedo et al. 2006; MacCarthy and
Bergman 2007; Lohaus et al.2010). A connected transcrip-tional regulatory network of 75 transcription factors in yeast estimatedc¼0:024 (MacIsaacet al.2006). Networks with similar connectivity in our model were not able to generate an advantage of sex (c¼0:02; Figure S3). However, the yeast estimate increases as new data become available (compare Harbison et al.2004; MacIsaac et al.2006). In addition, we do not know the extent to which this yeast network is representative of other networks in nature. A strict compar-ison of connectivities between our networks and real biolog-ical networks is likely misleading because we considered only random gene networks, a pattern of connectivity that is prob-ably unrealistic (Miloet al.2002; Shen-Orret al.2002).
The magnitudes of both the long- and short-term advan-tages of sex are likely to be affected additionally by many
Figure 7 Hill–Robertson interference explains part of the difference in
equilibrium Ud between sexual (red) and asexual (black) populations. Shown are equilibrium values of the genome-wide deleterious mutation rateUdvs.census population sizeN(open circles, replotted from Figure 1) andvs.effective population sizeNe(solid circles). Lines are bestfit linear models obtained separately usingN(dashed lines) orNe(solid lines) as a dependent variable together with reproductive mode. The total difference inUdexhibited by sexual and asexual populations of census sizeN¼104 (gray line a) is attributable to differences in both the strength and the efficiency of selection acting on genetic architecture. The difference inUd exhibited by sexual and asexual populations of effective size Ne¼510 (gray line b) is the proportion of the total difference that remained after controlling for differences in the efficiency of selection that arise through Hill–Robertson interference.
Figure 6 Evolution of the recombination rate under recurrent mutation
factors we have not considered here, such as deviations from random mating (Shields 1982; Jaffe 2000; Agrawal 2001; Siller 2001; Blachford and Agrawal 2006), population structure (Pecket al.1999; Agrawal and Chasnov 2001; Salathéet al.
2006; Roze 2009; Hartfield et al. 2012), ploidy (Kirkpatrick and Jenkins 1989; Kondrashov and Crow 1991; Agrawal and Chasnov 2001; Otto 2003; Haag and Roze 2007; Roze 2009), number of loci (Ileset al.2003), and environmental change (Charlesworth 1993; Barton 1995; Otto and Nuismer 2004; Carjaet al.2014; Nowaket al.2014), leaving many questions yet to be answered.
Acknowledgments
We thank associate editor Nick Barton and two anonymous reviewers for advice that improved thefinal version of the manuscript. We also thank Shawn Gomez, Ron Swanstrom, Todd Vision, Chris Willet, and Eric Earley for their insights. This work was funded by grant DEB-1355084 awarded to C.L.B. and grant DEB-1354952 awarded to R.B.R.A. by the National Science Foundation and by a Dissertation Comple-tion Fellowship awarded to A.O.B.W. by the University of North Carolina at Chapel Hill. The funders had no role in study design, data collection and analysis, decision to publish, or preparation of the manuscript.
Literature Cited
Agrawal, A. F., 2001 Sexual selection and the maintenance of sexual reproduction. Nature 411: 692–695.
Agrawal, A. F., and J. R. Chasnov, 2001 Recessive mutations and the maintenance of sex in structured populations. Genetics 158: 913–917.
Azevedo, R. B. R., R. Lohaus, S. Srinivasan, K. K. Dang, and C. L. Burch, 2006 Sexual reproduction selects for robustness and negative epistasis in artificial gene networks. Nature 440: 87– 90.
Barton, N. H., 1995 A general model for the evolution of recom-bination. Genet. Res. 65: 123–145.
Barton, N. H., and S. P. Otto, 2005 Evolution of recombination due to random dirift. Genetics 169: 2353–2370.
Bell, G., 1982 The Masterpiece of Nature: The Evolution and Genet-ics of Sexuality. University of California Press, Berkeley, CA. Bernstein, H., H. C. Byerly, F. A. Hopf, and R. E. Michod,
1985 Genetic damage, mutation, and the evolution of sex. Science 229: 1277–1281.
Blachford, A., and A. F. Agrawal, 2006 Assortative mating for fitness and the evolution of recombination. Evolution 60: 1337–1343.
Burch, C. L., and L. Chao, 2004 Epistasis and its relationship to canalization in the RNA virusu6. Genetics 167: 559–567. Burt, A., 2000 Perspective: sex, recombination, and the efficacy of
selection—Was Weismann right? Evolution 54: 337–351. Carja, O., U. Liberman, and M. W. Feldman, 2014 Evolution in
changing environments: modifiers of mutation, recombination, and migration. Proc. Natl. Acad. Sci. USA 111: 17935–17940. Charlesworth, B., 1990 Mutation-selection balance and the
evo-lutionary advantage of sex and recombination. Genet. Res. 55: 199–221.
Charlesworth, B., 1993 Directional selection and the evolution of sex and recombination. Genet. Res. 61: 205–224.
Charlesworth, B., 1994 The effect of background selection against deleterious mutations on weakly selected, linked variants. Genet. Res. 63: 213–227.
Charlesworth, B., and N. H. Barton, 1996 Recombination load associated with selection for increased recombination. Genet. Res. 67: 27–41.
Charlesworth, B., M. T. Morgan, and D. Charlesworth, 1993 The effect of deleterious mutations on neutral molecular variation. Genetics 134: 1289–1303.
Comeron, J. M., A. Williford, and R. M. Kliman, 2008 The Hill-Robertson effect: evolutionary consequences of weak selection and linkage infinite populations. Heredity 100: 19–31. Felsenstein, J., 1974 The evolutionary advantage of
recombina-tion. Genetics 78: 737–756.
Fisher, R. A., 1930 The Genetical Theory of Natural Selection. Clar-endon Press, Oxford.
Gardner, A., and A. T. Kalinka, 2006 Recombination and the evo-lution of mutational robustness. J. Theor. Biol. 241: 707–715. Gerrish, P. J., and R. E. Lenski, 1998 The fate of competing
ben-eficial mutations in an asexual population. Genetica 102–103: 127–144.
Gordo, I., and P. R. A. Campos, 2008 Sex and deleterious muta-tions. Genetics 179: 621–626.
Gordo, I., and B. Charlesworth, 2000 The degeneration of asexual haploid populations and the speed of Muller’s ratchet. Genetics 154: 1379–1387.
Haag, C. R., and D. Roze, 2007 Genetic load in sexual and asexual diploids: segregation, dominance and genetic drift. Genetics 176: 1663–1678.
Haag-Liautard, C., M. Dorris, X. Maside, S. Macaskill, D. L. Halligan et al., 2007 Direct estimation of per nucleotide and genomic deleterious mutation rates in Drosophila. Nature 445: 82–85. Haigh, J., 1978 The accumulation of deleterious genes in a
pop-ulation—Muller’s ratchet. Theor. Popul. Biol. 14: 251–267. Haldane, J. B. S., 1937 The effect of variation offitness. Am. Nat.
71: 337–349.
Hamilton, W. D., 1980 Sex vs. non-sex vs. parasite. Oikos 35: 282–290.
Hansen, T. F., 2006 The evolution of genetic architecture. Annu. Rev. Ecol. Evol. Syst. 37: 123–157.
Harbison, C. T., D. B. Gordon, T. I. Lee, N. J. Rinaldi, K. D. Macisaac et al., 2004 Transcriptional regulatory code of a eukaryotic genome. Nature 431: 99–104.
Hartfield, M., S. P. Otto, and P. D. Keightley, 2010 The role of advantageous mutations in enhancing the evolution of a recom-bination modifier. Genetics 184: 1153–1164.
Hartfield, M., S. P. Otto, and P. D. Keightley, 2012 The maintenance of obligate sex infinite, structured populations subject to recurrent beneficial and deleterious mutation. Evolution 66: 3658–3669. Hill, W. G., and A. Robertson, 1966 The effect of linkage on limits
to artificial selection. Genet. Res. 8: 269–294.
Hudson, R. R., and N. L. Kaplan, 1994 Gene trees with background selection, pp. 140–153 inNon-Neutral Evolution, edited by B. Golding. Springer-Verlag, Berlin/Heidelberg, Germany/New York. Hudson, R. R., and N. L. Kaplan, 1995 Deleterious background
selection with recombination. Genetics 141: 1605–1617. Hurst, L. D., and J. R. Peck, 1996 Recent advances in
understand-ing of the evolution and maintenance of sex. Trends Ecol. Evol. 11: A46–A52.
Ihaka, R., and R. Gentleman, 1996 R: a language for data analysis and graphics. J. Comput. Graph. Stat. 5: 299–314.
Iles, M. M., K. Walters, and C. Cannings, 2003 Recombination can evolve in large finite populations given selection on sufficient loci. Genetics 165: 2249–2258.
Keightley, P. D., and S. P. Otto, 2006 Interference among delete-rious mutations favours sex and recombination infinite popula-tions. Nature 443: 89–92.
Kimura, M., and T. Maruyama, 1966 The mutational load with epistatic gene interactions infitness. Genetics 54: 1337–1351. Kimura, M., T. Maruyama, and J. F. Crow, 1963 The mutation
load in small populations. Genetics 48: 1303–1312.
Kirkpatrick, M., and C. D. Jenkins, 1989 Genetic segregation and the maintenance of sexual reproduction. Nature 339: 300–301. Kondrashov, A. S., 1982 Selection against harmful mutations in large sexual and asexual populations. Genet. Res. 40: 325–332. Kondrashov, A. S., 1988 Deleterious mutations and the evolution
of sexual reproduction. Nature 336: 435–440.
Kondrashov, A. S., 1993 Classification of hypotheses on the advantage of amphimixis. J. Hered. 84: 372–387.
Kondrashov, A. S., and J. F. Crow, 1991 Haploidy or diploidy: Which is better? Nature 351: 314–315.
Leclerc, R. D., 2008 Survival of the sparsest: robust gene net-works are parsimonious. Mol. Syst. Biol. 4: 213.
Lohaus, R., C. L. Burch, and R. B. R. Azevedo, 2010 Genetic ar-chitecture and the evolution of sex. J. Hered. 101: S142–S157. MacCarthy, T., and A. Bergman, 2007 Coevolution of robustness, epistasis, and recombination favors asexual reproduction. Proc. Natl. Acad. Sci. USA 104: 12801–12806.
MacIsaac, K. D., T. Wang, D. B. Gordon, D. K. Gifford, G. D. Stormo et al., 2006 An improved map of conserved regulatory sites for Saccharomyces cerevisiae. BMC Bioinformatics 7: 113.
Martin, O. C., and A. Wagner, 2009 Effects of recombination on complex regulatory circuits. Genetics 183: 673–684.
Maynard Smith, J., 1978 The Evolution of Sex. Cambridge Univer-sity Press, Cambridge, UK.
Maynard Smith, J., and J. Haigh, 1974 The hitch-hiking effect of a favourable gene. Genet. Res. 23: 23–35.
Milo, R., S. Shen-Orr, S. Itzkovitz, N. Kashtan, D. Chklovskiiet al., 2002 Network motifs: simple building blocks of complex net-works. Science 298: 824–827.
Misevic, D., C. Ofria, and R. E. Lenski, 2006 Sexual reproduction reshapes the genetic architecture of digital organisms. Proc. Biol. Sci. 273: 457–464.
Montville, R., R. Froissart, S. K. Remold, O. Tenaillon, and P. E. Turner, 2005 Evolution of mutational robustness in an RNA virus. PLoS Biol. 3: e381.
Muller, H. J., 1932 Some genetic aspects of sex. Am. Nat. 66: 118–138. Muller, H. J., 1964 The relation of recombination to mutational
advance. Mutat. Res. 1: 2–9.
Newman, M. E. J., 2010 Networks: An Introduction. Oxford Uni-versity Press, Oxford.
Nowak, S., J. Neidhart, I. G. Szendro, and J. Krug, 2014 Multidimensional epistasis and the transitory advantage of sex. PLoS Comput. Biol. 10: e1003836.
Otto, S. P., 2003 The advantages of segregation and the evolution of sex. Genetics 164: 1099–1118.
Otto, S. P., and N. H. Barton, 2001 Selection for recombination in small populations. Evolution 55: 1921–1931.
Otto, S. P., and M. W. Feldman, 1997 Deleterious mutations, vari-able epistatic interactions, and the evolution of recombination. Theor. Popul. Biol. 51: 134–147.
Otto, S. P., and T. Lenormand, 2002 Resolving the paradox of sex and recombination. Nat. Rev. Genet. 3: 252–261.
Otto, S. P., and S. L. Nuismer, 2004 Species interactions and the evolution of sex. Science 304: 1018–1020.
Peck, J. R., 1994 A ruby in the rubbish: beneficial mutations, deleterious mutations and the evolution of sex. Genetics 137: 597–606.
Peck, J. R., J. Yearsley, and G. Barreau, 1999 The maintenance of sexual reproduction in a structured population. Proc. Biol. Sci. 266: 1857–1863.
Pinheiro, J. C., and D. M. Bates, 2000 Mixed-Effects Models in S and S-PLUS. Springer-Verlag, New York.
Pinho, R., V. Garcia, M. Irimia, and M. W. Feldman, 2014 Stability depends on positive autoregulation in boolean gene regulatory networks. PLoS Comput. Biol. 10: e1003916.
Poon, A., and S. P. Otto, 2000 Compensating for our load of mutations: freezing the meltdown of small populations. Evolu-tion 54: 1467–1479.
Rice, S. H., 2008 Theoretical approaches to the evolution of de-velopment and genetic architecture. Ann. N. Y. Acad. Sci. 1133: 67–86.
Roze, D., 2009 Diploidy, population structure, and the evolution of recombination. Am. Nat. 174: S79–S94.
Salathé, M., R. Salathé, P. Schmid-Hempel, and S. Bonhoeffer, 2006 Mutation accumulation in space and the maintenance of sexual reproduction. Ecol. Lett. 9: 941–946.
Sanjuán, R., J. M. Cuevas, V. Furió, E. C. Holmes, and A. Moya, 2007 Selection for robustness in mutagenized RNA viruses. PLoS Genet. 3: e93.
Shen-Orr, S. S., R. Milo, S. Mangan, and U. Alon, 2002 Network motifs in the transcriptional regulation network of Escherichia coli. Nat. Genet. 31: 64–68.
Shields, W. M., 1982 Philopatry,Inbreeding,and the Evolution of Sex. State University of New York Press, Albany, NY.
Siegal, M. L., and A. Bergman, 2002 Waddington’s canalization revisited: developmental stability and evolution. Proc. Natl. Acad. Sci. USA 99: 10528–10532.
Silander, O., O. Tenaillon, and L. Chao, 2007 Understanding the evolutionary fate of finite populations: the dynamics of muta-tional effects. PLoS Biol. 5: e94.
Siller, S., 2001 Sexual selection and the maintenance of sex. Na-ture 411: 689–692.
Wagner, A., 1994 Evolution of gene networks by gene duplica-tions: a mathematical model and its implications on genome organization. Proc. Natl. Acad. Sci. USA 91: 4387–4391. Wagner, A., 1996 Does evolutionary plasticity evolve? Evolution
50: 1008–1023.
Weismann, A., 1887 On the signification of the polar globules. Nature 36: 607–609.
GENETICS
Supporting Information www.genetics.org/lookup/suppl/doi:10.1534/genetics.116.186916/-/DC1
An Evolving Genetic Architecture Interacts with
Hill
–
Robertson Interference to Determine the
Bene
fi
t of Sex
Alexander O. B. Whitlock, Kayla M. Peck, Ricardo B. R. Azevedo, and Christina L. Burch
An evolving genetic architecture interacts with Hill-Robertson interference to
determine the benefit of sex
Alexander O. B. Whitlock, Kayla Peck, Ricardo B. R. Azevedo and Christina L. Burch
Supporting Information
File S1
We explored the sensitivity of our results to the particular implementation of sex by investigating the
origin and maintenance of sex using three different genetic bases for reproductive mode—Separate
Sex, Recessive Sex, and Dominant Sex (see Materials and Methods, Reproductive mode). Under all
implementations, if a population is fixed for the
m
allele, every individual reproduces asexually, and if it
is fixed for the
M
allele every individual reproduces sexually. Thus, the genetic basis of reproductive
mode can impact evolutionary dynamics only during the time when populations are polymorphic for the
modifier allele, i.e. during invasions by sexual or asexual mutants.
In Figure S4, we show the effect of population size on the relative fixation probabilities (
u
/
u
∗) for the
Recessive Sex and Dominant Sex implementations of reproductive mode. The
Recessive Sex
results were
qualitatively identical to the Separate Sex results reported in the main text (Figure 4). At small population
sizes, asexual modifiers invaded more often than sexual modifiers, but at the largest population sizes
we saw the opposite pattern. Sexual modifiers invaded more often than asexual modifiers only in
populations larger than 10
3individuals (Figure S4A). In the largest populations we tested (
N
=
10
4)
sexual mutants fixed in asexual populations more often than the neutral expectation (
u
/
u
∗=
2.13,
n
=
5.5
×
10
5,
p
<
0.0001 by an exact binomial test). The reasons for the success of Recessive Sex in large
populations were identical to those for Separate Sex discussed in the main text. In particular, successful
sexual modifier mutations arose in high fitness genetic backgrounds, remained linked to the background
on which they arose, and quickly hitchhiked to a relatively high frequency as a result. This early high
frequency was critical to the ability of these modifier mutations to persist for the long time required for
sexuals to evolve an advantageous genetic architecture (i.e., reductions in
U
dand
L
R).
Results using the
Dominant Sex
implementation (Figure S4B) differed dramatically from the Separate
and Recessive Sex implementations of reproductive mode. In populations of more than 100 individuals,
asexual mutants readily invaded sexual populations, whereas sexual mutants rarely if ever invaded
asexual populations. Several phenomena likely contributed to this outcome. First, under Dominant
Sex, sexual modifier mutations do not remain linked to the genetic background on which they arise. As
a result, sexual modifiers that arose on high fitness backgrounds did not quickly hitchhike to a high
frequency, unlike the Separate and Recessive Sex modifiers. Second, a dominant sexual modifier is
initially rare and, consequently, sexual
M
genotypes reproduce by recombining with asexual
m
genotypes
0.0 0.2 0.4 0.6 0.8 1.0
N=10
1 10 102 103 104
Asexual Sexual M e a n F it n e ss ( W ) 0.00 0.05 0.10 0.15 0.20
1 10 102 103 104
Asexual Sexual P ro p o rt io n B e n e fi ci a l ( pb ) 0.4 0.5 0.6 0.7 0.8 0.9 1.0
1 10 102 103 104
Asexual Sexual P ro p o rt io n N e u tr a l ( pn ) 0.00 0.05 0.10 0.15 0.20
1 10 102 103 104
Asexual Sexual P ro p o rt io n D e le te ri o u s ( pd ) 0.0 0.1 0.2 0.3 0.4 0.5
1 10 102 103 104
Asexual Sexual P ro p o rt io n L e th a l ( pl ) −0.5 −0.4 −0.3 −0.2 −0.1 0.0
1 10 102 103 104
Asexual Sexual M e a n D e le te ri o u s E ff e ct ( s )
Time(generations)
0.0 0.2 0.4 0.6 0.8 1.0
N=102
1 10 102 103 104
0.00
0.05
0.10
0.15
0.20
1 10 102 103 104
0.4 0.5 0.6 0.7 0.8 0.9 1.0
1 10 102 103 104
0.00
0.05
0.10
0.15
0.20
1 10 102 103 104
0.0 0.1 0.2 0.3 0.4 0.5
1 10 102 103 104
−0.5 −0.4 −0.3 −0.2 −0.1 0.0
1 10 102 103 104
Time(generations)
0.0 0.2 0.4 0.6 0.8 1.0
N=103
1 10 102 103 104
0.00
0.05
0.10
0.15
0.20
1 10 102 103 104
0.4 0.5 0.6 0.7 0.8 0.9 1.0
1 10 102 103 104
0.00
0.05
0.10
0.15
0.20
1 10 102 103 104
0.0 0.1 0.2 0.3 0.4 0.5
1 10 102 103 104
−0.5 −0.4 −0.3 −0.2 −0.1 0.0
1 10 102 103 104
Time(generations)
0.0 0.2 0.4 0.6 0.8 1.0
N=104
1 10 102 103 104
0.00
0.05
0.10
0.15
0.20
1 10 102 103 104
0.4 0.5 0.6 0.7 0.8 0.9 1.0
1 10 102 103 104
0.00
0.05
0.10
0.15
0.20
1 10 102 103 104
0.0 0.1 0.2 0.3 0.4 0.5
1 10 102 103 104
−0.5 −0.4 −0.3 −0.2 −0.1 0.0
1 10 102 103 104
Time(generations)
0.0 0.2 0.4 0.6 0.8 1.0 Equilibrium Populations
10 102 103 104
M e a n F it n e ss ( W ^) 0.00 0.05 0.10 0.15 0.20
10 102 103 104
P ro p o rt io n B e n e fi ci a l ( pb ^) 0.4 0.5 0.6 0.7 0.8 0.9 1.0
10 102 103 104
P ro p o rt io n N e u tr a l ( pn ^) 0.00 0.05 0.10 0.15 0.20
10 102 103 104
P ro p o rt io n D e le te ri o u s ( pd ^) 0.0 0.1 0.2 0.3 0.4 0.5
10 102 103 104
P ro p o rt io n L e th a l ( pl ^) −0.5 −0.4 −0.3 −0.2 −0.1 0.0
10 102 103 104
M e a n D e le te ri o u s E ff e ct ( s ^)
PopulationSize(N)