Models for calculating monthly average solar radiation
from air temperature in Swaziland
Mgidi D. Dlamini
1, Alakaparampil J. Varkey
1, Simiso K. Mkhonta
11
Department of Physics, University of Swaziland, P/Bag 4, Kwaluseni. M201, Swaziland.
Abstract
Solar radiation is the main energy source for mankind and an accurate data of solar radiation levels for a particular location is vital for the optimum operation of solar energy transducers such as photovoltaic cells and solar thermal collectors. In this work, we show that there is a linear relationship between recorded monthly average temperatures and solar radiation in Swaziland. The good correlation can be utilized to develop two mathematical models for the estimation of solar radiation: one from the measured monthly average temperatures and the other based on the square-root of the difference between measured maximum and minimum monthly average temperatures. Both models fit the data well and can be applied to estimate solar radiation in other parts of the region
Keywords: solar energy; solar radiation; climatic data; solar radiation estimation.
1. Introduction
An accurate knowledge of solar radiation levels for a particular location is a prerequisite in the determination of the performance of various solar energy transducers such as photovoltaic cells and solar thermal collectors. Solar radiation data is also important in disciplines such as building designs and agricultural processes, e.g. evapo-transpiration of plants. However, weather stations will, at times, not have data on solar radiation because the instruments for radiation measurement, such as pyrometers and solarimeters, may not be available. As a result, mathematical models have been developed and calibrated to estimate solar radiation in different parts of the world such as in Iran [1], India [2], Algeria/Spain [3], China [4, 5], Bangladesh [6], and Nigeria [7]. These models estimate solar radiation as a function of meteorological parameters such as temperature, atmospheric pressure, relative humidity, the number of sunshine hours, wind speed, cloud cover, and rainfall.
In Swaziland, a number of meteorological stations do not measure solar radiation, and the frequently available meteorological records are the daily maximum and minimum temperatures and precipitation. For this reason this paper evaluates two mathematical models to estimate solar radiation as a function of temperature. The estimated solar radiation values from these two models are found to be consistent with measured data. The good correlation between estimated values and measured data indicates that simple temperature-based models can be utilized to estimate solar radiation from recorded temperatures in similar regions around the country, where solar radiation data is not available.
2. Climatic conditions in Swaziland
Swaziland is a small, landlocked country in Southern Africa and is located between South Africa, on the southern, western and northern side and Mozambique on the eastern side. The map of Swaziland is shown in Fig. 1. On the western side of the country is the Highveld. The Lubombo plateau lies on the eastern side whilst the Middleveld and Lowveld lie between the Highveld and the Lubombo plateau. The areas of interest in this study, in connection with solar radiation, are Big Bend and Mhlume, both of which lie in the Lowveld, Matsapha (Middleveld) and Mbabane (Highveld). The altitude, latitude and longitude in the various locations are shown in Table 1. The country consists of four seasons, namely,
spring (September-October), summer (November-February), autumn (March-May), and winter (June-August).
Table 1. Areas of interest in the solar radiation estimation project.
Location Climatic Region Altitude[m] Latitude[◦S] Longitude[◦E]
Big Bend Lowveld 150 26.82 31.93
Mhlume Lowveld 258 26.00 31.90
Matsapha Middleveld 640 26.50 31.32
Mbabane Highveld 1150 26.30 31.13
There are 11 weather stations in Swaziland, but solar radiation levels are recorded in only one, that is in Mhlume. However, daily maximum and minimum temperatures are routinely measured in all the weather stations. In this work, we use the solar radiation data from Mhlume as a reference to develop and calibrate two mathematical models that define solar radiation as a function of temperature. The data is for the year 2004 to 2014.
Figure 1. Topographic map of Swaziland.
3. Model description
Figure 2 shows that monthly average solar radiation levels at Mhlume are correlated with the monthly average temperature values. Maximum radiation levels were recorded between December and February, during the hottest season, and the lowest solar radiation levels were recorded between May and August, during the coldest season. Motivated by this observation, we assumed that monthly
1 1T c m
Hav av (1)
where m1 and c1 are empirical constants. For comparison purposes, we also considered the work of
Hargreaves and Samani [8] that suggested that Havcan also be estimated as a function of the
extra-terrestrial radiation H0, maximum monthly average temperature Tmax(◦C) and minimum monthly
average temperature Tmin(◦C):
min max 0
2H T T
m
Hav
(2)
where m2 is an empirical constant. The extra-terrestrial solar radiation H0 is a function of latitude only [9]. As the solar radiation passes through the earth’s atmosphere, it is further modified by processes of scattering and absorption due to the presence of cloud and atmospheric particles. Hence, the global solar radiation incident on a horizontal surface, H is always less than H0.
Based on the measured data of monthly average solar radiation and monthly temperature at Mhlume during the period 2004 to 2014, we calculated the empirical constants for Models 1 and 2 using Marquardt-Levenberg algorithm for curve fitting in Gnuplot and obtained the best fit described by m1 = 1.02 ± 0.08,
c1 = −4.28 ± 1 and c2 = 0.161 ± 0.002, as shown in Fig. 3.
Figure 2. Monthly average solar radiation [MJ/m2] and air temperature [◦C] in Mhlume
4. Results and Discussions
The calculated values of solar radiations were then compared to measured data for each year. Fig. 4 shows that both models are consistent with the observed data. In this figure, we also show the estimates of the extra-terrestrial solar radiation on a horizontal surface H0 for Swaziland or regions
located at the latitude 26.00◦S as given in the literature [9]. As expected, the measured or estimated solar radiation at Mhlume is less than the extra- terrestrial solar radiation at the same location.
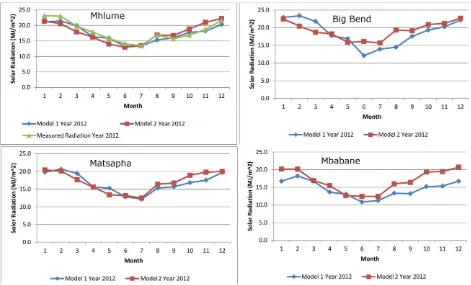
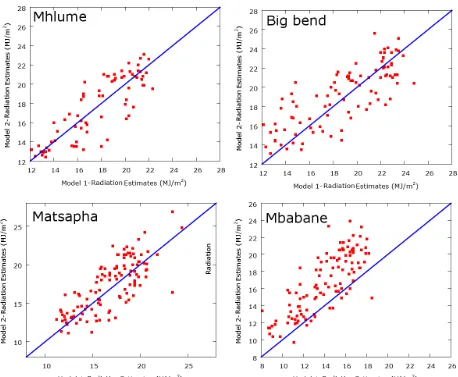
period 2002 and 2013 in three regions in Fig 7. These results show that both models are consistent in all the locations except in Mbabane. This could be due to the fact that the altitude of Mbabane is higher than that of Mhlume by one order of magnitude.
Figure 3. Evaluation of parameters for the mathematical models. Model1: Monthly average solar radiation against monthly average temperatures from 2004 to 2014 in Mhlume, Swaziland. Model 2: Monthly average solar radiation against the square-root of the differences between the maximum and minimum monthly average temperatures from
2004 to 2014 in Mhlume, Swaziland.
Figure 4: Monthly average solar radiation in Mhlume.
Figure 5: Model validations. Comparison between measured and estimated average solar radiation from 2004 to 2014 in Mhlume.
Figure 6. Monthly average solar radiation in Mhlume.
5. Conclusion and Recommendations
Figure 7: Comparison between estimated average solar radiation for year between 2002 and 2013 in Big Bend, Matsapha, Mbabane, and for years between 2004 and 2013 in Mhlume.
6. Acknowledgements
The authors are grateful to the Royal Swaziland Sugar Corporation, Department of Geography, Environmental Science and Planning at the University of Swaziland (UNISWA), and the Swaziland Meteorological Services Department for providing the data used in this work. The authors also acknowledge the valuable suggestions from Dr. W. H. Liao of the Department of Physics (UNISWA).
7. References
[1] Saffaripour, Mehrabian M. A., and Bazargan H. Predicting solar radiation fluxes for solar energy system applications. International Journal of Environmental Science 2013, 10, 761-768.
[2] Bajpai U. and Singh K. Estimation of instant solar radiation by using instant temperature. Acta Montanistica Slovaca 2009, 14(1), 189-196.
[3] Chegaar M., Lamar A., and Chibani A. Estimating global solar radiation using sunshine hours. Rev. Energ. Ren. : Physique Energtique 1998, pp. 7-11.
[5] Li H., Cao F., Wang X., and Ma W. A temperature-based model for estimating monthly average daily global solar radiation in china. The Scientific World Journal, 2014, pp. 1-9.
[6] Datta D. and Datta B. K., Empirical model for the estimation of global solar radiation in Dhaka, Bangladesh, International Journal of Research in Engineering and Technology 2013, 2(11), 649-653.
[7] Umoh M. D., Udo S. O., and Udoakah Y-. O. N. Estimating global solar radiation on horizontal surface from the sunshine hours over Port Harcourt, Nigeria. Environmental Progress & Sustainable Energy 2013, 6(1), 1-5.
[8] Hargreaves G. H. and Samani Z. A. Estimating potential evapo-transpiration. Journal of Irrigation and Drainage Engineering 1982,108, 223-230.

![Figure 2. Monthly average solar radiation [MJ/m2] and air temperature [◦C] in Mhlume](https://thumb-us.123doks.com/thumbv2/123dok_us/7982915.1324253/3.596.80.538.396.530/figure-monthly-average-solar-radiation-mj-temperature-mhlume.webp)