An Analysis of Financial Performance of SIDBI
Naveed Sehar, Research Scholar, Faculty of Commerce, Banaras Hindu University
ABSTRACT
Small Industries Development Bank of India (SIDBI) has celebrated its 25th anniversary and during this period, it has come a very long route. SIDBI is an apex bank for the development of Micro, Small and Medium Enterprises (MSMEs). The MSME sector contributes a significant part in the economic development of the country. Thus, to contribute in the development of the MSME sector, it is important for the Bank to be financially strong. The Bank, being a financial institution, must have sufficient resources to meet the credit needs of the MSMEs. Since profitability is an index of the efficiency of a banking enterprise, a profit making bank can infuse confidence in the public at large which is necessary for its survival and growth. Thus, it is necessary that every institution must earn an adequate return on its capital to undertake social obligations. This paper deals with the financial analysis of SIDBI. An attempt has been made to analyze the financial performance of the Bank by using tools like percentage, ratio analysis. The financial performance of the Bank has been highlighted through reviewing the balance sheet, profit and loss account and thereafter financial analysis through financial ratios. The financial performance has been analyzed for the period of the last 10 years from 2006-07 to 2015-16. By reviewing the balance sheet and profit and loss account of Bank, it is found that the majority of the parameters taken shows an increasing trend during this period
Keywords: balance sheet, profit and loss account, financial ratios.
INTRODUCTION
MSME sector is a significant sector in the developing economy. It contributes major proportion in country’s GDP, employment, export and production. This sector has continued to increase its contribution in India’s economic development. it contribute almost 40% of the gross industrial value added, 45% of the total export and is the second largest employers of human recourses after agriculture in India . Through 90 percent of industrial units in the country, the sector provides employment to about 60 million persons.
Realizing the importance of MSMEs in industrial development of the country , a network of institution has been set up at the central as well as state level to cater to the needs of small scale industries. Finance is the key input for sustained growth of small scale sector and its accessibility continues to be a matter of concern. The financial need of small scale industries is diverse. Credit requirements of the small scale industries are basically of two types, viz. long term loans and working capital. They need credit to fund their working capital needs on a day-to-day basis as well as long term needs like emergencies or other income related activities. They need credit to smoothen out seasonal fluctuations in cash flow arising from agricultural activities and consumer demand. They also need fund for venture capital and risk capital. Credit is one of the critical inputs for the promotion and development of the MSMEs. To facilitate timely and adequate credit to MSME sector, the Government has taken several initiatives. To meet these credit needs they need access to financial institutions that can provide them with credit at lower rates and at reasonable terms than the traditional money lender. And the formation of SIDBI is an attempt towards it.
OBJECTIVE OF THE STUDY
RESEARCH METHODOLGY
Data is collected from secondary sources viz. annual reports of SIDBI, RBI report on MSMEs, and from websites and books and research papers. Collected data is analyzed with the help of comparative statement, mean, percentages etc as per the requirement.
REVIEW OF LITERATURE
YEAR PARTICULARS SUMMARY
2017 S. Jency, Performance of Non-Banking Financial Institution
The paper analyzes the financial performance of All India Financial Institution, Non-Banking Financial Institutions for the year 2015 and 2016. It is found that out of four AIFI’s under RBI, SIDBI’s financial result is better than the other three institution.
2006 Tarak Shah and
AnshuKhedkar, Case Study on SIDBI – A Successful Financial Institution in SME Financing
Highlights the role of SIDBI in financing MSME sector. Financial analysis of Bank for the years 2002 to 2004 is also done and it is found that net income, net worth , net profit shows increasing trend during this period. It can be said that the financial performance of SIDBI during this period is found satisfactory.
A PROFILE OF SIDBI
SIDBI has completed 25 years of dedicated services to MSME sector. It plays an important role in the development of the sector. With the passage of time, various changes has been made in its operation and working. There were two amendments made in the SIDBI Act which changed various provisions of the bank relating to capital structure, share holding pattern, management, business borrowing etc. Also consequent upon amendment in the SIDBI Act, the bank has been delinked from IDBI w.e.f. 27th March 2000.
SIDBI was aimed to help for the growth and development of MSMEs in India. It was established as the refinancing institution to banks and SFCs for lending to small scale industries. SIDBI has expanded its activities; it includes direct credit through various products and services, providing support to Micro Finance Institutions. It almost had a monopoly in refinancing the small scale units. SIDBI has also started tying up with other nationalized and commercial banks in this regard that can help it gain some more visibility and selling the products that need aggressive marketing.
It also acts as the agent of government schemes and services for MSMEs.It is also synonym to developmental banking as they have soft corner for the SME’s and for thissection of industry they have liberal policies, promote and develop small scale industries. Helping and guiding entrepreneur is also one of the functions and duties of SIDBI. By providing financial and developmental support, SIDBI endeavors to create a niche in providing solutions for MSME domain and complement the efforts of banks and FIs in addressing the gaps in financial and non-financial needs of the MSME sector. This re-oriented strategy of the Bank will facilitate the higher growth path for the MSME sector.
FINANCIAL PERFORMANCE OF SIDBI
As explained above, SIDBI is the apex bank for the development of MSMEs sector in India. It renders various services for the development of the sector. Thus it is important for the Bank to stay financially strong. The sound financial health of the Bank is the guarantee not only to its customers but also significant for the stockholders, employees and for an economy.
statements. Principal financial statements are balance sheet and profit and loss account. The important components of these financial statements include share capital, net worth, borrowings and deposits, loans and advances, total income, interest income, dividend income etc.
DATA ANALYSIS AND INTERPRETATION Financial highlights of SIDBI
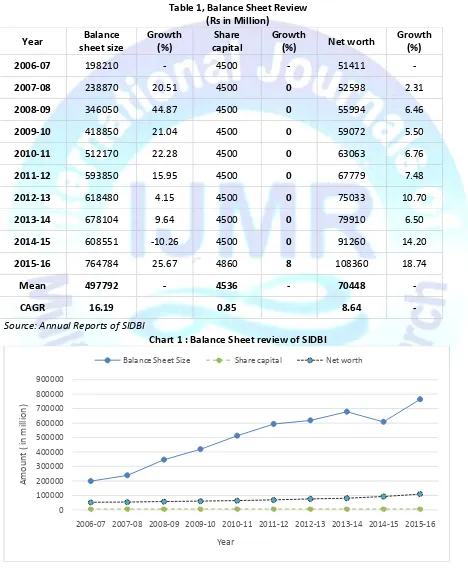
Table 1, Balance Sheet Review (Rs in Million)
Year Balance
sheet size
Growth (%)
Share capital
Growth
(%) Net worth
Growth (%)
2006-07 198210 - 4500 - 51411 -
2007-08 238870 20.51 4500 0 52598 2.31
2008-09 346050 44.87 4500 0 55994 6.46
2009-10 418850 21.04 4500 0 59072 5.50
2010-11 512170 22.28 4500 0 63063 6.76
2011-12 593850 15.95 4500 0 67779 7.48
2012-13 618480 4.15 4500 0 75033 10.70
2013-14 678104 9.64 4500 0 79910 6.50
2014-15 608551 -10.26 4500 0 91260 14.20
2015-16 764784 25.67 4860 8 108360 18.74
Mean 497792 - 4536 - 70448 -
CAGR 16.19 0.85 8.64 -
Source: Annual Reports of SIDBI
Chart 1 : Balance Sheet review of SIDBI
0 100000 200000 300000 400000 500000 600000 700000 800000 900000
2006-07 2007-08 2008-09 2009-10 2010-11 2011-12 2012-13 2013-14 2014-15 2015-16
A
m
o
unt
(
in
m
ill
io
n)
Year
Interpretation :Table 1 shows the balance sheet review of Bank over the last 10 years. It is observed from the table and chart balance sheet size shows increasing trend except for the year 2014-15 in which it witnessed negative growth of 10%. CAGR for balance sheet size during the period is 16.19 %.
Paid up capital of SIDBI was fixed at Rs 4,500 million during the period from 2006-07 to 2014-15 an it increased to Rs 4,860 million in 2015-16. The net worth of SIDBI during the period of the study shows increasing trend with average increase of Rs 70448 million and CAGR of 8.64 %.
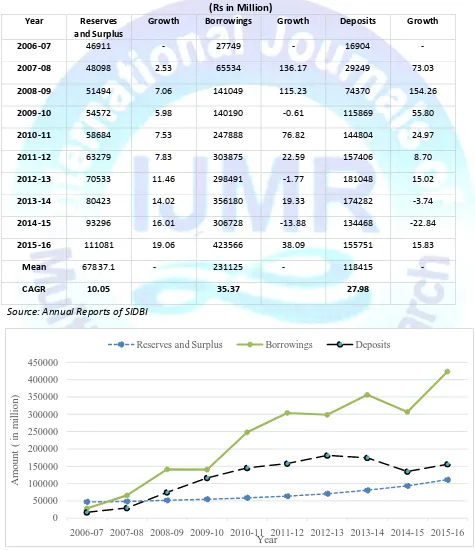
Table 2 : Financial Resources of SIDBI (Rs in Million)
Year Reserves
and Surplus
Growth Borrowings Growth Deposits Growth
2006-07 46911 - 27749 - 16904 -
2007-08 48098 2.53 65534 136.17 29249 73.03
2008-09 51494 7.06 141049 115.23 74370 154.26
2009-10 54572 5.98 140190 -0.61 115869 55.80
2010-11 58684 7.53 247888 76.82 144804 24.97
2011-12 63279 7.83 303875 22.59 157406 8.70
2012-13 70533 11.46 298491 -1.77 181048 15.02
2013-14 80423 14.02 356180 19.33 174282 -3.74
2014-15 93296 16.01 306728 -13.88 134468 -22.84
2015-16 111081 19.06 423566 38.09 155751 15.83
Mean 67837.1 - 231125 - 118415 -
CAGR 10.05 35.37 27.98
Source: Annual Reports of SIDBI
0 50000 100000 150000 200000 250000 300000 350000 400000 450000
2006-07 2007-08 2008-09 2009-10 2010-11 2011-12 2012-13 2013-14 2014-15 2015-16
A
m
o
un
t
(
in
m
il
li
on
)
Year
Interpretation:Table 2 shows the financial resources of SIDBI during the period of the study. From the table it is found that the reserves and surplus of the Bank is in increasing trend. Total reserves and surplus of SIDBI during the period was increased from Rs 46911 million in the year 2006-07 to Rs 111080 million in the year 2015-16 with the CAGR of 10.05 %..
Borrowing of Bank shows increasing trend throughout the period. As per the table, total borrowings of the bank increased from Rs 27749 million in 2006-07 to Rs 423566 million in 2015-16 with the CAGR of 35.37 %. Similarly deposits also shows increasing trend, it increased with average Rs 118415 million with CAGR of 27.98 %.
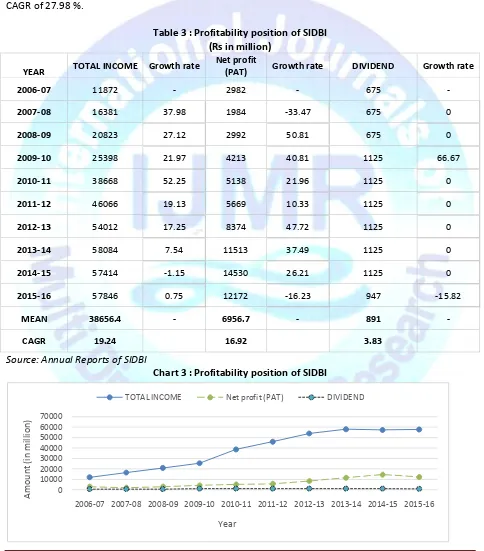
Table 3 : Profitability position of SIDBI (Rs in million)
YEAR TOTAL INCOME Growth rate
Net profit
(PAT) Growth rate DIVIDEND Growth rate
2006-07 11872 - 2982 - 675 -
2007-08 16381 37.98 1984 -33.47 675 0
2008-09 20823 27.12 2992 50.81 675 0
2009-10 25398 21.97 4213 40.81 1125 66.67
2010-11 38668 52.25 5138 21.96 1125 0
2011-12 46066 19.13 5669 10.33 1125 0
2012-13 54012 17.25 8374 47.72 1125 0
2013-14 58084 7.54 11513 37.49 1125 0
2014-15 57414 -1.15 14530 26.21 1125 0
2015-16 57846 0.75 12172 -16.23 947 -15.82
MEAN 38656.4 - 6956.7 - 891 -
CAGR 19.24 16.92 3.83
Source: Annual Reports of SIDBI
Chart 3 : Profitability position of SIDBI
0 10000 20000 30000 40000 50000 60000 70000
2006-07 2007-08 2008-09 2009-10 2010-11 2011-12 2012-13 2013-14 2014-15 2015-16
A
m
o
unt
(i
n
m
ill
io
n)
Year
Interpretation:Table 3 depicts the profitability position of Bank during the period of the study. Total income of Bank during the period increased from Rs 11872 million to Rs 57846 million with CAGR of 19.24 % . Total income of Bank shows increasing trend throughout the period. Similarly, net income of Bank also increased with average increase of Rs 6956 million and CAGR of 16.92 %. Dividend declare by SIDBI was increased from Rs 675 million in 2006-07 to Rs 1125 million in 2014-15. In the FY 2015-16, it decreased to Rs 947 million.
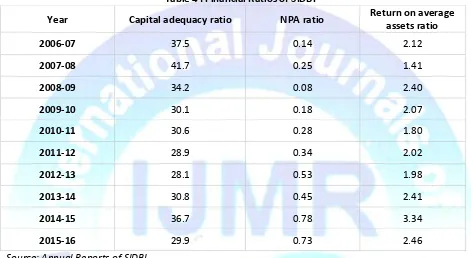
Table 4 : Financial Ratios of SIDBI
Year Capital adequacy ratio NPA ratio Return on average
assets ratio
2006-07 37.5 0.14 2.12
2007-08 41.7 0.25 1.41
2008-09 34.2 0.08 2.40
2009-10 30.1 0.18 2.07
2010-11 30.6 0.28 1.80
2011-12 28.9 0.34 2.02
2012-13 28.1 0.53 1.98
2013-14 30.8 0.45 2.41
2014-15 36.7 0.78 3.34
2015-16 29.9 0.73 2.46
Source: Annual Reports of SIDBI
Interpretation: Above table shows the trend of financial ratios of SIDBI during the last 10 years. It can be observed that the CAR of SIDBI is at fairly comfortable level against prescribed by RBI which is 9%. It stood higher at 41.70% in the year 2007-08 which depicts that SIDBI had idle funds in that period.Net NPA of SIDBI was increased from 0.14 % to 0.78% during the period of the study.ROA of SIDBI was increased from 2.14 to 2.45 during the period of the study. Thus it can be concluded that SIDBI financial performance is highly satisfactory.
CONCLUSION
REFERENCES
Report of the working group on MSMEs for 12th Five Year Plan 2012-17.
Report of PM’s Task force on MSMEs (2010), Government of India.
Annual reports of SIDBI , 2006-07 to 2015-16.
Srivastava, R.M. and Nigam, Divya (2008).Management of Indian Financial Institutions. Himalaya Publishing House, Mumbai.
Shah, Tarak and Khedkar, Anshu (2006). SIDBI – A Successful Financial Institution in SME Financing.Indian Institute of Planning and Management (IIPM) Ahmedabad.
Saleem (1995). Profitability Analysis: An Overview. Indian Banking: Today and Tomorrow, September, 1995.