THE IMPACT OF INCOME INEQUALITY ON ECONOMIC GROWTH IN VIETNAM: AN EMPIRICAL ANALYSIS
Quoc Hoi Le1+
Hoai Nam Nguyen2
1National Economics University, Vietnam.
2Vinh University, Vietnam.
(+ Corresponding author)
ABSTRACT
Article History Received: 26 February 2019 Revised: 1 April 2019 Accepted: 6 May 2019 Published: 17 May 2019
Keywords
Channel Distribution Education Growth Inequality Vietnam.
JEL Classification: Q4; I3.
This paper tests the theoretical models proposed in the literature to explain the impact of income inequality on economic growth at the provincial level in Vietnam. The results show a weak direct link between initial inequality and subsequent economic growth. However, income inequality affects economic growth through several channels. There is strong empirical support for the negative impact of inequality on growth via the education/fertility channel. The data also supports capital market imperfection. By contrast, there appears to be less empirical support for explanations based on the distribution channel. The results indicate that the channels through which income inequality leads to higher economic growth are offset by the opposing channels through which inequality harms growth. Based on the findings the paper proposes policy measures that could be implemented by the government to narrow the gap between the rich and the poor in Vietnam and ensure a fairer distribution of economic resources.
Contribution/ Originality: This paper is one of few studies to have investigated the impact of income inequality on economic growth as well as the channels through which income inequality affects economic growth in Vietnam. The paper’s primary contribution is finding that income inequality affects economic growth through the capital market imperfection and education/fertility channels.
1. INTRODUCTION
The links between growth and inequality have long been investigated1. Earlier researchers like Lewis (1954)
and Kuznets (1955) were primarily interested in the distributional consequences of economic development. In
recent years, the reinvigorated interest in the endogenous growth theory has fuelled substantial research into the exploration of the impact of inequality on growth. While the emerging dominant view is that inequality is harmful for growth (Alesina and Rodrik, 1994; Persson and Tabellini, 1994; Perotti, 1996; Deininger and Squire, 1998;
Aghion et al., 1999; Easterly, 2001; Castelló and Doménech, 2002) some researchers have provided evidence to the
contrary (Partridge, 1997; Li and Zou, 1998; Forbes, 2000). One way to explain this contradiction is that there are many opposing mechanisms through which inequality can affect growth and that the net effects of inequality on growth are ambiguous. Theoretically, the channels through which this effect is transmitted differ in accordance
1Ehrhart (2009) provides a comprehensive survey of theoretical and empirical development in this field.
Asian Economic and Financial Review
ISSN(e): 2222-6737 ISSN(p): 2305-2147
DOI: 10.18488/journal.aefr.2019.95.617.629 Vol. 9, No. 5, 617-629
with the model used. Chiu (1998); Aghion and Bolton (1997); Galor and Zeira (1993) and Saint-Paul and Verdier
(1993) provided a model to show that the inequality-growth link is shown via the imperfection of capital market.
Borck (2007); Bao and Guo (2004); Alesina and Rodrik (1994); Persson and Tabellini (1994) and Bertola (1993) built
a model to explain that inequality harms growth through redistribution. The social-political instability model built
by Benhabib and Rustichini (1996) and Grossman and Kim (1996) emphasised the impact of inequality on growth
via political instability and social unrest. The Perotti (1996) suggested that inequality has a negative effect on growth through investments in human capital. Benabou (1996) provided an integrated model in which the effect of inequality on growth is not necessarily linear. The models of De La Croix and Doepke (2003); Kremer and Chen
(2000) and Perotti (1996) suggested that inequality has a negative effect on growth through the distortion of
household’s decisions on education and fertility. Another model of Knell (1998) showed that social comparisons coming from the society’s perception of inequality lead to low growth. Whatever the mechanism, the link between inequality and growth has been examined in different cross-country studies with somewhat contrasting results. This can be explained by that fact that the mechanisms through which inequality leads to higher growth may be offset by the opposing mechanisms through which inequality harms growth.
Another issue is that reliable empirical testing of the growth-inequality link in the literature has been hampered by the lack of the quality and comparability of data. Several empirical studies in this field are based primarily on cross-section country data and suffer from a lack of uniformity. As the countries under consideration are at different stages of economic development, using the available cross-country data to test the various hypotheses of the link between growth and inequality does not yield conclusive results. In addition, most empirical studies in the literature do not measure income inequality in a consistent manner. Due to the lack of comparable data, researchers have been forced to combine heterogeneous non-comparable inequality data based on gross income, net income, consumption, expenditure and concerning individuals and households. However, combining inequality data that are not consistently measured in the same sample is an inadequate procedure and this may affect the results in different ways2.
Vietnam is one of the fastest growing economies in Asia. Several studies have been carried out on income inequality. Some of them studied the relationship between poverty and inequality (Fritzen, 2002; Le, 2009); others explored the effect of economic growth on income inequality (Le and Chu, 2016). However, not many studies have been specifically carried out to examine the impact of income inequality on economic growth as well as the channels through which inequality affects growth. Thus, this paper will provide a deeper understanding of the impact of income inequality on economic growth by identifying the channels through which the impact is felt.
Most available studies on inequality and economic growth in Vietnam focus on national or regional inequality. However, this paper will explore the impact of income inequality on economic growth in Vietnam by using provincial data on income inequality. While provinces are socio-economic entities in their own right, they are particularly relevant for studying the relationship between growth and inequality since they are less arbitrary spatial-economic units compared to cross-sections of countries, and they represent economies that are at relatively similar stages of development. As pointed out by Partridge (1997) cross-country data sets exhibit tremendous institutional and cultural differences, either between nations’ cross-sections or within a given nation across time. Thus, it is less likely to expect that estimated coefficients are stable throughout the entire range of observations in the cross-country data sets, but provinces are sufficiently similar such that it is reasonable to expect that one model is sufficiently suitable for all provinces.
As most of the relevant data for provinces are only obtained from the General Statistic Office of Vietnam, the issue of non-uniform methodologies and definition does not pose a serious problem when dealing with provinces. In
2 Inequality data may differ because of the type of survey they are derived from, whether it is an income, consumption or expenditure survey. Another problem is that
particular, the advantage of using provincial data is that the measures are collected using national surveys, making it more certain that the data is comparable across provinces. By contrast, the cross-country data used by many studies in the literature is constructed with very different instruments, making it uncertain how comparable the data is across countries. Hence, this study on the relationship between income inequality and growth is more reliable than many of the studies in the literature.
The paper is organized into several sections. Section two briefly reviews the various existing theoretical arguments and empirical evidence on the mechanisms through which inequality affects economic growth. Section three presents the empirical framework used to test the impact of income inequality on economic growth. The empirical results and discussions are presented in section four, and section five contains the concluding remarks.
2. THEORETICAL FRAMEWORK AND EMPIRICAL EVIDENCE
The work of Kuznets (1955) is the starting point for examining the links between inequality and growth. Kuznets hypothesized that growth and inequality are related in an inverted U-shaped curve. One implication of the Kuznets hypothesis is that if, in early stages, economic growth leads to more inequality, then poverty might take many years to decrease in the developing world. Several studies have tried to examine the links between inequality and growth.
Rather than focusing on the Kuznets hypothesis, the interest in the endogenous growth theory has provided substantial theoretical models to explore the impact of inequality on growth. There are six main families of theoretical models which examine the link between growth and inequality and explore the channels through which this link is transmitted. They are the political economy model (PE in the remainder of this paper), the capital market imperfection model (CM), the integrated model (INT), the socio-political instability model (PI), the fertility/education issue model (FE), and the social comparisons model (SC). We will now briefly review these theoretical models.
The PE model can be found in the works of Borck (2007); Bao and Guo (2004); Alesina and Rodrik (1994);
Persson and Tabellini (1994) and Bertola (1993). This model builds a bridge between theories of endogenous
growth and theories of endogenous political economy. In democratic societies, the level of taxation is decided by the median voter. Taxation is assumed to be proportional to income, and public expenditure progressive as tax revenues are redistributed lump-sum to everyone. Hence, the benefit received by the poor is greater than the benefits received by the rich. Thus, the poor would prefer a high level of taxation-redistribution. Since in unequal societies the income of the median voter is slower than the mean income, majority rule would dictate a high level of redistribution which in turn discourages investment by depressing its net return and lowers growth. The negative impact of inequality would be attenuated by the degree of wealth bias of the system against the poor. The more a society moves away from the democratic archetype of “one man, one vote”, the less possible it becomes to reduce the level of inequality through redistribution. Chletsos and Fatouros (2016) empirically investigated the effect of income inequality on growth using panel of 126 countries from 1968 to 2007 and found a positive effect through the taxation channel.
The CM model was provided by the works of Chiu (1998); Aghion and Bolton (1997); Galor and Zeira (1993)
and Saint-Paul and Verdier (1993). This model is based on the role played by imperfections in the capital markets.
Specifically, in societies where agents do not have free access to borrowing, inequality implies that a relatively large share of the population is below the threshold cost of education. Therefore, investment in human capital is low, and if growth is enhanced by investment in human capital, growth is low too. Supporting this theory, Akpolih and
Farayibi (2012) conducted an empirical study on the magnitude of inequality as a barrier to economic growth in
more important in poor economies than in rich ones. Therefore, the predicted effects of inequality on economic growth would be larger in magnitude for poor economies than for rich ones. Herzer and Vollmer (2012)
investigated the impact of income inequality on per capita GDP in 46 countries in the 1970-1995 period. They showed that income inequality has a negative impact on GDP growth because investment in human capital could be lower for unequal income distributions in the presence of credit market imperfections.
The INT model was developed by Benabou (1996). This model provides an integrated framework in which the impact of redistribution on growth is not necessarily linear. There are two opposite effects. Redistribution is good if public expenditure goes to financial education in a world with imperfect capital markets, and bad if it only transfers income from the rich to the poor because it depresses the net return to investment of the rich. Therefore, growth is inverted-U shaped with respect to redistribution and distribution is U-shaped with respect to inequality. Dahan and
Tsiddon (1998) emphasized that inequality affects the growth rate in a different way at each stage during the
process of development. Specifically, during the first stage of development, an unequal income distribution is a necessary condition for economic growth to take off since the economy is relatively poor and only the rich can invest in human capital. When economic growth takes off, income inequality widens and the worsening in wage inequality between skilled and unskilled workers gradually incites the poor to invest in education. As a result, economic growth is boosted by a more equal distribution of human capital and earned income. Thus, during the last stages of development, a greater equality in the distribution of income raises the long-term growth rate by allowing an increasing proportion of individuals to invest in human capital.
The PI model was presented by Keefer and Knack (2000); Benhabib and Rustichini (1996) and Grossman and
Kim (1996). This model emphasises the consequence of inequality on political instability and social unrest.
According to the PI model, inequality is an important determinant of socio-political instability and this has negative effects on growth through lower expected returns to investment. Specifically, inequality exacerbates social conflict which in turn makes property rights less secure and reduces growth. The participation of the poor in crime and other anti-social actions represents a direct waste of resources because the time and energy of the criminals are not devoted to productive efforts. Defensive efforts by potential victims represent a further loss of resources. Economic activity is also negatively affected by violence and crime through discouraging private domestic, tourism activities and inflows of foreign investments. Therefore, the redistribution of income and assets can stimulate economic growth by promoting a more stable and less uncertain socio-political environment and by reducing the participation of the poor to criminal and illegal activities. According to a report by the United Nations (2013) a massive increase in income inequality and a rise in debt to income ratio in lower/middle income households led to the great depression of the 1930’s and the 2007-2008 economic crisis. In addition, Scheuermeyer and Grundler (2015) showed that an increase in crime rates leads to political instability and that this prevents both domestic and foreign investors from investing in the country.
The FE model was designed by De La Croix and Doepke (2003); Kremer and Chen (2000); and Perotti (1996). According to the FE model, inequality has a negative effect on economic growth through the distortion of the households’ decisions on education and fertility. Parents have to optimise the use of the household’s resources, alternatively through an improvement in quality (education) or in quantity (fertility) of their offspring. Since education has a cost equal to the income foregone while at school, while poor households do not invest in human capital but in the quantity of children, rich households can afford their children and reduce their fertility rate. However, because growth is basically promoted by investment in human capital, a relatively large number of poor households will invest in quantity rather than education in a society with high inequality. Consequently, the high fertility rate of this society leads to low growth.
are tempted to conform to the norms and to fulfil social needs and expectations by engaging in higher consumption activities and by lowering investment in human capital in order to reduce the gap with rich households. These activities maximise present welfare but go to the detriment of future welfare and growth. Supporting this theory,
Scheuermeyer and Grundler (2015) showed that in developing countries, inequality leads to unequal opportunities
because poorer people are not able to exploit their full potential as they cannot afford the costs of a good education. As a result, this affects the average productivity of each individual and in turn the overall growth of the country.
3. EMPIRICAL FRAMEWORK
The first purpose of the paper was to explore the relationship between initial inequality and subsequent growth at the provincial level of Vietnam. As per the previous empirical studies (Alesina and Rodrik, 1994; Persson and
Tabellini, 1994; Perotti, 1996; Knowles, 2001) the following reduced form estimation was used:
i i
i
X
INEQ
GROWTH
1
2
(1)Where GROWTH is the average growth rate of GDP in a province over the 1998 - 2008 period and INEQ is a measure of inequality at the beginning of the period. X is a vector of control variables which includes initial income per capita level (GDPPC), human capital (HUMCAP), investment/GDP ratio (INVEST) and total trade/GDP ratio (OPENNESS).
As the reduced form model cannot shed light on the underlying channel of the growth-inequality link, we also tested the proposed channels of transmission in order to evaluate their explanatory power in the growth-inequality link. The reduced form of the model (1) is now split into the following structural models:
i i
i
X
CHANNEL
GROWTH
1
2
(2)i i
i
W
INEQ
CHANNEL
1
2
(3)Where CHANNEL is one of the proposed channels of transmission, X and W are vectors of control variables. In this paper we tested four channels through which inequality may affect growth: redistribution, investments in human capital, fertility and imperfect capital market. We did not examine the channel of political instability since political instability has not occurred in Vietnam during the period of consideration and political stability was similar across provinces. We did not test whether the relationship between growth and inequality is nonlinear or not because the period of consideration was short.
The perception of inequality depends on the inequality index used. Indices are neither cardinally nor ordinally equivalent and some of them lack basic properties that good indices should have. We took this problem into consideration by running the econometric tests to alternative specifications of the variable INEQ. In this paper, we used two measures of inequality - the GINI coefficient and the ratio of income shares going to the top and bottom quintiles of the population (TOPBOTTOM).
(4)
Where u is mean income of the population, Pi is the income rank P of person i, with income X, such that the richest person receives a rank of 1 and the poorest a rank of N. This effectively gives higher weight to poorer people in the income distribution, which allows the GINI to meet the Transfer Principle.
In this paper, inequality of consumption expenditure rather than income was analysed because consumption is considered a better measure of human well-being. Also, relative to the income variable, consumption shows less volatility as it is not so vulnerable to idiosyncratic shocks. According to Deaton (1997) consumption data are less influenced by measurement errors, particularly for rural households.
The main drawback of the GINI coefficient is that because it is a measure of aggregate inequality, it fails to completely capture certain changes in the underlying income distribution. Deininger and Squire (1996)
recommended reporting information on the income shares by quintiles to overcome this problem. Drawing from their suggestion, we supplemented each GINI measure by TOPBOTTOM - the corresponding ratio of the total income going to the richest and the poorest 20% (quintiles) of the population. This measure has been constantly used in the literature to proxy the gap between the poor and the rich.
Apart from INEQ variable, our vector of control variables followed a standard approach widely used in the literature and includes GDP per capita level (GDPPC) at the beginning of the period (to check for the convergence hypothesis), the average ratio of investment to GDP over the period (INVEST), a measure of human capital (HUMCAP), and the average ratio of total exports and imports to GDP (OPENNESS) over the period. The best proxy for the measure of human capital has been considered as the average schooling years in the adult population. The other variable taken into consideration such as the enrolment ratio in high school can also be considered as proxies for human capital.
We then defined and chose variables for the mechanisms through which inequality affects growth. Imperfection in the capital market (CAPMARK) was measured by the average ratio of credit to the economy to GDP over the period under consideration. This measure is a proxy for the advancement of financial markets and plays an important role as a determinant of growth and inequality. Fertility (FERT) was measured by the average number of children under five years of age per woman. There are several measures of redistribution (REDISTR) which are widely used in the literature to proxy for the redistributive effort. In this paper we used the average ratio of total government expenditure to GDP and the average ratio of tax revenue to GDP.
According to the above framework, we studied how the initial values of the independent variables INEQ and GDPPC are related to subsequent GDP growth rate. This framework avoids problems of endogeneity or simultaneity bias associated with these variables. While it is true that GDPPC can affect subsequent inequality, this is a recursive relation rather than a simultaneous equation relation and hence did not influence the estimation of Equation 1. While several other variables have been suggested to be linked to growth, we decided to keep the vector of control variables relatively small, in the difficult exercise of balancing the risks of multicollinearity with the risks of omitted variable bias. We also tested the model with several alternative configurations of the controls.
To control for the possibility of different growth patterns in different regions of Vietnam, eight regional dummies for the North East, North West, Red River Delta, North Central Coast, South Central Coast, Central Highlands, South East and Mekong River Delta, were included. The basic model only included GDPPC, INVEST, HUMAN and OPENNESS. In fact, many of the other variables were found to be highly correlated to GDP, to HUMAN or to INEQ. In this case, they were considered as channels of transmission in the structural model including Equations 2 and 3.
province characteristics. To do that, we broke the data set into two periods: the 1998-2006 period and the 2008-2016 period3. The dependent variable now was the average growth rate of GDP in each period and independent
variables were measured at the beginning of each period. It is worth noting that the coefficients of the fixed effects estimate have a different interpretation from that of the OLS estimate. While the latter estimates the effect of inequality on growth across provinces, the former is considered as a measure of the effect of inequality on growth within a given province.
The model may have suffered from endogeneity if income inequality was also determined by economic growth. Therefore, the structured form of model as in Equations 2 and 3 was estimated by the Two Stages Least Square estimation method (2SLS) in order to correct any possible endogeneity of income inequality. The instruments which were used in the model included the percentage of population living in an urban area, average family size, the percentage of the population that is less than 18 years old and the percentage of the population that is more than 60 years old. These instrumental variables strongly correlated with the inequality index and did not correlate with the residuals of our regression. We also used the Wooldridge’s score test to test the null hypothesis that all variables were exogenous.
The data used in this paper came from the General Statistic Office of Vietnam. The data covered a total of 61 provinces of Vietnam. Data on GDP growth rate, investment, human capital, trade openness and GDP per capita at the provincial level from 1998 to 2016 was available. Data on the GINI coefficient and the ratio of the income of the richest to that of the poorest was computed by using data from the Vietnam living standard household surveys which are biennially implemented by the GSO. The basic statistics of the variables are provided in Table 1 in the appendix. Table 2 in the appendix provides the correlation matrix of variables used in this paper. As shown, the correlation of GDP growth rate with independent variables was weak; there was a weak possibility that the signs of these relationships may change when the regressions in Equations 1,2 and 3 were estimated.
4. EMPIRICAL RESULTS AND DISCUSSIONS
4.1. The Impact of Income Inequality on Economic Growth
The reduced form of the model as in Equation 1 tested the relationship between initial inequality and the subsequent growth rate of GDP. The results of the OLS estimator in columns 1 and 2 in Table 1 show that the coefficients of both GINI and TOPBOTTOM are negative but not significant. One question is whether GINI and TOPBOTTOM coefficients suggested two separate routes for inequality to influence growth. To address this issue, we used GINI and TOPBOTTOM variables simultaneously in the model. The results in column 3 suggest that the coefficients of both GINI and TOPBOTTOM were still negative, but not significant.
The results of the fixed effects estimator are presented in Table 2. The results in columns 1 and 2 show that while there was no significant correlation between growth and the income ratio of the top quintile to the bottom quintile, inequality measured by the GINI index had a negative and significant effect on growth (at the 10% level of significance). GINI index was still negative and significant when both measures of income inequality were included in the same regression (column 3). The estimated relationship between inequality (measured as GINI index) and growth changes when we used different estimation techniques can be explained by the fact that within-province variability is more important than cross-province variability. The results may imply that while there is no relationship between growth and inequality across provinces, inequality affects growth negatively within provinces.
3 Unfortunately, the data set only includes inequality data biennially, therefore precludes the possibility of studying the correlation between inequality and growth
Table-1. OLS estimation of the impact of inequality on growth.
Explanatory variable 1 2 3
INEQ (GINI ) -2.51 -2.63
-1.66 -1.84
INEQ (TOPBOTTOM) -0.039 -0.034
-0.027 -0.027
GDPPC 0.003 0.003 0.003
(0.001)* (0.001)* (0.001)*
INVEST 0.042 0.045 0.43
(0.02)** (0.02)** (0.02)**
HUMCAP 0.056 0.061 0.059
(0.02)** (0.03)** (0.02)**
OPENNESS 0.56 0.58 0.57
-0.35 -0.39 -0.4
Constant 1.34 0.29 1.23
-4.17 -3.92 -2.67
Observations 61 61 61
R squared 0.22 0.22 0.24
The dependent variable is the average growth rate of GDP. Standard errors are in parentheses. *, **, and *** denote significance at 1%, 5% and 10% level respectively.
Table-2. Fixed effects estimation of the impact of inequality on growth.
Explanatory variable FE FE FE
1 2 3
INEQ (GINI ) -3.13 -3.66
(1.64)*** (1.88)***
INEQ (TOPBOTTOM) -0.042 -0.037
-0.029 -0.026
GDPPC 0.002 0.003 0.003
(0.001)** (0.001)* (0.001)*
INVEST 0.051 0.075 0.48
(0.02)** (0.03)** (0.02)**
HUMCAP 0.046 0.054 0.06
(0.02)** (0.03)** (0.03)**
OPENNESS 0.63 0.82 0.76
-0.51 -0.59 -0.61
Constant 3.96 3.91 3.23
-4.76 -4.97 -2.98
Hausman test 11.61* 10.13* 9.76**
Observations 61 61 61
R squared 0.26 0.25 0.27
The dependent variable is the average growth rate of GDP. Standard errors are in parentheses. *, **, and *** denote significance at 1%, 5% and 10% level respectively.
These results of a weak relationship between inequality and economic growth can be explained by there being many opposing mechanisms through which inequality can affect growth. The results presented here indicated that, on the whole, the mechanisms through which inequality leads to higher growth were offset by the opposing mechanisms through which inequality harms growth. Another possible explanation for these results as pointed out
by Partridge (1997) was that the degree of income inequality is smaller within provinces than in the nation as a
whole because of the independent role of the central government. Thus, we may not observe as strong a relationship between income inequality and growth across provinces as other authors have previously observed across countries.
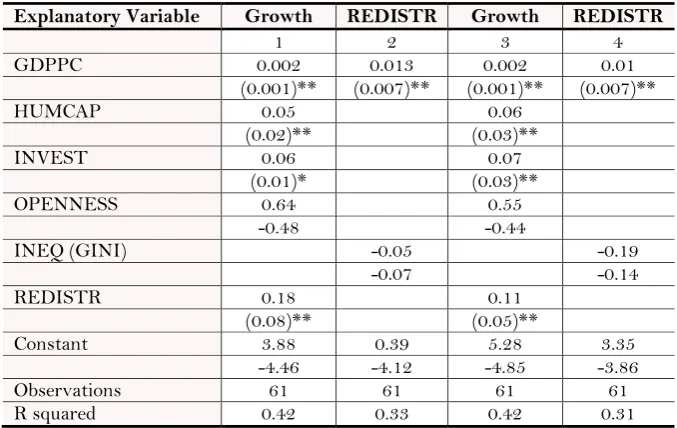
4.2. Channels of the Impact of Income Inequality on Economic Growth 4.2.1. The Redistribution Channel
structural model. Using the average ratio of tax revenues to GDP as a measure of redistribution in column 2, we found that the sign of INEQ wasnegative but not significant. We got a similar result, that inequality plays essentially no role, when another alternative definition of redistribution (the average ratio of government expenditure to GDP in column 4) was included in the equation. Therefore the PE model was not justified by empirical evidence in Vietnam.
Table-3. The redistribution channel.
Explanatory Variable Growth REDISTR Growth REDISTR
1 2 3 4
GDPPC 0.002 0.013 0.002 0.01
(0.001)** (0.007)** (0.001)** (0.007)**
HUMCAP 0.05 0.06
(0.02)** (0.03)**
INVEST 0.06 0.07
(0.01)* (0.03)**
OPENNESS 0.64 0.55
-0.48 -0.44
INEQ (GINI) -0.05 -0.19
-0.07 -0.14
REDISTR 0.18 0.11
(0.08)** (0.05)**
Constant 3.88 0.39 5.28 3.35
-4.46 -4.12 -4.85 -3.86
Observations 61 61 61 61
R squared 0.42 0.33 0.42 0.31
2SLS. Standard errors are in parentheses. *, **, and *** denote significance at 1%, 5% and 10% level respectively.
The results in columns 1 and 3 in Table 3 did not support the hypothesis that redistribution has a negative impact on growth. However, the coefficients of REDISTR (measured by the average ratio of tax revenues to GDP in column 1 and by the average ratio of government expenditure to GDP in column 3) were positive and significant. This finding emphasized the distortionary effects of government expenditure and/or taxation. This was also in line with the finding of reduced form regressions in Easterly and Rebelo (1993).
4.2.2. The Imperfect Capital Market Channel
The results in column 2 in Table 4 showed that INEQ had a negative and significant sign, and CAPMARK had a positive and significant sign. This implied that while high inequality leads to low investment in human capital, improvements in capital markets promoted investment in human capital. The results in column 1 indicated that investment in human capital enhances growth as the coefficient on HUMCAP was positive and significant. Therefore, the imperfect capital market model was supported by the data.
Another way to test for the role of imperfect capital market was to examine the role of redistribution. The results of testing the impact of redistribution on human capital in column 3 showed that REDISTR had a positive and significant sign. This reinforced the argument that redistribution increases growth because it allows the poor to invest in human capital.
4.2.3. The Fertility Channel
fertility is the channel through which high inequality leads to low growth. This channel can be considered as a complementary approach to conclude that the fertility-education issue was the mechanism through which income inequality affects economic growth.
Table-4. The imperfect capital market channel.
Explanatory Variable Growth HUMCAP HUMCAP
1 2 3
GDPPC 0.002 0.002 0.002
(0.001)** (0.001)** (0.001)**
HUMCAP 0.051
(0.02)*
INVEST 0.035
(0.007)*
OPENNESS 0.09
-0.24
INEQ (GINI) -0.15
(0.04)*
CAPMARK 0.05 0.05
(0.02)** (0.02)**
REDISTR 0.04
(0.01)**
Constant 1.34 5.2 4.12
-3.87 -4.75 -3.54
Observations 61 61 61
R squared 0.4 0.31 0.28
2SLS. Standard errors are in parentheses. *, **, and *** denote significance at 1%, 5% and 10% level respectively.
Table-5. The fertility channel.
Explanatory variable Growth FERT HUMCAP
1 2 3
GDPPC 0.002 -0.01 0.05
(0.001)** (0.007)** (0.01)*
HUMCAP 0.06 -0.17
(0.01)* (0.05)*
INVEST 0.07 0.02
(0.03)** (0.009)**
OPENNESS 0.55 0.06
-0.44 -0.04
INEQ (GINI) 0.19
(0.04)*
FERT -0.02 -0.29
(0.007)* (0.11)*
Constant 5.28 3.35 2.51
-4.85 -3.86 -2.65
Observations 61 61 61
R-square 0.42 0.31 0.21
2SLS. Standard errors are in parentheses. *, **, and *** denote significance at 1%, 5% and 10% level respectively.
5. CONCLUDING REMARKS
The next step in the paper in gaining a deeper understanding of the inequality-growth relationship involved isolating and testing various mechanisms to determine their relative importance to the growth process. First, we found that the fiscal mechanism was the least supported by data. High inequality does not lead to more redistribution, but redistribution has a positive impact on growth. Second, there was strong evidence to support the imperfect capital market mechanism. Financial development may promote high economic growth because it helps the poor invest in human capital. Low inequality leads to a high level of human capital which has a positive effect on growth. Third, the fertility mechanism was completely supported by data since high inequality is associated with high fertility which in turn leads to low economic growth.
Given the empirical findings in this paper, we can point out some policy implications. First, it is necessary to point out that discerning no relationship between inequality and growth through redistribution channel does not mean that redistributive policies are undesirable. But it does imply that when growth is the main objective, that redistributive policies should be pursued with caution and that the policies that are least distortionary in the economic sense should be chosen. Second, to reduce the negative impact of inequality on growth, it is necessary to improve human capital and reduce the fertility rate in provinces. Third, the different inequality-growth relationships between provinces and within provinces imply that the government should target reducing the negative impact of inequality on growth at provinces with high inequality and low development levels.
Funding: This study received no specific financial support.
Competing Interests: The authors declare that they have no competing interests.
Contributors/Acknowledgement: Both authors contributed equally to the conception and design of the
study.
REFERENCES
Aghion, P. and P. Bolton, 1997. A theory of trickle-down growth and development. The Review of Economic Studies, 64(2): 151-172.Available at: https://doi.org/10.2307/2971707.
Aghion, P., E. Caroli and C. Garcia-Penalosa, 1999. Inequality and economic growth: The perspective of the new growth theories. Journal of Economic Literature, 37(4): 1615-1660.Available at: https://doi.org/10.1257/jel.37.4.1615. Akpolih, A.R. and A.O. Farayibi, 2012. Economic growth and inequality in Nigeria: Magnitudes and challenges. MPRA Paper
No. 74156.
Alesina, A. and D. Rodrik, 1994. Distributive politics and economic growth. The Quarterly Journal of Economics, 109(2): 465-490.
Bao, Y. and J.-T. Guo, 2004. Reexamination of economic growth, tax policy, and distributive politics. Review of Development Economics, 8(3): 474-482.Available at: https://doi.org/10.1111/j.1467-9361.2004.00246.x.
Benabou, R., 1996. Inequality and growth. NBER Macroeconomics Annual, 11(1996): 11-74.
Benhabib, J. and A. Rustichini, 1996. Social conflict and growth. Journal of Economic Growth, 1(1): 125-142.Available at: https://doi.org/10.1007/bf00163345.
Bertola, G., 1993. Factor shares and savings in endogenous growth. The American Economic Review, 83(5): 1184-1198. Borck, R., 2007. Voting, inequality and redistribution. Journal of Economic Surveys, 21(1): 90-109.Available at:
https://doi.org/10.1111/j.1467-6419.2007.00265.x.
Castelló, A. and R. Doménech, 2002. Human capital inequality and economic growth: Some new evidence. The Economic Journal, 112(478): C187-C200.Available at: https://doi.org/10.1111/1468-0297.00024.
Chiu, W.H., 1998. Income inequality, human capital accumulation and economic performance. The Economic Journal, 108(446): 44-59.Available at: https://doi.org/10.1111/1468-0297.00272.
Chletsos, M. and N. Fatouros, 2016. Does income inequality matter for economic growth?: An empirical investigation. MPRA Paper, No.75477.
Dahan, M. and D. Tsiddon, 1998. Demographic transition, income distribution, and economic growth. Journal of Economic Growth, 3(1): 29-52.
De La Croix, D. and M. Doepke, 2003. Inequality and growth: Why differential fertility matters. American Economic Review, 93(4): 1091-1113.Available at: https://doi.org/10.1257/000282803769206214.
Deaton, A., 1997. The analysis of household surveys: A micro-econometric approach to development policy. Baltimore and London: Johns Hopkins University Press.
Deininger, K. and L. Squire, 1996. Measuring income inequality: A new database. World Bank Economic Review, 10(3): 565-591. Deininger, K. and L. Squire, 1998. New ways of looking at old issues: Inequality and growth. Journal of Development
Economics, 57(2): 259-287.Available at: https://doi.org/10.1016/s0304-3878(98)00099-6.
Easterly, W., 2001. The lost decades: Developing countries' stagnation in spite of policy reform 1980–1998. Journal of Economic Growth, 6(2): 135-157.
Easterly, W. and S. Rebelo, 1993. Fiscal policy and economic growth. Journal of Monetary Economics, 32(3): 417-458.
Ehrhart, C., 2009. The effects of inequality on growth: A survey of the theoretical and empirical literature. ECINEQ Working Paper, No. 107.
Forbes, K.J., 2000. A reassessment of the relationship between inequality and growth. American Economic Review, 90(4): 869-887.Available at: https://doi.org/10.1257/aer.90.4.869.
Fritzen, S., 2002. Growth, inequality and the future of poverty reduction in Vietnam. Journal of Asian Economics, 13(5): 635-657.Available at: https://doi.org/10.1016/s1049-0078(02)00173-2.
Galor, O. and J. Zeira, 1993. Income distribution and macroeconomics. The Review of Economic Studies, 60(1): 35-52.
Grossman, H.I. and M. Kim, 1996. Predation and accumulation. Journal of Economic Growth, 1(3): 333-350.Available at: https://doi.org/10.1007/bf00141042.
Herzer, D. and S. Vollmer, 2012. Inequality and growth: Evidence from panel cointegration. The Journal of Economic Inequality, 10(4): 489-503.Available at: https://doi.org/10.1007/s10888-011-9171-6.
Keefer, P. and S. Knack, 2000. Polarization, politics and property rights. World Bank Policy Research Working Paper, No. 2418. Knell, M., 1998. Social comparison, inequality and growth. Mimeo: University of Zurich.
Knowles, S., 2001. Inequality and economic growth: The empirical relationship reconsidered in the light of comparable data. Credit Research Paper, No. 01/03.
Kremer, M. and D. Chen, 2000. Income distribution dynamics with endogenous fertility. NBER Working Paper, No. 7530. Kuznets, S., 1955. Economic growth and income inequality. The American economic review, 45(1): 1-28.
Le, Q.H., 2009. The linkages between growth, poverty and inequality in Vietnam: An empirical analysis. Working Paper. Le, Q.H. and M.H. Chu, 2016. Credit market depth and income inequality in Vietnam: A panel-data analysis. Journal of
Economics and Development, 18(2): 5-18.
Lewis, W.A., 1954. Economic development with unlimited supplies of labour. The Manchester School, 22(2): 139-191.Available at: https://doi.org/10.1111/j.1467-9957.1954.tb00021.x.
Li, H. and H.-F. Zou, 1998. Income inequality is not harmful for growth: Theory and evidence. Review of Development Economics, 2(3): 318-334.Available at: https://doi.org/10.1111/1467-9361.00045.
Partridge, M.D., 1997. Is inequality harmful for growth? Comment. The American Economic Review, 87(5): 1019-1032. Perotti, R., 1996. Growth, income distribution, and democracy: What the data say. Journal of Economic Growth, 1(2):
149-187.Available at: https://doi.org/10.1007/bf00138861.
Persson, T. and G. Tabellini, 1994. Is inequality harmful for growth? American Economic Review, 84(3): 600-621.
Saint-Paul, G. and T. Verdier, 1993. Education, democracy and growth. Journal of Development Economics, 42(2): 399-407. Scheuermeyer, P. and K. Grundler, 2015. Income inequality, economic growth and the effect of redistribution. Würzburg
Economic Papers, No. 95, University of Würzburg.
United Nations, 2013. Inequality matters. ST/ESA/345, United Nations Publication. Available from
APPENDIX
Table-1. Descriptive Statistics.
Variable Mean Minimum Maximum Std. Dev.
GDP 9.596844 5.04625 16.0675 2.167195
GDPPC 246.8784 101.3485 1729.893 221.7512
GINI 0.25387 0.14957 0.41761 0.066153
TOPBOTTOM 6.150791 4.475003 13.69604 1.629425
INVEST 41.13556 13.08344 85.76501 16.06586
HUMCAP 5.9284 1.98849 10.8378 3.847959
OPENNESS 0.531826 0.02469 3.325852 0.74416
CAPMARK 35.658 9.7654 80.6548 17.8769
FERT 3.654 1.875 5.432 1.987
REDISTR (TAX) 21.454 8.532 56.743 10.864
REDISTR (EXPENDITURE) 35.788 19.645 85.687 20.398
Table-2. Correlation matrix for the variables.
Variables X1 X2 X3 X4 X5 X6 X7 X8 X9 X10
X1: GDP 1
X2: GDPPC 0.308 1
X3: GINI -0.45 0.151 1
X4: TOPBOTTOM 0.0872 0.31 0.216 1
X5: INVEST 0.1626 -0.252 -0.156 0.488 1
X6: HUMCAP 0.1933 -0.02 -0.106 -0.011 -0.174 1
X7: OPENNESS 0.147 0.2 0.036 0.314 0.2353 0.026 1
X8: CAPMARK 0.2937 0.467 0.367 0.412 0.5436 0.409 0.3478 1
X9: REDISTR 0.532 0.435 -0.546 -0.432 0.5764 0.321 0.469 0.4764 1 X10: FERT -0.359 0.127 -0.391 0.243 -0.463 -0.343 0.165 -0.359 0.229 1