https://doi.org/10.5194/nhess-18-531-2018 © Author(s) 2018. This work is distributed under the Creative Commons Attribution 3.0 License.
Implications from palaeoseismological investigations at
the Markgrafneusiedl Fault (Vienna Basin, Austria) for
seismic hazard assessment
Esther Hintersberger1, Kurt Decker1, Johanna Lomax2,3, and Christopher Lüthgens2 1Department of Geodynamics and Sedimentology, University of Vienna, 1090 Vienna, Austria
2Institute of Applied Geology, University of Natural Resources and Life Sciences (BOKU), 1190 Vienna, Austria 3Department of Geography, Justus Liebig University Gießen, 35390 Gießen, Germany
Correspondence:Esther Hintersberger (esther.hintersberger@univie.ac.at) Received: 28 April 2017 – Discussion started: 15 May 2017
Revised: 24 December 2017 – Accepted: 4 January 2018 – Published: 21 February 2018
Abstract. Intraplate regions characterized by low rates of seismicity are challenging for seismic hazard assessment, mainly for two reasons. Firstly, evaluation of historic earth-quake catalogues may not reveal all active faults that con-tribute to regional seismic hazard. Secondly, slip rate de-termination is limited by sparse geomorphic preservation of slowly moving faults. In the Vienna Basin (Austria), moder-ate historical seismicity (Imax,obs/Mmax,obs=8/5.2) concen-trates along the left-lateral strike-slip Vienna Basin Transfer Fault (VBTF). In contrast, several normal faults branching out from the VBTF show neither historical nor instrumen-tal earthquake records, although geomorphological data in-dicate Quaternary displacement along those faults. Here, lo-cated about 15 km outside of Vienna, the Austrian capital, we present a palaeoseismological dataset of three trenches that cross one of these splay faults, the Markgrafneusiedl Fault (MF), in order to evaluate its seismic potential. Com-paring the observations of the different trenches, we found evidence for five to six surface-breaking earthquakes dur-ing the last 120 kyr, with the youngest event occurrdur-ing at around 14 ka. The derived surface displacements lead to magnitude estimates ranging between 6.2±0.5 and 6.8±0.4. Data can be interpreted by two possible slip models, with slip model 1 showing more regular recurrence intervals of about 20–25 kyr between the earthquakes withM≥6.5 and slip model 2 indicating that such earthquakes cluster in two time intervals in the last 120 kyr. Direct correlation between trenches favours slip model 2 as the more plausible option. Trench observations also show that structural and sedimento-logical records of strong earthquakes with small surface
off-set have only low preservation potential. Therefore, the earth-quake frequency for magnitudes between 6 and 6.5 cannot be constrained by the trenching records. Vertical slip rates of 0.02–0.05 mm a−1 derived from the trenches compare well to geomorphically derived slip rates of 0.02–0.09 mm a−1. Magnitude estimates from fault dimensions suggest that the largest earthquakes observed in the trenches activated the entire fault surface of the MF including the basal detach-ment that links the normal fault with the VBTF. The most important implications of these palaeoseismological results for seismic hazard assessment are as follows. (1) The MF is an active seismic source, capable of rupturing the sur-face despite the lack of historical earthquakes. (2) The MF is kinematically and geologically equivalent to a number of other splay faults of the VBTF. It is reasonable to assume that these faults are potential sources of large earthquakes as well. The frequency of strong earthquakes near Vienna is therefore expected to be significantly higher than the earth-quake frequency reconstructed for the MF alone. (3) Al-though rare events, the potential for earthquake magnitudes equal or greater thanM=7.0 in the Vienna Basin should be considered in seismic hazard studies.
1 Introduction
Vienna
Danube
MF
## # # # # #
#
# # # # # # # # # # # # # # # # # # # # # # # ## # # # # # # # # # # # # # # # # # # # # # # # # # # # # # # # # # # # # # # # # # ### # # # # # # # # # # # # # # # # # # # # # # # ## # # # # # # # # # # # # # # # # # # # # # # # # # # # # # # # # # # # # # # # # # # # # # ######## # # # # # # # # # # # # # ## # # # # # # # # # # # # # # # # # # # ## # # # # ## # # # # # # # # ########### # # # # # ## # # # # # # # # # # # # # # ## # # # # # #### # # # # # # # # ### # # # # # # # # # # # # # # # # # # # # # # # # # # # # # # # # # # # # # # ## # # # # # # # # # # # # # # # # # # # # # # ## # # # # # # # # # # # # # # # # # # # # # # # ## # # # # # # # # # # # # # # # # # # # # # # # # # # # # # # # # # # # # # # # # # # # # # # # # # # # # # # # # # # # # # # # # # # # # # # # # # # # # # # # # # # # # # # # # # # # # # # # # # # # # # # # # # # # # # # # # # # # # # # # # # # # # # # # # # # # # # # # # # # # # # # # # # # # # # ## # # # # # # # # # # # # # # # # # # # # # # # # # # # # # # # # # # # ## # # # ## # # # ## # # # # # # # # # # # # # # # # # # # # ## # # # # # # # # # # # # # # # # # # # # ## # # # # # # # # # # # # # # # # # # # ## # # # # # # # # # # # # # ## # # # ## # # # # # # # # # # # # # # # # # # # # # # # # # # # # # # # # # ## # # # # # # # # # # # # # # # # # # # # # # # # # # # # # # # # # # # # # # # # # # # # # # # # # # # # # # # # # # # # # # # # # # # # # # # # # # # # # # # # # # # # # # # # # # # # # # # # # # # # # # # # ##
#
#
#
#
#
#
M < 2.0 2.1–3.0 3.1–4.0 4.1–5.0 > 5.0
0 km 10 20
ACORN (2004) eq. catalog Generalized VBTF Splay normal faults
15°50’ E 16° E 16°20’ E 16°40’ E 17° E 17°20’ E 17°40’ E
48°40’ N 48°20’ N 48° N 47°40’ N Quaternary basins
b
A L P S
CARPATHIANS BNF ABF LF
VBTF
Fig. 3 Fig . 2^
^
^
^
^
_
^
_
^
^^
_
^
^
^
VBFS NL B CH FRANCE AUSTRIA SLOVAKIA HUN SLOVENIA CROATIA ITALIA GERMANY CZECH REPUBLIC CRO 7 7 6 6.8 6.5 5.5 6.3 6.5 6.5 6.4 15°E 10°E 5°E 50°N 45°N Paleosites ^All other sites ^This studyActive faults Normal faults
CENEC catalog (2009) - Mw
Strike-slip faults < 5.0 < 5.5 < 6.0 < 6.5 < 7.0
0 125 250 500
km
a
Figure 1. (a)Major earthquakes from historical, instrumental, and palaeoseismological data in intra-plate central Europe. Historical and in-strumental seismicity is based on the CENEC catalogue by Grünthal et al. (2009). Palaeoseismological study sites are compiled from Camel-beeck and Meghraoui (1998), CamelCamel-beeck et al. (2000),CamelCamel-beeck et al. (2007), Meghraoui et al. (2001), Vanneste and VerCamel-beeck (2001), Van den Berg et al. (2002), Peters et al. (2005) and Štepancíková et al. (2010). Labels indicate the magnitudes of the largest palaeoearthquakes
observed at the respective site. Black box shows area of the close up in panel(b). VBFS is the Vienna Basin Fault System.(b)Active faults
(black solid and dashed lines), seismicity (black circles), and Quaternary basins (light grey areas) within the Vienna Basin (Austria)
plot-ted on a shaded DEM (90×90 m resolution, SRTM data). Seismicity is based on the ACORN catalogue (ACORN, 2004). The borders of
the Austrian capital, Vienna, are outlined by a dashed white line. Modified after Beidinger and Decker (2011). VBTF is the Vienna Basin Transfer Fault. Important normal splay faults of the VBTF: ABF is Aderklaa–Bockfliess Fault, BNF is Bisamberg–Nussdorf Fault, LF is Leopoldsdorf Fault, and MF is Markgrafneusiedl Fault. White box shows the location of Fig. 3a, while the white line is the position of the cross section of Fig. 2.
the fact that the generating faults were either unmapped (Darfield Earthquake 2010; Gledhill et al., 2011) or not con-sidered in hazard assessments (e.g. Haiti Earthquake 2010; Giardini et al., 1999). Thus, it seems to be clear that his-torical and instrumental seismicity data are not sufficient to fully characterize the seismogenic potential of a certain re-gion, especially in regions of low to moderate seismicity (e.g. Camelbeeck et al., 2007; Liu et al., 2011; Landgraf et al., 2017). Therefore, during the last decade, geomorphological and palaeoseismological approaches have been increasingly used to map active faults and to determine the related slip rates (e.g. Clark et al., 2012, in Australia and Vanneste et al., 2013, for the Lower Rhine graben system in central Europe). The results of those studies have dramatically changed the
earthquake patterns during time (quasi-periodic earthquakes occurring in more or less regular time intervals) or if earth-quakes occur in clusters, where periods of high activity al-ternate with intervals of seismic quiescence (Wallace, 1987; Friedrich et al., 2003).
Historical and instrumental seismicity in the Vienna Basin (Austria) between the eastern margin of the European Alps and the Carpathians concentrates at the main active strike-slip fault, the Vienna Basin Transfer Fault (VBTF; see Fig. 1b). However, several Quaternary active normal faults are part of the same presently strain-accumulating fault sys-tem, but seem to be seismically “silent”. Therefore, the Vi-enna Basin provides a good example for, firstly, address-ing the question whether historical and instrumental seis-micity are enough to identify active faults and, secondly, analysing the behaviour of slowly moving faults in a fault system. Here, we present results of a palaeoseismological study along a Quaternary active fault, the Markgrafneusiedl Fault (MF) close to the city of Vienna. Even though nei-ther historical nor instrumental seismicity has been recorded along this fault, three trenches across the fault show evidence for five to six surface-breaking earthquakes. Correlation be-tween the trenches and integration of geomorphological and borehole data helps to put weight between the two hypothe-ses of quasi-periodic or clustered behaviour of the MF.
2 Geological setting 2.1 The Vienna Basin
The Vienna Basin formed as a pull-apart basin between the Eastern Alps and the Western Carpathians in the Middle and Upper Miocene (e.g. Royden, 1985; Decker et al., 2005). It is located between two left-stepping segments of the NE-SW striking sinistral strike-slip VBTF (Fig. 1b). Faulting along this fault system is related to NE-directed movement of the block east of the Vienna Basin, caused by lateral ex-trusion of the central Eastern Alps towards the Pannonian Basin (Ratschbacher et al., 1991; Linzer et al., 1997, 2002). GPS data (Grenerczy et al., 2005; Metois et al., 2015) indi-cate that the VBTF moves at horizontal velocities on the or-der of 1 mm yr−1or less, whereas geological reconstruction of Quaternary sediment deposition within the basin (Decker et al., 2005) suggests slip rates between 1.6 and 2.5 mm yr−1. Seismic slip rates calculated from cumulative scalar seismic moments for different segments along the fault are heteroge-neous, varying from 0.5 to 1.1 mm a−1 at the southern and northern tips to an apparently locked segment in the central part of the basin, close to the city of Vienna (Hinsch et al., 2005; Hinsch and Decker, 2011). Fault mapping using 2-D and 3-2-D reflection seismic, gravity, and geomorphology shows that these seismotectonically defined segments are de-limited by major fault bends, including a restraining bend at the northern end of the Vienna Basin and three releasing
bends with negative flower structures overlain by Pleistocene pull-apart basins with up to 150 m of growth strata (Beidinger and Decker, 2011). The releasing bends are connected via pure strike-slip segments.
In addition to the overall geometry of the strike-slip fault with releasing and restraining bends, the transfer of dis-placement to several normal faults splaying from the strike-slip system at the edges of the releasing bends appears to be an important factor controlling fault segmentation (Bei-dinger and Decker, 2011). The splay faults were generated during the Middle to Upper Miocene formation of the Vi-enna pull-apart basin (Decker et al., 2005) and are kinemat-ically linked to the VBTF via a common detachment (i.e. the Alpine floor thrust, Fig. 2, Hölzel et al., 2010; Hinsch and Decker, 2011; Beidinger and Decker, 2011). The sec-ondary normal splay faults at the central part of the Vienna Basin are seismically inactive according to instrumental and historical seismicity data (Fig. 1b). However, geomorpho-logic and subsurface geophysical data reveal that these faults record tens of metres of Quaternary displacement (Chwatal et al., 2005; Decker et al., 2005; Weissl et al., 2017). Palaeo-seismological trenching in the Vienna Basin has so far been carried out at one of the normal splay faults, the Aderklaa– Bockfliess Fault (ABF in Fig. 1b); the trench did not expose the fault, but the displacement of the base of Quaternary sed-iments shown in combined electric resistivity measurements and remote sensing analysis suggests a Quaternary slip rate of 0.05 mm a−1 for this fault (Weissl et al., 2017). Mod-erate historical and instrumental seismicity (maximum ob-served magnitude Mmax,obs≈5.3 / maximum observed epi-central intensityImax,obs= 8) is concentrated along the VBTF with the 1972 Seebenstein (M≈5.3), 1906 Dobra Voda (M≈5.7), and∼AD 350 Carnuntum (M≈6) earthquakes being the largest known events (Gutdeutsch et al., 1987; Decker et al., 2006; Lenhardt et al., 2007). The scarcity of strong earthquakes and the generally low to moderate seis-micity result inMmax estimations for the Vienna Basin of M= 6.0 to 6.5 (Lenhardt, 1995; Procházková and Simunek, 1998; Sefara et al., 1998; Tóth et al., 2006). However, these estimations are based solely on historical and instrumental seismicity and may therefore not reflect the long-term seis-mic potential of the Vienna Basin.
2.2 The Markgrafneusiedl Fault
sug-0 5 10 km
0
3 TWT (s)
Crystalline basement Mesozoic
sediments
Thrust fault Middle to upper miocene:
Lower miocene: Normal fault Sinistral strike-slip fault
Alpine-carpathian thrust units Autochthonous L. miocene sed.
Middle–upper miocene (pull-apart stage) Lower miocene wedge top Basin European basement
Autochthonous mesozoic sediments
NW SE
Vienna Basin Molasse Basin
VBTF MF
ABF BNF
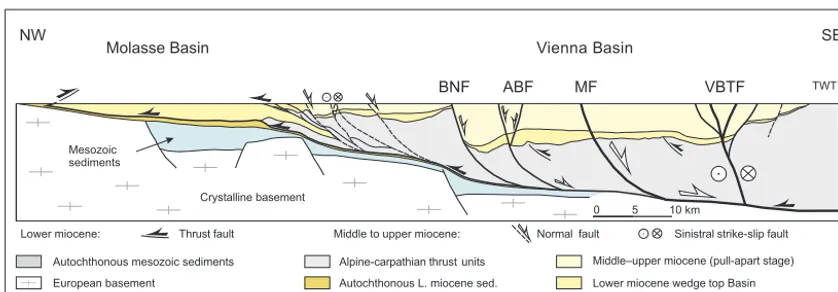
Figure 2.Cross section through the Vienna Basin at its central part based on reflection seismic and deep boreholes, indicating the common detachment of the Alpine floor thrust, which links the normal splay faults such as the Markgrafneusiedl Fault (MF), Aderklaa–Bockfliess Fault (ABF), and Bisamberg–Nussdorf Fault (BNF) to the Vienna Basin Transfer Fault (VBTF). The generalized detachment corresponds to the Alpine–Carpathian floor thrust, which is reactivated by normal faulting. For location see Fig. 2.
gest that movement along the MF started on different fault segments that eventually merged together as one larger fault (Spahi´c et al., 2013). Quaternary fault reactivation is inferred from geomorphological evidence of a 12 m high linear scarp paralleling the outcrop trace of the fault, high-resolution geo-physical profiling (ground-penetrating radar, reflection seis-mic, geoelectrics; Chwatal et al., 2005), and ca. 40 m off-set of the base of the Quaternary sediments across the MF (Decker et al., 2005, Fig. 3b). The visible fault scarp coin-cides with the SE edge of the Pleistocene Gaenserndorf ter-race (Figs. 3a, b and 4a–d). The Gaenserndorf terter-race is a large river terrace north of the Holocene flood plain consist-ing of coarse gravels in sandy matrix and sandy deposits typ-ical for braided river systems (Weissl et al., 2017, and ref-erences therein). Infrared stimulated luminescence (IRSL) dating suggests a minimum deposition age of 200–300 ka (Weissl et al., 2017). Despite the well-documented Quater-nary displacement along the MF, no historical seismicity is associated with this fault. Whether this apparently slow-moving fault can produce larger earthquakes is the key ques-tion of our study. Three trenches (from north to south: WAG, SDF1, and SDF3) were excavated across the MF between the villages of Markgrafneusiedl and Gaenserndorf, about 15 km from the city limits of Vienna, the Austrian capital (Figs. 3a and 4a).
3 Methodology 3.1 Field work
Prior to siting the trenches SDF1 and SDF3, 40 MHz ground penetration radar profiles were carried out to locate the MF at the base of the present-day scarp (see locations in Fig. 4a and profiles across the fault scarp at the trench locations in Fig. 4c, d). The chosen trench sites are located in a forested
area to minimize anthropogenic influence (Fig. 4b). The ap-proximately NW–SE trending trenches were excavated for about 40–50 m with the NE wall benched. Both walls were covered by a grid of 0.5 m×0.5 m with rows named from A (top) to J and L (bottom) and columns counted from 1 at the SE end upwards to the NW end. Photomosaics of all walls were obtained by taking pictures of two grid rectan-gles (1 m×0.5 m) and subsequent manually orthorectifying and stitching in ArcGIS. Trench logging was conducted at a scale of 1:10 for the entire SW walls of the trenches and the section around the fault zone on the NE walls.
3.2 Luminescence dating
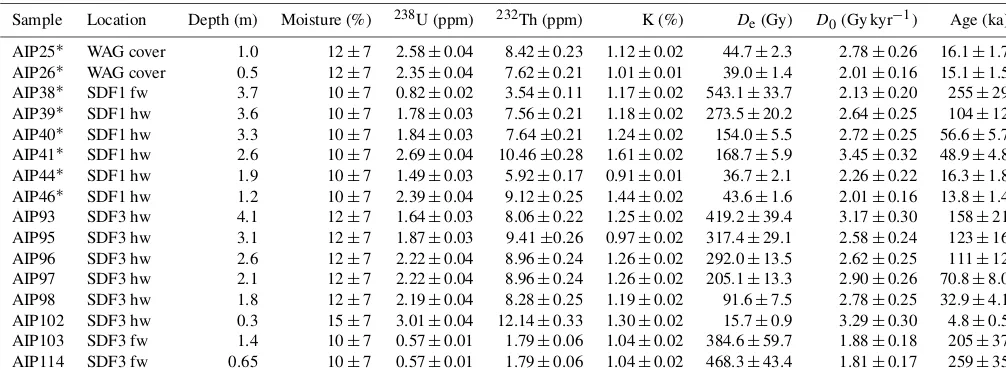
Table 1.Infrared stimulated luminescence dating results from the trenches SDF1, SDF3, and WAG at the Markgrafneusiedl Fault (MF).
Sample Location Depth (m) Moisture (%) 238U (ppm) 232Th (ppm) K (%) De(Gy) D0(Gy kyr−1) Age (ka) AIP25∗ WAG cover 1.0 12±7 2.58±0.04 8.42±0.23 1.12±0.02 44.7±2.3 2.78±0.26 16.1±1.7 AIP26∗ WAG cover 0.5 12±7 2.35±0.04 7.62±0.21 1.01±0.01 39.0±1.4 2.01±0.16 15.1±1.5 AIP38∗ SDF1 fw 3.7 10±7 0.82±0.02 3.54±0.11 1.17±0.02 543.1±33.7 2.13±0.20 255±29 AIP39∗ SDF1 hw 3.6 10±7 1.78±0.03 7.56±0.21 1.18±0.02 273.5±20.2 2.64±0.25 104±12 AIP40∗ SDF1 hw 3.3 10±7 1.84±0.03 7.64±0.21 1.24±0.02 154.0±5.5 2.72±0.25 56.6±5.7 AIP41∗ SDF1 hw 2.6 10±7 2.69±0.04 10.46±0.28 1.61±0.02 168.7±5.9 3.45±0.32 48.9±4.8 AIP44∗ SDF1 hw 1.9 10±7 1.49±0.03 5.92±0.17 0.91±0.01 36.7±2.1 2.26±0.22 16.3±1.8 AIP46∗ SDF1 hw 1.2 10±7 2.39±0.04 9.12±0.25 1.44±0.02 43.6±1.6 2.01±0.16 13.8±1.4 AIP93 SDF3 hw 4.1 12±7 1.64±0.03 8.06±0.22 1.25±0.02 419.2±39.4 3.17±0.30 158±21 AIP95 SDF3 hw 3.1 12±7 1.87±0.03 9.41±0.26 0.97±0.02 317.4±29.1 2.58±0.24 123±16 AIP96 SDF3 hw 2.6 12±7 2.22±0.04 8.96±0.24 1.26±0.02 292.0±13.5 2.62±0.25 111±12 AIP97 SDF3 hw 2.1 12±7 2.22±0.04 8.96±0.24 1.26±0.02 205.1±13.3 2.90±0.26 70.8±8.0 AIP98 SDF3 hw 1.8 12±7 2.19±0.04 8.28±0.25 1.19±0.02 91.6±7.5 2.78±0.25 32.9±4.1 AIP102 SDF3 hw 0.3 15±7 3.01±0.04 12.14±0.33 1.30±0.02 15.7±0.9 3.29±0.30 4.8±0.5 AIP103 SDF3 fw 1.4 10±7 0.57±0.01 1.79±0.06 1.04±0.02 384.6±59.7 1.88±0.18 205±37 AIP114 SDF3 fw 0.65 10±7 0.57±0.01 1.79±0.06 1.04±0.02 468.3±43.4 1.81±0.17 259±35
∗Refer to samples published by Weissl et al. (2017). Location refers to either of the trenches (SDF1, SDF3, WAG) and the location with respect to the MF, with hw being the hanging wall and fw
being the footwall. Depth (m) is the depth of the sampling location in metres below present-day surface.De(Gy) is the equivalent dose in grey (Gy).D0(Gy kyr−1) is the dose rate in grey values per 1000 years.
equivalent determination of the feldspar fraction, a conven-tional SAR IRSL protocol was applied (Wallinga et al., 2000; Blair et al., 2005), using a preheat temperature of 250◦C for 20 s and a stimulation at 50◦C for 300 s. Stimulation was carried out with infrared LEDs, and signals were detected af-ter passing through a blue inaf-terference filaf-ter (410±20 nm). Overdispersion (Galbraith et al., 1999) was below 11 % in all samples confirming a generally well-bleached nature of the sediments. Radionuclide concentrations for dose-rate es-timation were determined on about 900 g of bulk sediment using high-resolution, low-level gamma spectrometry. Sam-ples were first dried, homogenized, and stored in sealed Marinelli beakers (500 mL, about 1 kg dry weight) for at least a month to establish secondary secular radon equilibrium. Measurements were conducted using a Canberra HPGe de-tector (40 % ntype). Relevant luminescence data are listed in Table 1.
It needs to be stressed that the feldspar based ages were not corrected for fading. Fading describes an anomalous sig-nal loss very commonly observed for potassium-rich feldspar (Wintle, 1973). If not corrected for, fading leads to the un-derestimation of the burial age. However, samples from the same study area investigated by Weissl et al. (2017) showed little or no fading, as demonstrated by a comparison between quartz and feldspar luminescence ages. Nevertheless, all ages presented here need to be treated with caution for potential age underestimation.
3.3 Modelling occurrence times and recurrence intervals
For the calculation of earthquake occurrence times and re-currence intervals, we used the Bayesian statistical computer
program OxCal v4.3.2 (Bronk Ramsey, 1995, 2001). Each trench is modelled separately as a chronological sequence with the respective IRSL dating results in stratigraphic or-der constraining the earthquake occurrence times. IRSL dat-ing results are initially represented as uniform distributions covering the respective errors. In the following step, the chronological sequences of all trenches are combined by the “phase” command, so that the constraints from all trenches for each single earthquake occurrence time are considered at the same time. Intervals between earthquakes are calculated using the command “difference”. Detailed code information is given in the Supplement.
4 Trenching results
500
1000
1500
2000
2500
3000
Amplitude
-30 000 -20 000 -10 000 0 10 000 20 000 30 000
MF
c
20 15
10 5
0 160 140 120 100
Al
tit
ud
e
(m
a
.s
.l.
)
Distance (km) Base of quaternary sediments MF
b DEM
0 3 6 km
Floodplain of the Danube river
GDT
GDT MF
SDF1
MF
SHT Seismic line
a
16° 40‘ E 16° 50‘ E
48° 20‘ N
48° 15‘ N
SDF3
WAG March riverFloodplain of the
tr
tr tr fs
fs fs
fs
VBTF
TWT (ms)
fs fs
fs MGNS
GD
Fig. 4A Topographic profile
Present-day topography
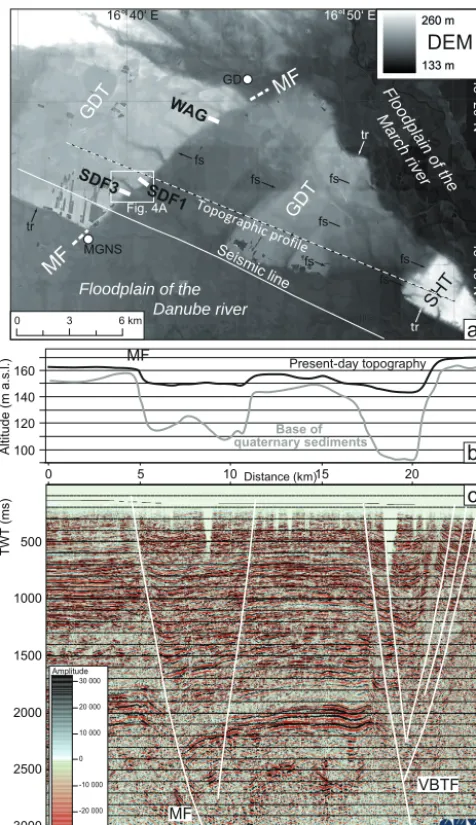
Figure 3.Overview of the Markgrafneusiedl Fault (MF).(a)DEM
(10×10 m resolution, provided by the government of Lower
Aus-tria) showing the Pleistocene terraces north of the River Danube dis-sected by faults creating fault scarps (fs). GDT is the Gaenserndorf terrace and SHT is the Schlosshof terrace. Dashed line: trace of the topographic profile in panel(b); solid line: trace of the seismic line in panel(c), white circle: locations of the villages Markgrafneusiedl
(MGNS) and Gaenserndorf (GD).(b)Topographic profile (black)
and cross section indicating the base of Quaternary sediments (grey) across the MF. Note the thickness of Quaternary growth strata in the
fault-delimited basin above the MF. Vertical exaggeration: 8.6×(c)
seismic section across the same area showing offset along the MF and the flower structure at the Vienna Basin Transfer Fault (VBTF).
Vertical exaggeration at 2s TWT (two-way travel time) is 4.5×. See
text for details.
15
5
16
0
16
5
200 400 600 800 1000
SDF1
48
°1
7'
N
SDF3
SDF1
16°41' E 16°40‘ E°
0 1 km
b
c
MF
48
°1
7.
5'
N
Road
Legend
Fault trace Trench limits
MF in trenches GPR profiles
Gravel pit Outlines of gullies
a
MF
B
15
5
16
0
16
5
0 200 400
600 800
1000 1200
El
ev
at
ion
(m
)
Distance (m)
SDF3
d
MF
Gully
MF
Profile D
Profile C
Figure 4.Trench locations of SDF1 and SDF3.(a)Locations of trenches SDF1 and SDF3 relative to the Markgrafneusiedl Fault (MF) and the margin of the Gaenserndorf terrace NW of the MF. Gullies normal to the MF are currently dry valleys resulting from
Pleistocene drainage of the terrace. This lidar image with 1×1 m
resolution was provided by the government of Lower Austria.(b)
View of the fault scarp south of the forested area where the trenches are located, looking towards N. The assumed fault trace of the MF is marked by the white dashed line. Approximate viewpoint
is marked in panel(a)by white circle. (candd) Topographic
pro-files across the fault scarp of the MF at trench locations SDF1 and
SDF3, respectively. Vertical exaggeration: 16×. See profile
loca-tions in panel(a).
4.1 Trenching at SDF1
SE-10
20
D
G
H
I
D E F
C G
W2
T2
W3
T3
W4 T4
W5
F1
F2
E F
1 m
1 m
SE
NW
x
104 ± 12 ka
(AIP39)
48.9 ± 4.8 ka
x (AIP41)
16.2 ± 1.8 ka
x (AIP44)
13.8 ± 1.4 ka
x (AIP46)
56.6 ± 5.7 ka
x (AIP40)
x
255 ± 29 ka
(AIP
38)
Paleo-soil (`A-horizon’) Paleo-soil (`B-horizon’)
Recent soil (A-horizon)
Silt
Silt, carb.-cemented
Gänsendorf terrace (foot
wall)
Large well-rounded pebbles in sandy matrix Small well-rounded pebbles, grain supported
Hanging wall
Pebbles
Sand
Sand (red brown)
Fault
zone Reworked Colluvial wedge 5
material
of
colluvial
wedge
4 Tension crack 4
Colluvial wedge 4 Tension crack 3
Colluvial wedge 3 Tension crack 2
Colluvial wedge 2
Gravels Sand
U3
W4a
U4
U5
U6
U7
U8
U9
U10
U1
1
U1
U2
W2
T2
W3
T3
W4
T4
W5
W4a
U5
U1
U2
U6
U8
U1
1
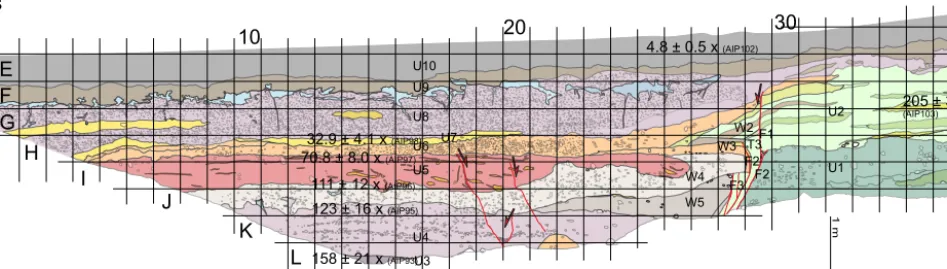
Figure 5. Trench log of the SW-facing wall of the trench SDF1 across the Markgrafneusiedl Fault (for location see Figs. 3a and 4). Stratigraphic units are marked with U1–U11 from the oldest to the youngest unit; colluvial wedges and underlying tension cracks re-lated to earthquakes A2–A5 are numbered as W2–W5 and T2–T5. Numbers indicate the age and the location of IRSL samples. See text for further explanation. See Supplement for high-resolution photo-mosaic.
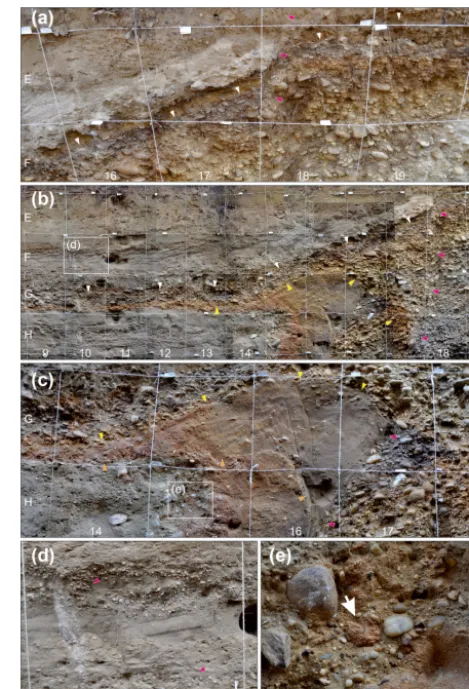
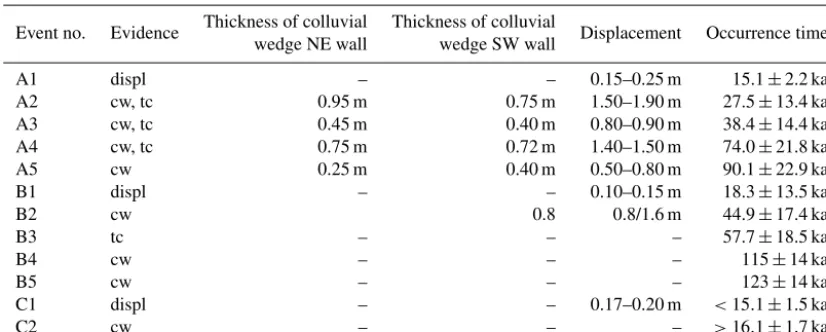
Figure 6.Details from the SW-facing wall of the trench SDF1.
(a)Evidence for earthquake A1 from the displacement of a marker
horizon (white arrows), which is correlated across the fault (red
ar-rows).(b)Evidence for earthquake A2 from a colluvial wedge
com-posed of sandy gravel overlying a tension gash filled with the same material. Top and base of the wedge are marked by white and yellow arrows, respectively. To the right the wedge abuts against fault 1 (red
arrows).(c)Colluvial wedge associated with earthquake A3
overly-ing a tension gash adjacent to fault 2 (yellow and orange arrows: top and base of the wedge or tension gash; red arrows: fault). Sev-eral deformation bands that branch from fault 2 and formed during a later earthquake cut the wedge. It overlies wedge 4, which equally contains reddish redeposited soil. Wedge 4 shows an erosional
con-tact to grey high-stage flood sediments (around panele).(d)
Defor-mation bands offsetting laminated fluvial sand (red arrows) above wedge 2. The deformation bands are correlated to the event horizon of E1 (detail of pictureb).(d)Detail of panel(c). Erosional contact of wedge 4 to flood sediments. Armoured mudballs (arrow) derive from the eroded colluvium.
dipping MF. The fault zone includes two parallel steeply dip-ping faults F1 and F2, with F2 reaching almost the present-day surface (see Figs. 5 and 6a).
coarse gravels and boulders in a grain-supported sandy ma-trix (U2). Pebbles show consistent NW-dipping imbrication throughout the entire footwall section. The inferred domi-nantly SE-directed palaeocurrents are comparable to the flow direction of the Holocene Danube. A lens of medium light grey sand with millimetre-sized white mica minerals (U1 in Fig. 5), partly exposed at the trench bottom, is cut by fault F2. The uppermost 0.5 m of the terrace deposit directly below the recent soil horizon does not show horizontal consistency and is probably reworked and repositioned.
In the hanging wall SE of the fault zone, three types of sediments are exposed:
a. Sequences of horizontal layers of grey and light-brown silt and fine sand with varying thicknesses up to 20 cm (units U3, U4, U7, U9). Sediments show lamination on a centimetre scale and intercalations of centimetre-thick horizons of coarse sand. The layers also include singular well-rounded pebbles and granules aligned in horizontal layers. Some sand and silt layers show fining-upward trends. Pedogenetic carbonate ce-mentation is observed along the top of the uppermost silt layer (U9) and along recent root paths. The sedi-ments are intercalated with and onlap on the wedge-shaped colluvial deposits described below. We relate the deposits to high-stage floods in the floodplain of the Pleistocene Danube.
b. Colluvial wedge deposits (W2–W5 in Fig. 5) and asso-ciated tension crack fills (T2–T4 in Fig. 5). These collu-vial sediments are adjacent to both faults and decrease in thickness towards the SE (i.e. away from the fault scarp; Fig. 6b). The steep contact with the SE-dipping faults and the thinning of the deposits towards SE re-sults in a wedge-shape of the sediment layers. The tails of wedges W2, W3, and W5 can be followed throughout the exposed part of the hanging wall. All wedges are as-sociated with tension cracks adjacent to the faults (T2– T4), which are filled with the same material as the over-lying wedge, but showing no preferred orientation. The lowest wedge W5 consists of matrix-supported reddish brown medium gravel with a matrix composed mainly by sand and silt together with a low content of clay. The overlying wedge comprises two parts, W4 and W4a, de-limited by steep irregular boundary adjacent high-stage flood sediments. While W4 consists of brown to red-dish brown fine to medium sand with some fine gran-ules and pebbles in a matrix-supported fabric, W4a in-clude rounded pebble-sized clasts of the reddish wedge material interpreted as mud balls (Fig. 6c and e). We interpret this peculiar contact to result from the partial erosion of the wedge and the wedge tail during high-stage floods and the redeposition of the colluvial ma-terial by fluvial processes or small slumps. Wedge W3 consists of well-sorted reddish-brown medium-grained sand with a few pebbles (fine gravel) showing
lami-nation dipping away from fault F1 (Fig. 6c). The red and reddish-brown colour of W3–W5 contrasts from the light grey-beige intercalated high-stage flood deposits. The sedimentary wedge material was identified as rede-posited soil, because its colour resembles ferretto soils (5YR 4/4, Y5YR 5/4, and 5YR 58 of the standard soil colour chart; L. Smolíková, personal communication, 2011). The source for the redeposited soil would be the previous soil cover of the terrace gravels in the footwall of the MF. While W3, W4, and W5 are bounded by F1, wedge W2 is adjacent to F2 and overlies the trace of F1 as well as the W3 deposits. W2 consists of large well-rounded pebbles and cobbles oriented sub-horizontally in a grain-supported fabric, similar to the terrace de-posits found in the foot wall. On top of W2 and U2, a palaeosoil has been developed after deposition of W2, visible by black and brownish colouring of the upper 25 cm (Figs. 5 and 6a, b). The underlying tension crack T2 is composed by the same material, but with slightly larger cobbles with no horizontal layering.
c. Fine-grained alluvium (units U5, U6, U8) found in both the hanging wall and the footwall consists of several thin layers of sand and fine gravel overlain by up to 1 m of unstructured silt and fine sand (U10). The lat-ter is transitional to the overlying dark brown to black soil horizon (U11). The succession is interpreted as al-luvium of the dry valley and loess or redeposited loess. Fault 2 offsets the alluvial sand layers (U5, U6, U8) for about 15 to 20 cm but terminates within the overlying sediments of U10 several centimetres above the base of the layer (Fig. 6a).
158 ± 21 x (AIP93) 123 ± 16 x (AIP95) 70.8 ± 8.0 x (AIP97) 32.9 ± 4.1 x (AIP98)
4.8 ± 0.5 x (AIP102)
111 ± 12 x (AIP96)
205 ± 37 x (AIP103)
W4 W3
W2
W5 F3 F2 F2’
F1 T3 U5
U4 U3
U2
U1 U6 U7
U8 U9 U10
S N
1 m E
F G
1 m
10
L K J
I H
20 30
Figure 7.Trench log of the SW-facing wall of the trench SDF3 across the Markgrafneusiedl Fault (for location see Figs. 3a and 4). Colluvial wedges and underlying tension cracks related to earthquakes B2–B5 are numbered. The displacement related to B1 is marked. Numbers indicate the age and the location of IRSL samples. See text for further explanation. See Supplement for high-resolution photomosaic.
4.1.1 Evidence for seismic events observed within trench SDF1
Slip events identified in SDF1 will be labelled as A1–A5 from the youngest to the oldest. Offset of units U5, U6, and U8 at the tip of F2 provides direct evidence for the youngest surface-breaking slip event A1 (Fig. 6a). The small-scale faults observed in the same units U6, U7, and U8 (Fig. 6d) are at the same stratigraphic level and indicate faulting within the hanging wall during A1. Neither F2 nor the small faults cut units U9 and U10. In addition, W2 has been also off-set by A1 along F2, clearly seen by the coloured palaeosoil (Fig. 6a). The observed colluvial wedges W2–W5, their geo-metrical relation to the adjacent faults, and the tension cracks (T2–T4) filled with same material prove four distinct events (A2–A5) of co-seismic displacement at the MF. In addition, the existence of deformation bands within the sandy deposits of W3, T3, W4, and T4 indicates further deformation of both wedges during younger slip event, either A1 or, more proba-bly, A2.
Due to the subhorizontal layering within the hanging wall, the occurrence of the events A2, A3, and A5 can be bracketed by sediments lying below and above the respective wedge tails. The deposits of W2 lie directly on top of W3 (Figs. 5 and 6b). The associated earthquakes A2 and A3 must have occurred after the deposition of U4 and before U5 and U6 were deposited. A5 must have occurred between the depo-sition of units U3 and U4. The colluvial wedge associated with A4 has been partly eroded (W4 and W4a), which must have happened during the deposition of U4. Therefore, A4 must have happened after the occurrence of A5 and before the deposition of U4.
Direct measurement of offset is only possible for A1, which is constrained by the dip-slip offset of layers corre-lated across fault F2, i.e. units U5 and U6 and the top of W2. The 1.5 m of apparent vertical offset of U5 and U6 away from the fault between the top of the footwall and SE end of the
hanging wall is due to the sedimentation on pre-existing to-pography. Following the generally accepted rule of thumbs that colluvial wedge height is approximately half of the sur-face displacement of an earthquake (McCalpin, 2009), the measured maximum thickness of each colluvial wedge W2– W5 can be used to estimate the minimum displacement for the associated event (Table 2).
4.1.2 Age control in trench SDF1
The fine-graded sandy and silty subhorizontal deposits of the hanging wall of trench SDF1 provide good material for IRSL dating. We sampled the sandy sediments in stratigraphic po-sitions below and above the tails of the colluvial wedges A5, A2, and A3. In addition, we took samples from unit 7, which is affected by faulting related to A1, and from unit U10, sealing fault F2. In general, luminescence dating results fit well to the stratigraphic hanging wall sedimentary sequences observed in the trench, showing continuous decrease in age from the bottom towards the top (Fig. 5 and Table 1). In addi-tion, the age derived for the Gaenserndorf terrace in the foot-wall fit well with other ages from this terrace (Weissl et al., 2017).
Table 2.Type of evidence, inferred displacement for the palaeoearthquakes A1 to A5 (trench SDF1), B1 to B5 (SDF3), and C1 to C2 (WAG) and possible occurrence times.
Event no. Evidence Thickness of colluvial Thickness of colluvial Displacement Occurrence time
wedge NE wall wedge SW wall
A1 displ – – 0.15–0.25 m 15.1±2.2 ka
A2 cw, tc 0.95 m 0.75 m 1.50–1.90 m 27.5±13.4 ka
A3 cw, tc 0.45 m 0.40 m 0.80–0.90 m 38.4±14.4 ka
A4 cw, tc 0.75 m 0.72 m 1.40–1.50 m 74.0±21.8 ka
A5 cw 0.25 m 0.40 m 0.50–0.80 m 90.1±22.9 ka
B1 displ – – 0.10–0.15 m 18.3±13.5 ka
B2 cw 0.8 0.8/1.6 m 44.9±17.4 ka
B3 tc – – – 57.7±18.5 ka
B4 cw – – – 115±14 ka
B5 cw – – – 123±14 ka
C1 displ – – 0.17–0.20 m <15.1±1.5 ka
C2 cw – – – >16.1±1.7 ka
Colluvial wedge thickness observed on NE and SW trench walls used for estimating displacement. Displacement is taken as twice the colluvial wedge thickness. Evidence: dip-slip displacement of correlated layers (displ.), occurrence of colluvial wedges (cw), and sediment-filled tension cracks below the colluvial wedges (tc). Occurrence times (mean±2σ) are calculated with OxCal using chronological constraints from respective trenches.
4.2 Trenching at SDF3
We opened the second trench SDF3 about 1.5 km SW of trench SDF1 (Figs. 3a and 4a). This 33 m long, 3 m wide, and up to 5 m deep trench was located along a clearing in the forest. The about 0.5 m wide fault zone of the SE-dipping MF divides the N–S-trending trench into two parts. The footwall W of the fault mainly consists of gravels of the Gaenserndorf terrace whereas the hanging wall in the E shows a succession of fluvial sediments, colluvial deposits originating from the uplifted footwall, and reworked silty sediments (Fig. 7).
The footwall consists of poorly sorted, well-rounded sandy gravels within a grain-supported fabric. The clasts include metamorphic rocks, gneisses, quartzite along with minor sandstone, and limestone. The few magmatic components found within the gravels are completely weathered. The lower 1–1.5 m of the terrace exposed in the trench contains coarse cobbles with diameters up to 25 cm (U1). The upper part shows typical characteristics of braided river deposits, including cross-bedding of good-sorted gravel layers inter-calated with sand layers of up to 0.5 m of thickness and sev-eral metres of latsev-eral extent (U2). Furthermore, this part con-sists of gravel and small cobbles with diameters up to 10 cm. All layers show a slight inclination towards the SE. Through-out the terraces deposits, vadose gravitational carbonate ce-mentation (“dripstone cece-mentation”) along the lower side of larger gravels is observed.
The hanging wall consists of horizontally layered fluvial, probably alluvial, and erosional deposits. In the following, we describe the most important units of the hanging wall, starting with the lowermost unit. Unit 4 consists of inter-calated beige to grey, medium to fine sand, and gravel lay-ers comprising well-rounded, poorly sorted clasts. The
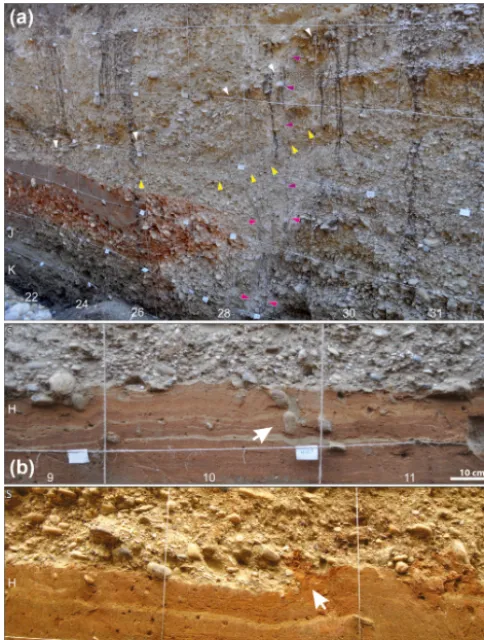
Figure 8. Details from the W-facing wall of the trench SDF3.
(a)Wedge associated with earthquake B2 (top: white arrows; base:
yellow arrows; see text for discussion) overlying an upward widen-ing fault (red arrows), recognized from pebbles, which are oriented parallel to the fault. The top of the wedge (white arrows) is offset by a narrow deformation band that emerges from the fault below
the wedge (purple arrows). Offset occurred during B1.(b, c)
Lam-inated flood sediments (clay, silt, and fine sand) underlying
collu-vium of wedge B2. Pebbles sunken into the soft sediment(b)and
flame structures protruding into the overlying gravel(c)are
indica-tive for liquefaction.
liquification, caused either by an earthquake or by deposition of the overlying coarse gravels over the still water-bearing sediments of U5 (Fig. 8b, c). Close to the fault, there are several wedge-shaped deposits between U5 and U6. W3 is exposed for about 3 m in the hanging wall close to the fault. It consists of approximately 25 cm thick gravels and small cobbles with diameters up to 10 cm. On top of W3, a pack-age of layered sediments dips towards S (W2). Its thick-ness close to F1 is about 0.8 m and decreases within 1 m away from the fault. The layers consist of well-sorted peb-bles, partly without matrix (red layer). W2 is then covered with U6. U6 consists of grain-supported conglomerate with well-rounded, poorly sorted cobbles with grain sizes up to 10 cm. Those gravels originate from the footwall and form a colluvial wedge, which decreases in thickness with
increas-ing distance to the fault. Unit U7 consists of olive-coloured medium sand with rare mica components. This 10 cm thick unit decreases in thickness towards the fault. This fact, to-gether with the colour of the sand, suggests that it is a flood deposit of the Danube. Unit U8 covers both the hanging and the foot wall and consists of a matrix-supported conglomer-ate with silt matrix and around 25 % of components compris-ing poorly sorted, well-rounded pebbles with grain sizes up to 3 cm. The silt matrix consists of reworked loess that has probably eroded from the footwall, including smaller clasts from the Gaenserndorf terrace. In the top of this unit, sec-ondary carbonate cemented a horizontal layer of up to 30 cm thickness. The layer is observed throughout the entire hang-ing wall. Carbonate cementation occurs due to meteoric wa-ters dissolving carbonate from the upper layers and precip-itating it at lower pH values in greater depth. Conjugated planar carbonate fissures of up to 60 cm length branch off from the cemented layer. They strike approximately parallel to the orientation of the MF. Unit U9 is the AC soil hori-zon, consisting of a matrix-supported conglomerate of fine sand and 30–40 % of components containing partly angular and rounded pebbles with grain sizes up to 2 cm. The contact to both the underlying and overlying units is rather diffuse. Finally, unit U10 is the A soil horizon that increases in thick-ness with increasing distance from the MF. Its thickthick-ness co-incides with a layer of silt or loess that has been reworked as soil.
Figure 9.Trench WAG: photomosaic of the W-facing trench wall. Red arrows denote locations of faults. Yellow arrows point to offset contact between colluvium and overlying loess. Orange arrows denote location of the faulted marker layer depicted in Fig. 10. Boxes refer to details shown in Fig. 10b and c.
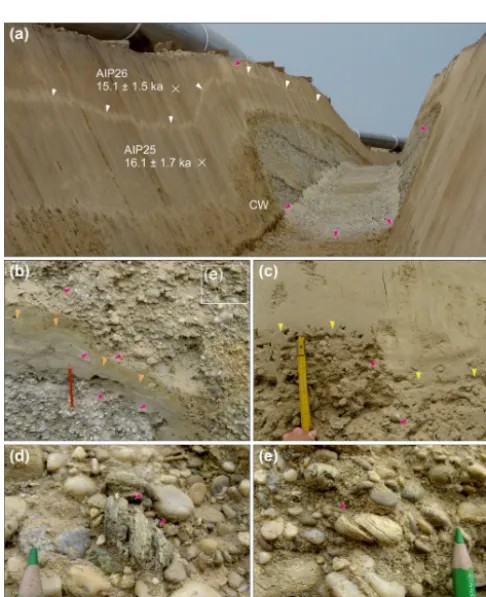
Figure 10. (a)Trench WAG looking NW toward the footwall of the MF (fault trace denoted by red arrows). Note offset of bright layer of loess (white arrows) corresponding to C1. CW denotes the
col-luvial wedge related to earthquake C2.(b)Detail of the SW-facing
trench wall. Red arrows denote locations of faults, while orange ar-rows point to the offset contact between grey and brown silt and
clay. Box shows location of details shown in panel(d).(c)Offset of
the top of the colluvial wedge associated with earthquake C2
(yel-low arrows).(d, e)Fractured and sheared pebbles indicating normal
displacement parallel to the slip of the MF. Note that fractures in pebbles are filled with sandy matrix excluding fracture formation during construction work.
4.2.1 Evidence for seismic events observed within trench SDF3
displacement of B2. Interpreting the wedge-shaped deposit as a classical colluvial wedge adjacent to a fault plane which is not readily seen due to unfavourable outcrop conditions, a minimum displacement can be estimated by multiplying the maximum wedge height by 2 (McCalpin, 2009), which suggests displacement of 2×0.8 m=1.6 m for B2. For the case of wedge formation by gelifluction, the coseismic sur-face displacement would be approximately the same as the colluvial wedge height, i.e. 0.80 m. We consider the latter scenario (referred to as the “periglacial wedge” in the fol-lowing) as the more fitting one and therefore use 0.80 m as the preferred value for the surface displacement for B2. Since B2 is directly on top of unit W3 and is covered by the grav-els of U6, its occurrence can be bracketed between the de-position of units U5 and U6, similar to B3. Insights for the youngest event B1 in the trench are the most obvious. Dip-slip displacement of about 10 cm along F1 affected all layers excluding only the soil horizons (U9 and U10), suggesting that even with such a small displacement of 10 cm, event B1 ruptured the surface (Fig. 8a).
4.2.2 Age control in trench SDF3
The fine-graded sandy deposits of U3 (AIP93, 158±21 ka), U4 (AIP95, 123±16 ka), U5 (between 111±12 ka, AIP95 and 70.8±8.0 ka, AIP97), U7 (32.9±4.1 ka, AIP98), and U10 (4.8±0.5 ka, AIP102) in the hanging wall provide ma-terial suitable for IRSL sampling. The dating results (de-tails see Table 1) follow the chronological order of the sed-imentary deposits well. In addition, two samples from sand lenses within unit U2 (AIP103 and AIP114) determine the minimum age of the footwall to be 205±37–259±35 ka. Those obtained ages agree well with other IRSL ages for the Gaenserndorf terrace (Weissl et al., 2017).
The IRSL data of the hanging wall constrain roughly the occurrence times of the five observed palaeoearthquakes along the main fault. B1 has affected U6 and the base of U8, and therefore also U7, constraining its occurrence after 32.9±4.1 ka. As units U9 and U10 seal F1, B1 must have oc-curred before 4.8±0.5 ka. As mentioned above, B2 and B3 are bracketed between units U7 and the top of U5, limiting its occurrence time between 32.9±4.1 and 70.8±8.0 ka. B4 and B5 are also jointly constrained between the deposition of unit U4 (111±12 ka) and the base of U5 (123±16 ka).
4.3 Outcrop WAG
Additional evidence for active faulting at the MF is available from the construction pit of a gas pipeline, which crosses the northern part of the fault scarp close to the city of Gaensern-dorf, 6 km north of trench SDF1 (Fig. 3a). The outcrop re-vealed a 1 m wide localized fault zone (Figs. 9, 10a). The fault cuts light-grey gravel and sand of the Gaenserndorf Terrace and overlying approximately 1 m thick fine-graded silty to sandy deposits constituting its footwall. The
ex-posed hanging wall succession includes poorly sorted sandy gravels, which is then overlaid by a banded sequence of silty sediments. This cover layer can be found all along the pipeline construction pit and has been described in detail by Weissl et al. (2017). Two IRSL samples from fine-graded silty to sandy cover were dated to ages of 15.1±1.5 and 16.1±1.7 ka, respectively (samples AIP25 and 26; Table 1), giving the only time constraint at the WAG site. Both the hanging wall and footwall are overlain by ca. 30–50 cm thick brown soil, which has been removed prior to excavation. The exposed fault zone consists of several faults within the ter-race gravel marked by aligned and fractured pebbles, faults offsetting sand layers, and faults offsetting the contact be-tween gravel units and the overlying cover silts (Figs. 9 and 10b, c). Several sheared pebbles indicate dip-slip movement along the faults (Fig. 10d, e). The displacements of these faults are between 10 and 20 cm. On the SW wall, a fault cuts up through the entire silty section to the base of the overlying soil, offsetting a thin white layer within the upper part of the cover silty sediments by 20 cm (Fig. 10a). This dip-slip offset indicates evidence for the youngest earthquake at the WAG site, C1. This earthquake must have happened after the depo-sition of the silty cover sediments, i.e. after 15.1±1.5 ka. In Fig. 10a, the poorly sorted sandy gravels in the hanging wall form a wedge-shaped deposit close to the fault (marked with CW). This can be interpreted as a colluvial wedge associated with an earthquake C2 that occurred before the deposition of the silty cover sediments. Therefore, C2 must be older than 16.1±1.7 ka. Since the base of the colluvial wedge is not identifiable, a displacement of C2 cannot be assessed.
5 Correlation of events between sites
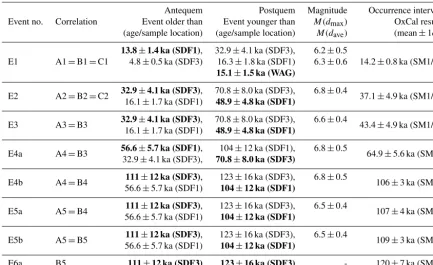
Table 3.Overview of characteristics of each possible earthquake derived from all sites.
Event no. Correlation
Antequem Postquem Magnitude Occurrence interval
Event older than Event younger than M(dmax) OxCal result
(age/sample location) (age/sample location) M(dave) (mean±1σ)
E1 A1=B1=C1
13.8±1.4 ka (SDF1), 32.9±4.1 ka (SDF3), 6.2±0.5
14.2±0.8 ka (SM1/2)
4.8±0.5 ka (SDF3) 16.3±1.8 ka (SDF1) 6.3±0.6
15.1±1.5 ka (WAG)
E2 A2=B2=C2 32.9±4.1 ka (SDF3), 70.8±8.0 ka (SDF3), 6.8±0.4 37.1±4.9 ka (SM1/2)
16.1±1.7 ka (SDF1) 48.9±4.8 ka (SDF1)
E3 A3=B3 32.9±4.1 ka (SDF3), 70.8±8.0 ka (SDF3), 6.6±0.4 43.4±4.9 ka (SM1/2)
16.1±1.7 ka (SDF1) 48.9±4.8 ka (SDF1)
E4a A4=B3 56.6±5.7 ka (SDF1), 104±12 ka (SDF1), 6.8±0.5 64.9±5.6 ka (SM1)
32.9±4.1 ka (SDF3), 70.8±8.0 ka (SDF3)
E4b A4=B4 111±12 ka (SDF3), 123±16 ka (SDF3), 6.8±0.5 106±3 ka (SM2)
56.6±5.7 ka (SDF1) 104±12 ka (SDF1)
E5a A5=B4 111±12 ka (SDF3), 123±16 ka (SDF3), 6.5±0.4 107±4 ka (SM1)
56.6±5.7 ka (SDF1) 104±12 ka (SDF1)
E5b A5=B5 111±12 ka (SDF3), 123±16 ka (SDF3), 6.5±0.4 109±3 ka (SM2)
56.6±5.7 ka (SDF1) 104±12 ka (SDF1)
E6a B5 111±12 ka (SDF3) 123±16 ka (SDF3) - 120±7 ka (SM1)
IRSL constraints in bold mark the upper and lower limit for each occurrence time. Occurrence times are calculated with OxCal (see Fig. 11) using stratigraphic constraints from all sites. SM1 and SM2 refer to slip model 1 and 2, respectively. For details about correlation between the trenches, see Sect. 5.
5.1 Event E1 (A1 =B1=C1)
In all three excavations, the youngest event is evident from a measurable offset of layers across the MF. At trench site SDF1, the youngest event A1 shows dip-slip displacements of 15–25 cm (Fig. 6a). Its occurrence time is bracketed be-tween 13.8±1.4 and 16.3±1.8 ka. At trench site SDF3, markers have been displaced by the youngest event B1 by 10–15 cm along dip (Fig. 8a). IRSL dating results limits the occurrence time of B1 to the time range between 4.8±0.5 and 32.9 ±4.1 ka. In the pipeline trench WAG, the loess cover is dated between 15.1±1.5 and 16.1±1.7 ka. It is dis-placed along dip by 17–20 cm, visible by a white marker within the loess (Fig. 10a). Therefore, C1 must have hap-pened after 15.1±1.5 ka.
Combination of constraints for E1 from all three sites yields to an occurrence time of 14.2±0.8 ka. Using the empirical relationship between surface displacement and magnitude (Wells and Coppersmith, 1994) for the maxi-mum displacement of 25 cm, the magnitude estimate for E1 is M(dmax)=6.2±0.5. The average displacement of 17 cm would lead to a similar magnitude estimate of
M(dave)= 6.3±0.6.
5.2 Event E2 (A2=B2=C2)
Event E2 is also observed at all three sites as a triangular-shaped colluvial wedge mainly consisting of reworked grav-els derived from the terrace in the footwall (Figs. 6b, 8a, 9). In addition, the colluvial wedges deposits related to A2 and B2 are displaced by the younger event E1, confirming the correlation of the colluvial wedges to the penultimate seis-mic event E2. At trench site SDF1, the displacement related to A2 (1.5–1.9 m) is estimated from the height of the associ-ated colluvial wedge (0.75–0.95 m). IRSL samples from sed-iments above and below the colluvial wedge constrain the oc-currence time for A2 between 16.1±1.7 and 48.9±4.8 ka. At trench site SDF3, the interpretation of deposits related to B2 are more ambiguous (see Sect. 3.2), and therefore the es-timated displacement is either 0.8 m (periglacial wedge sce-nario) or 1.6 m (colluvial wedge scesce-nario). B2 is constrained between 32.9±4.1 and 70.8±8.0 ka by the IRSL ages of sediments above and below the colluvial wedge material. In the pipeline construction trench WAG, the displacement of E2 is not constrained because the base of the wedge was not excavated. The maximum age of 16.1±1.7 ka for the loess covering the colluvial wedge gives a minimum age for the occurrence of C1.
ob-SDF1
AIP 39
A5 A4
AIP 40 AIP 41
A3 A2
AIP 44 A1 AIP 46
140 120 100 80 60 40 20 ka
OxCal v4.3.2 Bronk Ramsey (2017); r:5
WA
G
C2
AIP 25 AIP 26
C1
SDF3
AIP 93 AIP 95
B5 B4
AIP 97
B3 B2
AIP 98 B1
AIP 102
AIP 96
120 100 80 60 40 20 ka
OxCal v4.3.2 Bronk Ramsey (2017); r:5
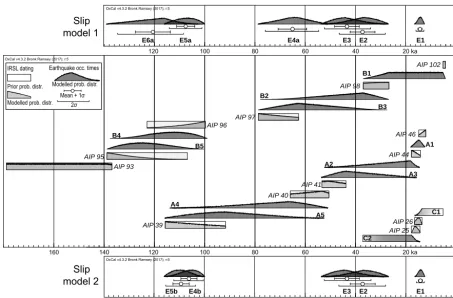
E5b E4b E3 E2 E1
120 100 80 60 40 20 ka
OxCal v4.3.2 Bronk Ramsey (2017); r:5
E5a E4a E3 E2 E1
E6a
160
Slip model 1
Slip model 2
Modelled prob. distr. Mean + 1σ
2σ Modelled prob. distr.
Earthquake occ. times IRSL dating
Prior prob. distr.
Figure 11.Comparison of age constraints from all trench sites (SDF1, SDF3, and WAG) and possible occurrence times of the observed earthquakes for the two possible slip models. The central panel shows the age constraints and earthquake occurrence times for each site separately. For the WAG site, only maximum constraint for C1 and minimum constraint for C2 are available. The upper and lower panels show the resultant earthquake occurrence times considering the combined chronostratigraphic constraints from all sites together for slip models 1 and 2, respectively. For details about correlation see Sect. 5. Calculations carried out using OxCal v4.3.2 (Bronk Ramsey, 1995, 2001).
served surface displacements results in a magnitude of
M(dmax)=6.8±0.4 (Wells and Coppersmith, 1994). With the maximum value for the observed surface displacement coming from trench SDF1, the magnitude estimate does not depend on the interpretation for the B2 deposits in trench SDF3.
5.3 Event E3 (A3, probably correlated with B3) For this event, a correlation based on field observations be-tween the trenches SDF1 and SDF3 is not as clear as in the cases of E1 and E2, especially since the evidence for B3 does not allow to determine a displacement for this event. How-ever, the maximum height of a well-developed sandy collu-vial wedge in SDF1 gives a good estimate of an earthquake withM(dmax)=6.6±0.4 (Fig. 6c). Because of the similar stratigraphic constraints, the combined possible occurrence time of E3 at 43.4±4.9 ka overlaps with that one of E2 (Fig. 11, lower and upper panels).
5.4 Event E4a (A4, if correlated with B3)
Due to the loose time constraint of B3, another possible cor-relation scenario between the trench sites SDF1 and SFD3 is the correlation of events A4 and B3 (slip model 1 in Fig. 11, upper panel). If A4 and B3 are correlated to the same seis-mic event E4a, the overlap of possible occurrence times of A4 and B3 narrows the resultant occurrence time for E4a to 64.9±5.6 ka. Observations of the maximum wedge height at trench site SDF1 indicate the magnitude of A4 (and therefore for E4a) toM= 6.8±0.5.
5.5 Event E4b (A4, if correlated with B4)
Simi-lar to E4a, the magnitude for E4b can be estimated from the observations of the maximum wedge height of A4 at trench site SDF1, indicating a magnitude for E4b ofM= 6.8±0.5. 5.6 Event E5a (possible correlation between A5 and
B4) and Event 5b (possible correlation between A5 and B5)
The further back in time, the more uncertain the correla-tion between both trench sites becomes. So, whether A5 and B5 are correlated to event E5a or A5 and B4 are correlated to event E5b is not clearly determined by observations or dating. Both alternatives are possible and only depend on whether A4 is correlated to B3 or to B4. In slip model 1 (Fig. 11, upper panel), where A4 is correlated with B3, it appears reasonable to assume subsequently that A5 equals to B4. In contrast, if A4 is correlated with B4 (slip model 2, Fig. 11, lower panel), the remaining correlation for the next older event would be that A5 corresponds to B5. Due to the loose time constraints in the lower part of all trenches, the available chronostratigraphic constraints for E5a and E5b are identical to those used for E4b (Fig. 11, central panel). How-ever, additional constraints of chronological order demand that E5a and E5b must have happened earlier than E4a and E4b, respectively. This yields slightly different occurrence times of 107±4 and 109±3 ka for E5a and E5b, respec-tively. Since both magnitude estimates for E5a and E5b are based on the maximum colluvial wedge height of A5 from trench SDF1, the magnitude of E5a and E5b isM= 6.5±0.4. 5.7 Event E6a (B5, if not correlated with any event in
SDF1)
For the case that B5 is not correlated with any events recorded in trench SDF1 (slip model 1), the timing of E6a would be bracketed by the IRSL dating results of 111±12 and 123±16 ka. In addition, with A5 (correlated to E5a) be-ing the oldest earthquake evidence in SDF1, E6a might be older than the oldest deposits in SDF1 and therefore not vis-ible there. Both time constraints yield to an occurrence time of 120±7 ka for E6a. Unfortunately, the magnitude of this possible seismic event cannot be constrained by trench ob-servations
6 Seismotectonic implications
6.1 Completeness and preservation potential of earthquake records along the MF
The comparison between the evidence for youngest surface-breaking earthquake E1, which did not lead to the forma-tion of colluvial wedges, and the older events, which are characterized by larger offsets and colluvial wedges through-out, raises the question on the completeness of the palaeo-seismological earthquake record. It seems that the colluvial
wedges associated with larger earthquakes that rupture the same surface-breaking fault conceal or even erase evidence for smaller offsets by earthquakes such as E1. The displace-ment of the markers by E1 is only preserved because the event happened after the last earthquake (E2) that caused a colluvial wedge to form. Any future event with a surface dis-placement that is large enough to lead to the erosion of the offset markers in the footwall will destroy the evidence for E1. We conclude that this restriction also applies to earth-quakes with small surface offset that occurred prior to E2. Therefore, earthquake records for magnitudes less than about 6.5 are most probably incomplete and thus excluded from the recurrence calculation.
6.2 Recurrence intervals for earthquakes with magnitudes larger than 6.5 along the MF
The possible correlations of palaeoearthquakes between the trenches allow for two different interpretations to assess the recurrence intervals of earthquakes with magnitudes larger thanM= 6.5. The event E1 will be excluded during the fol-lowing considerations, since the related magnitude estimate is lower than those obtained for E2–E5a/b.
As mentioned in Sect. 5, the crucial part for the recon-struction of recurrence intervals therefore is whether A4 is correlated either to B3 or to B4 and, consequently, whether A5 is correlated to B4 or to B5, resulting in the following slip models.
– Slip model 1: E2–E3 (not correlated to B3)–E4a–E5a– E6a (five earthquakes);
– Slip model 2: E2–E3 (correlated to B3)–E4b–E5b (four earthquakes).
Recurrence intervals are calculated using OxCal v.4.3.2 (Bronk Ramsey, 1995, 2001) and the results are shown in Fig. 12. Despite the large uncertainties, the plots show that the slip models may represent different types of earthquake distributions.
Interval E2-E3 Interval E3-E4b Interval E4b-E5b
Interval today-E2
0 20 40 60 80 100
OxCal v4.3.2 Bronk Ramsey (2017); r:5 Slip model 2
Interval E2-E3 Interval E3-E4a Interval E4a-E5a Interval E5a-E6a
Slip model 1
Interval E5b - bottom SDF3
Modelled prob. distr. Mean + 1σ
2σ
Time (ka)
Figure 12.Recurrence intervals for slip model 1 (upper panel) and slip model 2 (lower panel), respectively.
For slip model 2 (E2–E3–E4b–E5b), the average recur-rence interval of 24±34 kyr is predictably similar to that of slip model 1, but with a larger standard deviation. How-ever, the distribution of earthquake recurrence intervals in slip model 2 differs significantly from slip model 1 by show-ing a bimodality (Fig. 12, lower panel). As mentioned above, the probability distribution for the interval E2–E3 peaks at 0 and so does the interval for E4b–E5b. The most likely interval between E3 and E4b (63±6 kyr) is 10–20 times larger than those for E4b–E5b (3.2±2.6 kyr) and E2–E3 (6.2±4.7 kyr). Inferring a clustered behaviour for earth-quakes along the MF for slip model 2, the average clus-ter length would be 4.7±3.8 kyr. The elapsed time inter-val between clusters E2–E3 and E4b–E5b corresponds to the interval E3–E4b. In addition, the time since the occur-rence of E2 until today can be also considered as a minimum time between clusters (37±5 kyr). Furthermore, another es-timation of the minimum time between clusters can be esti-mated from the oldest layers in trench SDF3 (unit U8) dated to 158±21 ka (Sect. 3.2). Since there is no older record than B5, it is reasonable to assume that there was no earth-quake during the time between B5 and the oldest unit U8 exposed in SDF3. Therefore, the minimum time elapsed be-tween B5 (correlated to E5b) and any older cluster must be at least 49±13 kyr. The average recurrence interval between clusters would be therefore at least 49±13 kyr. Adopting slip model 2 and assuming that M≥6.5 earthquakes
clus-ter along the MF may lead to the presumption that the MF is between clusters at the moment. Because the time since the last cluster (37±5 kyr) is below the average recurrence interval for clusters, the likelihood of aM≥6.5 earthquake along the MF might be considered low at the moment, with the next cluster most likely to occur in approximately 10 kyr.
6.3 Comparison of long-term Quaternary slip rates with palaeoseismological slip rates
0 20 40 60 Tim e (ka)80 100 120 140 0
1 2 3 4 5
E4b E1
0.09 mm a
0.02 mm a
E2
0 20 40 60 Tim e (ka)80 100 120 140
C
um
ul
at
iv
e
d
is
p
la
ce
m
en
t (
m
)
0 1 2 3 4
5 0.09 mm a
0.02 mm a Possible slip history
Geomorphic slip rates
Earthquake occurrence times (+/- 2 sigma)
Slip model 1
? ?
E3 E5b
?
E4a
E1 E2 E3 E5a E6a
Max
Min
Max
Min?
Possible slip history
Geomorphic slip rates
Earthquake occurrence times (+/- 2 sigma)
Slip model 2
C
um
ul
at
iv
e
d
is
p
la
ce
m
en
t (
m
)
-1
-1
-1
-1
(a)
(b)
Figure 13.Comparison of surface slip rates for the Markgrafneusiedl Fault (MF) from geomorphic constraints and from trench results. On the left the constraints for slip model 1 are plotted; on the right, those for slip model 2 are shown.
would be between 0.02 and 0.05 mm a−1 for the time since E2 (37±5 ka) using either 0.9 m (E1+periglacial wedge) or 1.7 m (E1+colluvial wedge).
Long-term Quaternary slip rates of the MF can be esti-mated from the offset of two marker horizons, the top of the Gaenserndorf terrace and the base of the Quaternary de-posits. The top of the Gaenserndorf terrace forms the cur-rent land surface in the footwall of the MF. As the top of the Gaenserndorf terrace is not exposed in the hanging wall sections of the trenches, and thus is buried below the present-day surface at the hanging wall, the height of the morpholog-ical scarp of about 17 m (Fig. 3b) represents minimum dis-placement accumulated since the abandonment of the fluvial terrace 200 ka (Weissl et al., 2017). The resulting minimum Quaternary slip rate is 0.09 mm a−1.
The base of the Quaternary gravels in the hanging wall of the MF, which is equivalent to the top of Neogene sed-iments, is offset by approximately 40 m with respect to the base of the Gaenserndorf terrace in the footwall of the MF
(Fig. 3b). In the absence of age information for the gravels in the hanging wall of the MF and the bottom of the Gaensern-dorf terrace, the oldest available age for the GaensernGaensern-dorf ter-race, 322±41 ka (Weissl et al., 2017), is used for estimating a maximum long-term slip rate for the MF of 0.12 mm a−1. A minimum slip rate of 0.02 mm a−1is calculated from the 40 m displacement of the Quaternary gravels which must have accumulated after the Neogene–Quaternary boundary (2.6 Ma). Figure 13 shows the range of possible slip rates for both slip models falling between the bracket of the geomor-phic slip rates, which are in reasonable agreement.
6.4 Comparison of magnitude estimates with fault rupture area and length
east-Vienna
MF
VBTF
VBTF SDF1
SDF3
WAG
580 km²
25 km
ABF
SF
BNF
LF
16°50' E 16°40' E
16°30' E 16°20' E
16°10' E
N'
0
2°
84
N'
0
1°
84
'
0°
84
N
0
km 5 10 15
Figure 14. Geometry and fault area of the Markgrafneusiedl Fault (MF). Also shown are the Vienna Basin Transfer Fault (VBTF) and other active normal splay faults branching from the VBTF. ABF: Aderklaa–Bockfliess fault system; BNF: Bisamberg– Nussdorf fault; LF: Leopoldsdorf fault; SF: Seyring fault (redrawn from Decker et al., 2015). Broken grey line marks the city limits of Vienna.
ern margin of the Pleistocene Gaenserndorf terrace (Fig. 3a). Further to the south, the River Danube has erased any geo-morphic expression in its Holocene flood plain. However, the geometry and the length of the MF are well known from the distribution of Quaternary sediments in the hanging wall of the fault and 2-D/3-D reflection seismic (Hölzel et al., 2010; Hinsch and Decker, 2011; Salcher et al., 2012; Spahi´c et al., 2013). These data constrain the length of the MF to 25 km (Salcher et al., 2012). In addition, Hinsch and Decker (2011) proposed a generalized detachment for the Vienna Basin (see Fig. 2). Beneath the MF, the detachment is assumed to be at the depth of about 10 km (Wessely, 2006). Taking into ac-count the general dip of 55◦for the MF observed in seismic lines, the rupture area of the MF above the detachment would amount to 315 km2, leading to a maximal credible magnitude of 6.5±0.3. However, in case that the MF is indeed linked to the VBTF via the common detachment as proposed by Beidinger and Decker (2011), the area of the detachment be-tween the MF and VBTF might be also activated during large events (Fig. 14). The total fault surface activated during such events is derived as the sum of the fault surface of the MF and the portion of the basal detachment between the MF and the VBTF, which has a size of about 130 km2. The fault length of the MF in this tectonic scenario is 36 km and the total fault area amounts to about 580 km2. These fault parameters cor-respond to a maximal credible magnitude of 6.7±0.3 for earthquakes along the MF using the relationships of Wells and Coppersmith (1994), which is in good agreement with the palaeoseismological magnitude estimations derived from our trenches.
6.5 Mmaxfor the Vienna Basin
Previous estimates of the maximum earthquake (Mmax) for the Vienna Basin are based on the evaluation of histori-cal and instrumental seismicity only and present values for
Mmaxbetween 6.0 and 6.5 (Lenhardt, 1995; Procházková and Simunek, 1998; Sefara et al., 1998; Tóth et al., 2006). In con-trast to these assessments, the results of our study suggest that earthquakes with magnitudes up to aboutM=7.0 are likely to occur on longer timescales and with larger recur-rence rates. Based on the data from the MF presented here, the upper limit of scaling relationships, observed surface rup-tures in trenches, and the rupture area of the MF yield to a value ofMmax= 7.0. Considering that the MF and the other normal splay faults are connected to the VBTF via the com-mon detachment (Figs. 2, 14), a possible combined rupture along the MF and the VBTF would increase theMmaxfor the Vienna Basin. Hinsch and Decker (2011) present different rupture scenarios along the VBTF withMmax on the order of 5.9–6.8 for single-segment ruptures of different strike-slip segments of the VBTF. The assumption of scenarios such as earthquakes rupturing several strike-slip segments or events rupturing parts of the VBTF combined with secondary rup-ture along one of the normal splay faults would definitively increase theMmax. Therefore,Mmax= 7.0 should be consid-ered in seismic hazard studies as a minimum for the Vienna Basin. However, there are not enough data so far to prove or disprove any of those scenarios, but recent earthquakes suggest that masked or blind faults may contribute to the de-velopment of multi-segment ruptures (e.g.Mw=7.2 2010 El Mayor–Cucapah Earthquake andMw=7.8 2016 Kaikoura Earthquake; Fletcher et al., 2014; Clark et al., 2017).
7 Conclusions and implications for seismic hazard assessment