To
Aai and Baba, need I say more ?
Cover picture: Adaptation of the hematopoietic scheme, with kind permission from Prof.Larry Rohrschneider (Fred Hutchinson Cancer Research Centre)
Chair:
Prof. Dr. med. Wolfgang Hiddemann
Characterisation of the leukemic stem cell in a murine
model of CALM/AF10 positive myeloid leukemia
Thesis Submitted for a Doctoral degree in Human Biology
at the Faculty of Medicine Ludwig-Maximilians-University,
Munich, Germany
Submitted by
Aniruddha Jayant Deshpande
From
CBD (Navi Mumbai), India
Aus der Medizinischen Klinik und Poliklinik III am Klinikum Großhadern
und GSF, Klinische Kooperations Gruppe ‘Leukämie’
der Ludwig-Maximilians-Universität München,
Vorstand:
Prof. Dr. med. Wolfgang Hiddemann
Charakterisierung der leukämischen Stammzelle in einem
murinen Modell der CALM/AF10 positiven myeloischen
Leukämie
Dissertation zum Erwerb des Doktorgrades der Humanbiologie
an der Medizinischen Fakultät der Ludwig-Maximilians-
Universität zu München, Germany
Vorgelegt von
Aniruddha Jayant Deshpande
Aus
CBD (Navi Mumbai), Indien
University of Munich
Supervisor/Examiner:
Prof.
Dr. med. Stefan Bohlander
2
ndCo-Examiner:
Prof.Dr.rer.nat. Peter B. Becker
Co-examiners
Prof.Dr.phil. Judith P. Johnson
Priv.Doz.
Dr.rer.nat.
Johannes
Herrmann
Co-Supervisor:
PD.
Dr.
med.
Christian
Buske
Dean:
Prof. Dr. med. Dietrich Reinhardt
Gedruckt mit Genehmigung der Medizinischen Fakultät
der Universität München
Berichterstatter:
Prof. Dr. med. Stefan Bohlander
2.
Berichterstatter:
Prof.Dr.rer.nat. Peter B. Becker
Mitberichterstatter
Prof.Dr.phil. Judith P. Johnson
Priv.Doz.
Dr.rer.nat.
Johannes
Herrmann
Mitbetreuung durch den
promovierten
Mitarbeiter:
PD.
Dr.
med.
Christian
Buske
Dekan:
Prof.
Dr.
med.
Dietrich
Reinhardt
Tag
der
Mündlichen Prüfung:
Introduction
1.1 Hematopoiesis 2
1.1.1 Normal hematopoiesis 2
1.1.1.1 General overview 2
1.1.1.2 The hematopoietic hierarchy 2
1.1.2 Leukemic hematopoiesis 3
1.1.2.1 Differentiation arrest 4
1.1.2.2 Increased proliferation 4
1.1.2.3 Inhibition of programmed cell death/apoptosis 5
1.1.2.4 Telomere maintenance 5
1.1.2.5 Enhanced self-renewal 5
1.2 Stem cells and cancer 6
1.2.1 Stem cells and ‘stemness’ 6
1.2.1.1 Self-renewal 6
1.2.1.2 Multipotency 8
1.2.1.3 Quiescence 8
1.2.2 The cancer stem cell model 9
1.2.3 The need for identification of the leukemic stem cell 11
1.3 Translocations in leukemia 12
1.3.1 The t(10;11)(p13;q14) translocation in leukemia 13 1.3.2 CALM, AF10, and the CALM/AF10 fusion 14
1.4 Acute biphenotypic leukemias 17
1.4.1 ABLs in humans 17
1.4.2 ABL models in mice 17
1.4.3 Theories explaining biphenotypic character in ABL 18
1.4.3.1 Lineage infidelity 18
1.4.3.2 Lineage promiscuity 18
1.5 Mouse models of leukemia 19
I n d e x
Materials
2.1 Mice and related reagents and equipment 21
2.2 Mammalian cell lines 22
2.3 Oligonucleotides 22
2.4 Plasmids 23
2.5 Antibodies 24
2.6 Reagents, media and apparatus 25
2.6.1 Molecular biology 26
2.6.2 Cell and tissue culture 27
2.6.3 Miscellaneous 28
2.6.4 Software 29
Methods
3.1 Cloning of constructs 30
3.2 Preparation of high titre stable virus producing cell lines 31
3.3 Retroviral transduction of primary bone marrow 32
3.4 Bone marrow transplantation and assessment of mice 33
3.5 FACS analysis of murine cells 35
3.6 Ex Vivo proliferation and CFC Assays 35
3.7 Cytospin preparations and Wright Giemsa staining 36
3.8 Colony-Forming Unit–Spleen (CFU-S) Assay 37
3.9 Quantification of leukemia propagating cell frequency 37
3.10 RNA and genomic DNA isolation and cDNA preparation 38
3.11.1 Southern blot analysis 38
3.11.2 Western blotting (immunoblotting) 39
3.12 PCRs 42
3.12.1 PCR for transcriptional profile analysis 42 3.12.2 PCR for V-D-J recombination status 42
3.13 Statistical analysis 43
Results
4.1 Cloning and expression of CALM/AF10 44
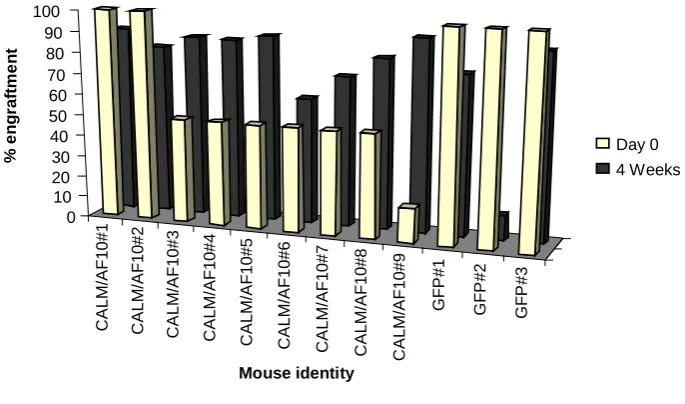
4.2 CALM/AF10 expression enhances the short-term engraftment potential of bone
marrow progenitors 46
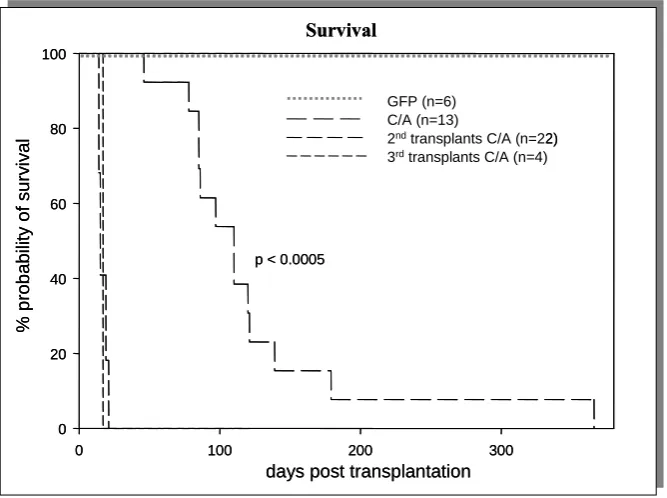
4.3 CALM/AF10 causes an aggressive acute leukemia in mice 47
4.4 Leukemic CALM/AF10 mice exhibit hyperleukocytosis and anemia 48
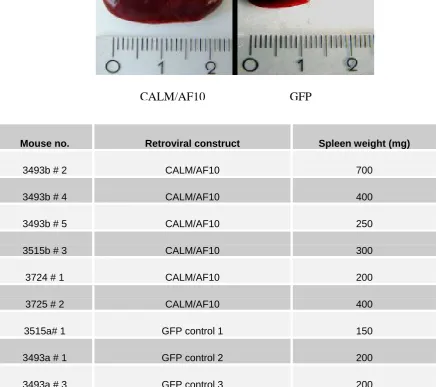
4.5 Spleens of leukemic CALM/AF10 mice are typically enlarged 49
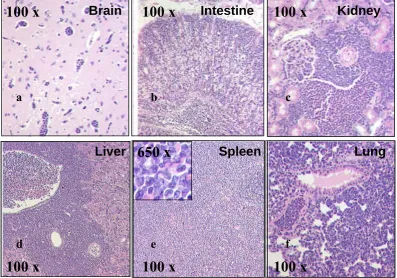
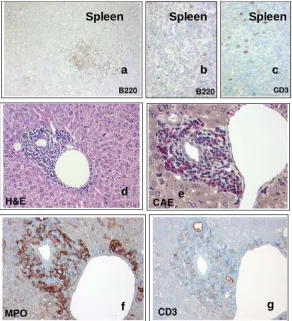
4.6 Leukemic blasts infiltrate multiple organs of CALM/AF10 mice 50
4.7 Leukemic blasts in CALM/AF10 mice stain for myeloid markers 51
4.8 Cells from hematopoietic organs of leukemic CALM/AF10 mice are predominantly myeloid in appearance with a high number of infiltrating blast
like cells 52
4.9 A subset of leukemic blasts from CALM/AF10 mouse bone marrow coexpress
lymphoid and myeloid markers 53
4.10 The CALM/AF10 induced leukemia is derived from several transformed clones
54
4.11 Identification of the leukemia propagating sub-fraction in the leukemic bone
I n d e x
4.12 B population cells have a higher proliferative potential at the single cell level
compared to the B/M and the M population 56
4.13 The frequency of leukemia propagating cell is the highest in the B population as compared to the B/M population and the M population 57
4.14 Transformed CALM/AF10 B population blasts can differentiate into B/M and functionally myeloid M population cells in vitro 58
4.15 Clonal D-JH rearrangements can be detected in all sub-populations derived
from B population cells 59
4.16 IgH D-J rearrangements can be detected in myeloid populations of cells from
leukemic CALM/AF10 mice 60
4.17 B population cells are Pax5 negative but express the early B cell factor gene
EBF 62
4.18 The B population cells express various early B lineage markers 63
4.19 The expression of CALM/AF10 in bone marrow progenitors enhances the
recovery of day 12 CFU-S 64
4.20 The leucine zipper-octapeptide motif domain is critical for the hematopoietic
activity of CALM/AF10 65
Discussion 66
Summary 71
Zusammenfassung 72
References 73
Acknowledgements 86
Curriculum vitae 88
C h a p t e r I - I n t r o d u c t i o n
1.1
Hematopoiesis
1.1.1
Normal hematopoiesis
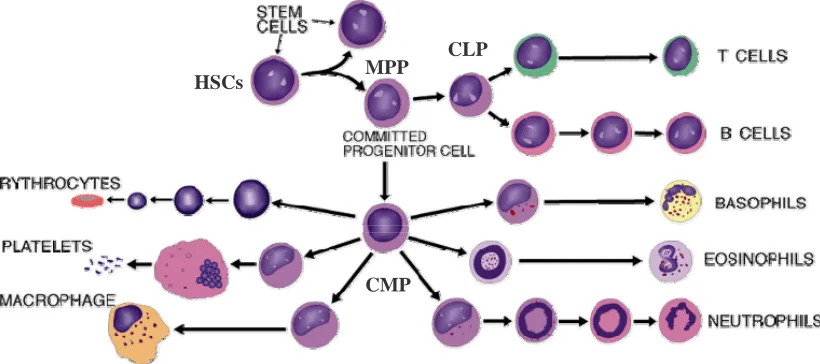
1.1.1.1 General overview: Hematopoiesis is a an orderly process of
alternate expression of specific transcriptional regulators, growth factors, and growth factor receptors, the combination of which determines lineage commitment and maturation of blood cells. The blood consists of various types of cells, broadly classified into myeloid and the lymphoid cells. The myelo-erythroid lineage includes erythrocytes that transport respiratory gases, platelets that play an important role in coagulation and monocytes and granulocytes that can migrate from blood vessels into other tissues and are involved in inflammation and phagocytosis. The lymphoid cells include the B lymphocytes, which provide immunity by the production of highly specific soluble antibodies, and the T lymphocytes, which are responsible for a variety of immune functions including the elimination of cells with foreign molecules on the surface. There is a notable difference in the function as well as morphology of these cells. Despite the diversity, a lot of evidence points to the fact that all these cells derive from a common precursor, the rare hematopoietic stem cell. The other hematopoietic cell types arising from this cell but found outside the blood are the dendritic cells and mast cells.
respectively. The CLP generates all mature lymphoid cell types including B and T lineage cells, platelets and NK cells. Dendritic cells can be generated from both CLPs as well as CMPs. Thus the hematopoietic hierarchy is composed of the stem cells, the committed progenitors and their progeny, the mature blood cells of all lineages.
CLP MPP
HSCs
CMP
Fig. 1.1.1.2 The hematopoietic hierarchy: The hematopoietic hierarchy consists of the hematopoietic stem cells (HSC), the multipotent progenitors (MPPs) and the more downstream progenitors, the common myeloid and the common lymphoid progenitor (CMP and CLP) respectively. Collectively, these give rise to all the mature cells of the hematopoietic lineage. (With permission from Larry Rohrschneider, Fred Hutchinson Cancer Research Centre)
1.1.2 Leukemic
hematopoiesis
C h a p t e r I - I n t r o d u c t i o n
PML/RAR α fusion gene, which has been shown to block differentiation, can also protect hematopoietic progenitors from apoptosis (Grignani et al., 2000). The involvement and significance of each of these mechanisms in AML is explained in some detail in this chapter with examples.
1.1.2.1 Differentiation arrest: AMLs are a heterogeneous group of diseases with blasts in varying degrees of maturation arrest. In fact the most commonly followed classification of AML, the French-American-British (FAB) classification divides leukemias into eight major subtypes (M0 to M7) based on the degree of differentiation along the myeloid lineage (Bennett et al., 1985). The FAB classification was recently updated in the WHO classification, taking morphology, immunophenotype and cytogenetics into account and defining acute leukemia to have more than 20% blasts in bone marrow (Brunning, 2003). As is discussed in the chapter on normal hematopoiesis, differentiation from primitive progenitors to mature cells in the hematopoietic system is governed by lineage specific transcription factors, the pathways for which have been elaborately defined (reviewed (Zhu and Emerson, 2002)). It was postulated that several of these pathways would be disrupted in leukemias and recent studies have confirmed this hypothesis (Tenen, 2003). One transcriptional factor complex that has been very frequently targeted by AML is the core binding factor (CBF) consisting of the AML1 gene and the CBFβ gene. 12 different translocations have been found to target this complex accounting for 25% of all leukemias (Speck and Gilliland, 2002). It is interesting to note that in the vast majority of fusion proteins resulting from a leukemogenic event, one of the partners is a transcription factor. Moreover, AML-associated fusion proteins have been shown to affect hematopoietic differentiation in a variety of experimental models, and the specific stage of myeloid maturation arrest appears to depend on the nature of the fusion protein expressed (Huntly et al., 2004). It is becoming increasingly apparent that the abnormal network of transcriptional regulation induced by leukemia associated genes leads to a block in differentiation. However, as shown in several studies, a block of differentiation is not solely sufficient to induce transformation and must be associated with an increase in proliferation.
have previously been shown to disrupt normal hematopoietic differentiation without causing leukemia in mice (de Guzman et al., 2002; Grisolano et al., 1997; Pollock et al., 1999). It has been demonstrated in experimental models that mutations in the receptor tyrosine kinase FLT3 inducing constitutive activation could provide proliferative advantage in collaboration with PML/RARα (Kelly et al., 2002) and as shown recently in our laboratory, with
AML1/ETO (Schessl C, 2005). Clinical data showing the frequent presence of activating mutations in the mitogenic FLT3 and KIT receptor tyrosine kinases in AML (Reilly, 2003) supports the hypothesis that proliferative advantage could be provided to leukemic cells by activating mutations in tyrosine kinase receptors.
1.1.2.3 Inhibition of programmed cell death/apoptosis: Since the acquisition of mutations is a stepwise process, cells that have already undergone mutations, termed
preleukemic cells, must inhibit apoptotic events and survive for a longer time period to acquire more mutations ultimately leading to an increasingly transformed cell type. It should be noted that a high level of apoptosis in myelodysplastic syndromes (MDS) distinguishes them from AML and that the progression from MDS to AML reflects an increase in the expression of anti-apoptotic versus pro-apoptotic members of the BCL2 gene family (Davis and Greenberg, 1998). BCL2 upregulation in leukemias has been shown to correlate with poor response to therapy (Campos et al., 1993) and it has been proposed as a potential target for future therapy regimens (Konopleva et al., 2000). Recent studies have demonstrated that the prevention of cell death is one of the key events in myeloid transformation that probably sets the stage for acquiring new mutations.
1.1.2.4 Telomere maintenance: The ‘Hayflick limit’ (Hayflick, 1997), the upper limit on the number of times a cell can divide, imposed on a cell by shortening telomeres, has to be overcome in cancer as the tumor cell divides infinitely to propagate the tumor. Enhanced telomere maintenance is therefore a prerequisite to the limitless propagation of the leukemia stem cell in AML. Indeed, increased levels of telomerase activity have been reported in 70% of all AML cases (Ohyashiki et al., 2002).
C h a p t e r I - I n t r o d u c t i o n
would then require the acquisition of stem cell characteristics by a targeted cell or alternatively, the direct targeting of a self-renewing stem cell to form a cancer stem cell. The aspect of stem cell properties in normal and cancerous cells is elaborated upon in the following chapter.
1.2
Stem cells and cancer
1.2.1 Stem cells and ‘stemness’:
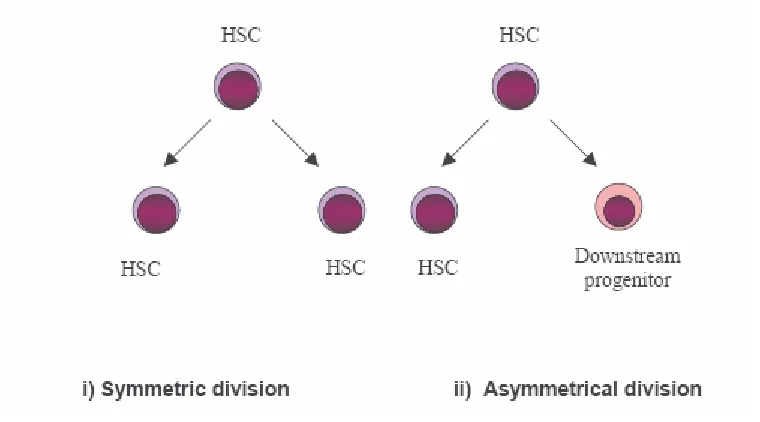
Stem cells can be classified into two main categories, embryonic stem cells and adult stem cells. Stem cells are clonogenic cells capable of both self-renewal and multilineage differentiation. Some adult tissues like blood, skin, gut etc. need a constant turnover of cells for tissue renewal. Tissue stem cells, which are adult stem cells, respond to this need as they consist of multipotent progenitors. Between birth and death, humans produce approximately 1016 blood cells of different types. These specialized cells are continuously produced from precursor cells, which in turn must be replaced by cells further up the blood hierarchy. Ultimately, the entire blood system is fed by a pool of rare hematopoietic stem cells (HSCs)(Dick, 2003). Several decades after the observation that cellular recovery can be attained following lethal irradiation by transplanting bone marrow, it was identified that the ability of such transplants to reconstitute hematopoiesis can be attributed to a few extremely rare stem cells found predominantly in the bone marrow but capable of mobilization into peripheral tissues via the blood vascular system. Since then, HSCs have been the best characterized stem cells at the phenotypic and functional level and the hematopoietic system has been the proving ground for most of the experimental procedures and conceptual paradigms for stem cell biology in general. HSCs and indeed most stem cells can be defined by certain unique properties, sometimes referred to as ‘stemness’, the most prominent of which are self-renewal, multipotency and quiescence. Since a discussion on stem cells in general is beyond the scope of this thesis, this part of the chapter will deal exclusively with hematopoietic stem cells.downstream progenitor with a reduced capacity of self-renewal (Warner et al., 2004)(Fig. 1.2.1.1). The downstream progenitor has a relatively enhanced proliferative capacity and it is necessary for clonal expansion and production of large numbers of committed progenitors and more differentiated hematopoietic cells. HSCs can be functionally separated into long-term repopulating stem cells, capable of indefinite self-renewal and short-term repopulating stem cells that self-renew for a defined interval (≈ 8 weeks in mice) (Passegue et al., 2003). The short-term repopulating stem cell then gives rise to the non self-renewing oligolineage progenitors which in turn give rise to progeny that are more restricted in their differentiation potential, and finally to functionally mature cells.
Figure 1.2.1.1 Symmetrical and asymmetrical division of hematopoietic stem cells: The symmetrical process yields two daughter HSCs from the parent HSC whereas the asymmetrical process yields one daughter HSC and one downstream progenitor.
In steady state bone marrow, hematopoietic stem cells divide rarely but mostly asymmetrically to retain their numbers as well as to produce the entire complement of cells necessary for normal hematopoiesis. Normal hematopoiesis therefore is a delicate balance between self-renewal and differentiation. This property of self-renewal, as is discussed later in this chapter, is a property shared by stem cells and cancer stem cells and acquisition of this characteristic is now believed to be a crucial turning point in the transformation process.
C h a p t e r I - I n t r o d u c t i o n
Buske et al., 2002; Thorsteinsdottir et al., 2002), the Wnt family (Reya et al., 2003) (Willert
et al., 2003) and to the Polycomb group (Kajiume et al., 2004; Lessard and Sauvageau, 2003a). There is also evidence suggesting a role of Notch (Karanu et al., 2000) and Sonic Hedgehog (Shh) (Bhardwaj et al., 2001) in HSC self-renewal though clear pathways elucidating the self-renewal process are yet to be demonstrated.
1.2.1.2 Multipotency: The major difference between embryonic and adult stem cells is that while the former is totipotent, i.e. it can give rise to all the cells of every tissue of the organism, the latter can be described as multipotent, i.e. they can give rise to all cells of a given tissue. The hematopoietic stem cell (HSC) can be operationally defined as a long-term repopulating cell with both lymphoid (T and B) and myeloid potential (Orlic and Bodine, 1994). HSCs normally function to generate all of the lineages of mature blood cell types necessary for maintaining proper hematopoietic function (Kondo et al., 2003). The ability of a single HSC to give rise to hematopoietic cells of all the different lineages (multipotency) is one of the hallmark properties of a HSC. The HSC gives rise to committed progenitors that can proliferate extensively to produce the billions of differentiated cells that enter the peripheral blood per day. Prospectively isolated hematopoietic progenitors have increasingly limited differentiation potential as they branch out from the HSC. The multipotency of HSCs is thought to be disrupted in leukemias due to blocks in differentiation and/or the dysregulation of certain lineage specific transcription factors.
1.2.1.3 Quiescence: Quiescence, or the relatively slow cycling of HSCs, in marked contrast to the rapidly proliferating progenitors is necessary to protect the stem cell compartment from toxic and oxidative stress and to prevent consumption of the regenerative cell pool, an occurrence known as stem cell exhaustion (Cheng et al., 2000). HSCs are relatively rare (1 in 10000 to 100000 cells in peripheral blood) and they reside in relatively larger numbers in the bone marrow of adult mice and humans where they are normally inactive (Bonnet, 2002). It was demonstrated by 5-bromo2’-deoxy-uridine (BrdU)
incorporation studies (for the measurement of cell proliferation) in mice, that approximately 75% of long-term repopulating HSCs (LT-HSCs) were in the G0 phase at any given time in
committed progenitors that produce mature hematopoietic cells in large numbers. HSCs can however, proliferate rapidly symmetrically in response to myelosuppressive chemotherapy or irradiation followed by bone marrow transplantation to give rise to committed progenitors as well as copies of more HSCs, which then return to the quiescent state (Dixon and Rosendaal, 1981). The control over quiescence is therefore especially crucial in conditions of stress, such as myelotoxic injury, to prevent hematopoietic death. There is little information about the molecular events that promote this process, though the bone marrow microenvironment or the ‘stem cell niche’ is believed to play an important role. Evidence that the local microenvironment is critical for controlling basic mechanisms of self-renewal and differentiation exists for normal stem cells (Lemischka, 1997; Schofield, 1983). Based on these studies, it seems likely that the tumor microenvironment is also critical for self-renewal of leukemia propagating cells with stem cells like properties or leukemic stem cells (LSCs). Thus, a major challenge for stem cell targeted therapy is to identify apoptotic stimuli that effectively target the tumor stem cell population while simultaneously sparing normal stem cells; and to do so in the context of a largely uncharacterized in vivo microenvironment. To meet this challenge, development and analysis of sophisticated LSC experimental systems is essential. As will be discussed below, recent findings indicate that leukemia stem cells retain several properties of stem cells, providing poor targets for therapeutic agents targeting rapidly proliferating cells (Hope et al., 2004).
1.2.2
The cancer stem cell model
C h a p t e r I - I n t r o d u c t i o n
probability of undergoing the required number of cell divisions is very low (Reya et al., 2001). The alternate hypothesis proposed by many investigators is a model in which every tumor contains a rare functionally distinct population of cells termed cancer stem cells (CSCs). The cancer stem cell is a cell that has tumor initiating function and can maintain the bulk tumor population as its clonal progeny. The cancer stem cell (CSC) hypothesis therefore suggests that neoplastic clones are maintained exclusively by this rare fraction of cells with stem cell properties.
The hematopoietic system provides for an excellent proving ground for testing these hypotheses. This is facilitated by the development of techniques over the last few decades, that allow the flow cytometric isolation of highly purified hematopoietic populations, (Akashi
the newly appreciated role of stem cells in many normal organ systems, it seems likely that cancer stem cells will be described in other tumor types in the near future.
1.2.3
The need for identification of the leukemic stem cell:
As is discussed at considerable length in the previous parts of the thesis, it has been established that one of the important events necessary for leukemic transformation is the abnormal retention or reacquisition of stem cell characteristics by a transformed cell. The striking similarity of LSCs with their normal counterparts has hampered the development of therapeutic strategies selectively targeting the LSCs but sparing normal stem cells or early myeloid committed progenitors for patients with AML. The quiescent nature of leukemia stem cells in CML has been clearly demonstrated (Holyoake et al., 1999). This observation is important because though the treatment of CML patients with the tyrosine kinase inhibitor imantib mesylate effectively induces remission, it cannot eradicate the disease (Bhatia et al., 2003; Holtz and Bhatia, 2004). The analysis of CML stem cells treated with imatinib mesylate showed that the quiescent stem cell population is resistant to the drug in vitro (Graham et al., 2002). Therapeutic approaches to leukemia have focussed mostly on elimination of rapidly proliferating cell, however, with the advancing knowledge about the relatively quiescent leukemia stem cell (LSC), the limitations of this approach have come to the fore. The identification of the LSCs in the bulk leukemic population that resist therapy and sustain the leukemia has therefore assumed great significance (Jamieson et al., 2004). Functional studies have shown that the more primitive CD34+/CD38- subset of multiple human AMLs are the minor fraction that can sustain the leukemia in xenograft studies in the non obese diabetic / severe combine immunodeficient (NOD/SCID) mouse model (which is employed for transplantation studies of human bone marrow cells) and that this population retains several attributes of the stem cell (Bonnet and Dick, 1997; George et al., 2001), though it has also been demonstrated that the LSC compartment could also exist in the more downstream CD34
C h a p t e r I - I n t r o d u c t i o n
vivo with maturation arrest at the same myelomonocytic stage regardless of the cell type used for transformation (Cozzio et al., 2003) and b) in the case of MLL/GAS7, the retroviral transduction of HSCs or their immediate downstream progeny, the MPPs result in leukemias of lymphoid, biphenotypic, and myeloid characteristics (So et al., 2003). It was also demonstrated that transgenic mice conditionally expressing the BCR-ABL and BCL2 genes in myeloid progenitors and their myelomonocytic progeny, but not in HSCs could still propagate AML (Jaiswal et al., 2003). More recently, the leukemia derived fusion gene MOZ/TIF2 has been shown to confer self-renewal properties to normally non self-renewing GMPs in a mouse model of myeloid leukemia (Huntly et al., 2004). These results indicate that leukemias can be originated in committed progenitors that acquire stem cell characteristics.
The identification and characterization of leukemia stem cells and more importantly, markers expressed differentially on leukemia and normal stem cells will therefore lead to the design of novel therapeutic approaches in leukemia. We sought to identify the leukemic stem cell in a mouse model of CALM/AF10 positive acute myeloid leukemia. Generally, two approaches that have been used to identify cancer stem cells, one approach that has been used for human CSC identification, wherein, the different sub-populations in a cancer have each been analysed for transplantability of the tumor (Bonnet and Dick, 1997; Singh et al., 2004) and the other approach, in which cells of a distinct differentiation stage are prospectively isolated, engineered to express the cancer specific mutation and tested for their ability to develop characteristics of a CSC under expression of the genetic alteration (Huntly et al., 2004; So et al., 2003); of these, we have used the former approach.
1.2
Translocations in leukemia
Frequently, these translocations involve genes encoding transcription factors that have been shown to play an important role in hematopoietic lineage development. It has been demonstrated that the chimeric fusion gene products or in some cases, putative proto-oncogene activation by the translocation event per se is responsible for the transformation (Rabbitts and Boehm, 1991). The cloning of breakpoints and the subsequent employment of techniques that allow testing them for the oncogenic potential (mouse bone marrow transplantation model) will allow the identification of new proto-oncogenes and shed light on intrinsic mechanisms of leukemic transformation.
1.3.1 The t(10;11)(p13;q14) translocation in leukemia
Chromosomal rearrangements involving the long arm of chromosome 11 and the short arm of chromosome 10 have been found in a variety of leukemias. The t(10;11)(p12-13;q23) translocation fuses the trithorax group gene MLL to the putative transcription factor AF10 and it was reported that the t(10;11)(p13;q14) translocation fuses the AF10 gene to the novel clathrin assembly lymphoid myeloid leukemia gene CALM (Dreyling et al., 1996). Interestingly both the translocations have a poor prognosis and low survival rate (Dreyling et al., 1998; So et al., 2003). The latter is a rare but recurring translocation and leads to the expression of the CALM/AF10 and in some cases the reciprocal AF10/CALM chimeric fusion transcripts.
t(10;11)(p13;q14)
AF10
CALM CALM/ AF10
AF10/ CALM
10 11 der(10) der(11)
C h a p t e r I - I n t r o d u c t i o n
frame CALM/AF10 fusion gene on the derivative chromosome 10 [der(10)] and a reciprocal AF10/CALM fusion gene on the derivative chromosome 11 [der(11)] (Figure courtesy S. Bohlander)
clathrin
α-adaptin
CATS
NH2
1 652
COOH 593 648
PtdIns(4,5)P2
ENTH
233 135
80 265
NH2
1 1027
PHD ext.PHD NLS
Leucine Zipper
AT-hook
SYT GAS41 breakpoints
Q-rich
COOH
i)
ii)
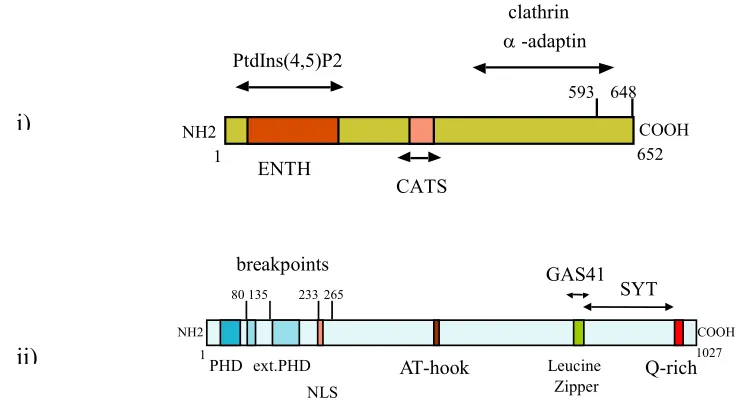
Fig. 1.3.2.a Schematic representation of CALM and AF10:
i) The CALM protein is a 652 amino acid protein with a proximal Epsin N terminal homology domain (ENTH domain) that bears a high homology with the N-terminal portion of the Epsin protein. Amino acids 221-294 of the CALM protein bind to CATS, a novel protein expressed strongly in the thymus and spleen.
ii) The AF10 protein is a 1027 amino acid protein with five N terminal plant homeodomain like (PHD) zinc fingers, an AT hook and a highly conserved octapeptide motif-leucine zipper domain. At the C terminal end, there is a glutamine rich domain. (Figure courtesy S. Bohlander)
1.3.2
CALM, AF10, and the CALM/AF10 fusion:
CALM-clathrin interaction has been shown to promote the assembly of CALM-clathrin triskelia into CALM-clathrin cages in vitro (Ford et al., 2002; Ford et al., 2001). Mutations in the AP180/CALM gene homologs in Drosophila (lap) (Nonet et al., 1999) and Caenorhabditis elegans (unc11) (Zhang et al., 1998) have suggested a role of these proteins in regulation of endocytic vesicle size during the clathrin assembly process. N-ethyl-N-nitrosourea (ENU) induced point mutagenesis in the murine Picalm gene resulted in disrupted hematopoiesis and reduced iron metabolism and retarded development in mice (Klebig et al., 2003). Interestingly, in a screen for identifying CALM interacting proteins using the yeast two hybrid system, Archangelo et al., identified a novel protein, termed CATS for CALM interacting protein expressed in thymus and spleen. CATS expression is limited to lymphoid organs and the CATS protein interacts with CALM in vitro and in vivo (Archangelo, 2005).The fact that the CALM gene is involved in two distinct translocations (CALM/AF10 and MLL/CALM) as well as the identification of several leukemia-associated fusion proteins in endocytosis points to a role of clathrin-mediated endocytosis (CME) in leukemia.
There is little known about the human AF10 gene except for the fact that it is found as a fusion partner of both CALM as well as MLL and is involved in different types of leukemias and lymphomas. The human AF10 gene is a homolog of the Drosophila dAF10, which is reported to play a role in the heterochromatin dependent genomic silencing of position effect variegation, ‘’a phenomenon associated with chromosomal rearrangements that cause mosaic
expression of euchromatic genes when relocated next to heterochromatin’’ (Linder et al., 2001). The AF10 gene, located on chromosome 10 band 12p, encodes a 1,027 amino acid protein (Fig.1.3.2a ii). The leucine zipper-octapeptide motif domain and the plant homeodomain like zinc finger domains are both highly conserved between AF10 and its homologs AF17 and BR140. The leucine zipper of the Drosophila homolog of AF10 (Alhambra) has also been implicated in the inhibition of Polycomb group responsive element (PRE) mediated repression (Perrin et al., 2003). Interestingly, this leucine zipper domain of
AF10, together with the octapeptide motif, has also been shown to be the minimal portion necessary for transformation when fused to MLL a mouse model of the MLL/AF10
translocation (DiMartino et al., 2002). This region is conserved between human, Drosophila
C h a p t e r I - I n t r o d u c t i o n
Fig. 1.3.2b The various CALM/AF10 breakpoints: Different CALM/AF10 breakpoints in patients with leukemia (right panel) show no correlation with the phenotype of the leukemia (left panel). All fusions generate in-frame fusion products of CALM/AF10 and in some cases, the reciprocal AF10/CALM. The octapeptide motif is retained in all the CALM/AF10 fusions, whereas none of the fusions retain the entire intact zinc finger domain.
Most t(10;11)(p13;q14) fusions generate CALM/AF10 as well as the reciprocal
AF10/CALM transcripts, however AF10/CALM transcripts could not be detected in all leukemia samples (Carlson et al., 2000)indicating that it is probably the CALM/AF10 fusion transcript that directs the transformation process. Analysis of the breakpoint region in various t(10;11)(p13;q14) leukemias has shown three different breakpoints for CALM and four breakpoints for AF10 (Fig. 1.3.2b) with no noticeable correlation with the phenotype or outcome of disease (Bohlander et al., 2000). While the CALM gene is more or less completely retained, all breakpoints in AF10 lead to the partial or complete loss of the plant homeodomain (PHD) like zinc finger domain but retain the C-terminal octapeptide motif and the leucine zipper domains (Fig. 1.3.2b) and in all the different translocations, the open reading frames both of CALM and of AF10 are maintained (Kumon et al., 1999). Moreover, the CATS binding portion of CALM is retained in both CALM/AF10 as well as MLL/CALM
fusions (Archangelo, 2005).
2000) Moreover, the CALM/AF10 fusion event, like many translocations involving the MLL
proto-oncogene, has been found to be the sole genetic abnormality in acute undifferentiated or biphenotypic leukemias (Kumon et al., 1999) which will be described in some detail in the following chapter.
1.4
Acute biphenotypic leukemias
Leukemias are characterized as myeloid or lymphoid based on the expression on the surface of the blast cells, of lineage specific antigens. There is however, a small subset of rare leukemias, termed mixed lineage leukemias, acute undifferentiated leukemias or acute biphenotypic leukemias (ABLs) that present blasts with antigens specific to both lineages. (Altman, 1990; Bernier et al., 1995)
1.4.1
ABLs in humans:
ABLs in human patients are typically associated with a poor prognosis, reduced survival rate and a high incidence of relapse (Sulak et al., 1990) These leukemias account for 3-7 % of all acute leukemias and 10-25% of pediatric acute leukemias (Altman, 1990; Sulak et al., 1990) Most of the acute biphenotypic leukemia blasts coexpress surface markers of B-myeloid characteristics and less often a T-myeloid phenotype (Matutes et al., 1997). It is widely suspected that the incidence of promiscuous leukemias is much higher than is currently reported due to the lack of a consistent approach of defining promiscuity, the classification of leukemias on the basis of a limited set of diagnostic criteria as well as the inherent heterogeneity amongst this unique entity of leukemias. The presence of lymphoid specific genomic rearrangements in myeloid leukemias (Schmidt et al., 1995; Williams and Moscinski, 1993; Yen et al., 1999) might represent previously undetected promiscuity (Grimwade et al., 2002).1.4.2
ABL models in mice
: To our knowledge there are few murine models that present blasts with biphenotypic features, the prominent example being a murine model of theC h a p t e r I - I n t r o d u c t i o n
Gurevich et al. reported the appearance of the B cell specific antigen B220 on the cell surface of myeloid blasts in a subset of terminally ill mice transplanted with the NUP98/TOPOII fusion gene (Gurevich et al., 2004).
1.4.3 Theories explaining biphenotypic character in ABL:
Twoalternative explanations have been proposed for the presence of biphenotypic cells and there has been considerable debate as to which is the valid explanation for the coexpression of dual markers in these leukemias, though most investigators agree that these two mechanisms might both be possible and furthermore, need not be mutually exclusive. The mechanisms are termed lineage infidelity and lineage promiscuity.
1.4.3.1 Lineage infidelity: This theory proposes that the coexpression of myeloid and lymphoid markers is a spurious result of malignancy as transformed cells from one lineage express cell surface markers of another lineage aberrantly due to the transformation event (McCulloch, 1987)
1.4.3.2 Lineage promiscuity: This theory states that a normal myelo-lymphoid cell or a cell with bilineage potential is the target in biphenotypic leukemias and the biphenotypic character of the blasts reflect differentiation block at this normal biphenotypic stage. (McCulloch, 1987)
The relatively low survival rate as well as the high incidence of relapse in patients with biphenotypic leukemia argues for a more primitive target cell for the disease, strengthening the lineage promiscuity theory. Indeed, Chi Wai So and colleagues demonstrated that the transformation of a normal biphenotypic multipotent progenitor but not lineage committed progenitors could give rise to an acute biphenotypic leukemia in mice (So
1.4
Mouse models of leukemia
Several mouse model systems have emerged that are likely to provide powerful means for the analysis of leukemias. These include ubiquitous or conditional knock-ins, targeted and random in vivo gene disruption and retrovirally transduced bone marrow transplantation into irradiated recipients. The murine bone marrow transplantation model employs ex vivo
retroviral gene transfer of primary hematopoietic cells followed by transplantation into lethally irradiated syngenic mouse recipients. Studies including those in our laboratory have demonstrated that proto-oncogenes (Rawat et al., 2004) and proto-oncogene combinations (Kelly et al., 2002; Schessl C, 2005) can induce acute leukemias in mice using this model and importantly, the characteristics of disease in such models appear to recapitulate human leukemia. For example, infection of bone marrow cells with a retroviral vector expressing the
C h a p t e r I - I n t r o d u c t i o n
1.6
Aim of the study
2.1
Mice and related reagents and equipment:
Avertin solution: Stock solution was prepared by adding 15.5 ml tert-amyl alcohol to 25 grams Avertin (2-2-2 Tribromoethanol), both procured from (Sigma-Aldrich, St. Louis, MO) and dissolved overnight. For working solution, 0.5 ml stock solution was added to 39.5 ml of cell culture grade phosphate buffered saline (PBS) and dissolved with a magnetic stirrer.
5-Fluorouracil: 50 mg/ml stock solution Medac, Hamburg, Germany. Working solution was 6 ml of the above solution mixed with 4 ml of phosphate buffered saline.
Formalin: 10% solution of formaldehyde (Sigma-Aldrich, St. Louis, MO) in water.
Sterile Syringes: BD Plastipak 1 ml syringe (BD Biosciences, Palo Alto, CA) for injection of cells in mice and Kendall Monoject 3 ml syringes (Tyco Healthcare, UK) for bone marrow flushing and plating of CFCs. The stubs of 3 ml syringes were used to macerate the spleens of mice.
Sterile needles: 0.5 x 25 mm for injection of cell in mice i.v. and 0.55 x 25 mm (BD Microlance, Drogheda, Ireland) for bone marrow aspiration from living mice and flushing of bone marrow from extracted bones. 16 x 1.5 inch needles for dispensing and plating Methocult (CFC) media (Stem Cell Technologies, Vancouver, Canada)
Erythrocyte lysis buffer: 0.8% NH4Cl with 0.1 mM EDTA (Stem Cell Technologies,
Vancouver, Canada)
Heparinized capillaries: (Microvette CB 300) plastic capillaries for collection of blood, 15 I.E Lithium heparin per ml of blood (Sarstedt, Numbrecht, Germany)
C h a p t e r I I - M a t e r i a l s
2.2
Mammalian cell lines:
GP+E86: Mouse fibroblast cell line
293T: Human embryonic kidney cell line
NIH-3T3: Mouse fibroblast cell line
All cell lines were procured from the American Type Culture Collection (ATCC), Manassas, U.S.A
2.3
Oligonucleotides:
All nucleotides were synthesized by Metabion AG, Martinsried, Germany.
Primers for transcriptional profile analysis
Oligonucleotide Sequence 5´ to 3´
Pax5_fw AGGATAGTGGAACTTGCCCA
Pax5_rev TGATGGAGTATGAGGAGCCC MPO_fw ACTGGCCTCAACTGCGAGAC MPO_rev GTGTATTGACAGCCAGCAGC Gata2_fw GACTATGGCAGCAGTCTCTTCC Gata2_rev GGTGGTTGTCGTCTGACAATT Gata3_fw TCGGCCATTCGTACATGGAA Gata3_rev GAGAGCCGTGGTGGATGGAC EBF_fw GCCCGTGGAGATTGAGAGGAC EBF_rev GTGCTTGGAGTTATTGTGGAC
c-fms_fw (MCSF-R) GAGTCAGAAGCCCTTCGACAAA
c-fms_rev (MCSF-R) TGCCCAGACCAAAGGCTGTAGC
Pu.1_fw TGGAGGTGTCTGATGCAGAAG Pu.1_rev CCGCTGAACTGGTAGGTGA GCSF-R_fw TACCAGCCACAGCTCAAAGG GCSF-R_rev ACGTGTCCAGTCTGATGGTG Aiolos_fw ATCGAAGCAGTGCCGCTT
CALM/AF10 sequencing primers
Oligonucleotide Sequence 5´ to 3´
CALM/AF10_seq_1f CTCGAGGTCGACGGTATCG
CALM/AF10_seq_ 2f AACACGTTGTTTAACTTAAGCAA
CALM/AF10_seq_ 3f CTTGACATCTATAAGAAGTTCC
CALM/AF10_seq_ 4f CCTCATACCTCTTTAACAACTG
CALM/AF10_seq_ 5f CATTTCTTCAGATGTATCTACTT
CALM/AF10_seq_ 6f GAAATGGAACCACTAAGAATGATG
CALM/AF10_seq_ 7f CCCCATAAGGATGGAGCTTTAA
CALM/AF10_seq_ 8f CC GATAATGTCCAATACTGTG
CALM/AF10_seq_ 9f TCAGCTCACAGCTCAGGTC
CALM/AF10_seq_ 10f GTACCTTAATTGGCCTCCCT
CALM/AF10_seq_ 11f TTTACAGAGCCTCAGTGTTG
CALM/AF10 _seq_12f CTCTCAGTCAGGCACCATC
CALM/AF10_seq_ 13f AAAACCGAAGATTAGAGGAAC
CALM/AF10_seq_ 14f GTCAATGGCGTGACAGTGGG
CALM/AF10_seq_ 15f ACTTCAGCAGCTGCAGATCC
CALM/AF10_jn_fw ACCCCCTGTAATGGCCTATC CALM/AF10_jn_rev AGTGGCTGCTTTGCTTTCTC
Cloning primers for CALM/AF10 mutants
Oligonucleotide Sequence 5´ to 3´
Leuziptagrev_framec GCCCTCGAGCACTGAAAGCTGTGCATTCAA Oct+leu_neu_fw CCGCTCGAGCCTCCAGTAGCAGCCAGC
AF10_por2_rev_tag CGCTCGAGGATGTTTCTCAGGTGTAAACTT CA_dellzip_neu_fw CGGATCGATCCTTTTCCAACAATAAC Calm_only_nonstop_rev CCGCTCGAGCTGTGCTCCTGATACAGGGC Calm_only_rev CCGCTCGAGCTACTGTGCTCCTGATACAGGGC CA_por1_rev CGCTCGAGCCATCGATGCTGGATGCTACTGGAG
Primers for V-DJH and DJH recombination
Oligonucleotide Sequence 5´ to 3´
VH 7183 CGGTACCAAGAASAMCCTGTWCCTGCAAATGASC
VH 558 CGAGCTCTCCARCACAGCCTWCATGCARCTCARC
VH Q52 CGGTACCAGACTGARCATCASCAAGGACAAYTCC
JH 3 GTCTAGATTCTCACAAGAGTCCGATAGACCCTGG
C-mu-5’ TGGCCATGGGCTGCCTAGCCCGGGACTT C-mu-3’ GCCTGACTGAGCTCACACAAGGAGGA
B rec chk fw1 ACGTCGACTTTTGTSAAGGGATCTACTACTGT
B rec chk fw2 ACGTCGACGCGGASSACCACAGTGCAACTG
C h a p t e r I I - M a t e r i a l s
2.4
Plasmids:
MSCV-IRES-GFP: A modified form of the MSCV vector, it contains a bicistronic GFP expression cassette with an internal ribosomal entry site.
Ecopac: A packaging vector coding for the gag, pol, and env viral proteins. (Clontech, Palo Alto, CA)
pCDNA6/V5-His A vector: Mammalian expression vector used for tagging proteins at the carboxyterminal end with the polyhistidine epitope tag (Invitrogen, Carlsbad, CA)
pEYFP-C1: Mammalian expression vector used for tagging genes with fluorescent reporter (Invitrogen, Carlsbad, CA)
2.5
Antibodies:
Name Company
Label
Dilutions
used
Gr-1 BD Pharmingen, Heidelberg PE/APC 1:500
CD11b (Mac1) BD Pharmingen, Heidelberg PE/APC 1:800
Sca-1 BD Pharmingen, Heidelberg PE 1:150
Ter119 BD Pharmingen, Heidelberg PE 1:150
B220 BD Pharmingen, Heidelberg PE/APC 1:200
CD4 BD Pharmingen, Heidelberg PE 1:150
CD19 BD Pharmingen, Heidelberg PE 1:200
CD23 BD Pharmingen, Heidelberg PE 1:200
CD24 BD Pharmingen, Heidelberg PE 1:200
CD43 BD Pharmingen, Heidelberg PE 1:200
sIgM BD Pharmingen, Heidelberg PE 1:200
CD117 (c-kit) BD Pharmingen, Heidelberg APC 1:500
CD8 BD Pharmingen, Heidelberg APC 1:150
CALM/AF10S19 Santa Cruz Biotech. Inc., CA - 1:1000
CALM/AF10G17 Santa Cruz Biotech. Inc., CA - 1:1000
CALM/AF10C18 Santa Cruz Biotech. Inc., CA - 1:1000
GFP Molecular Probes Inc., OR - 1:5000
Anti-His Invitrogen, Carlsbad, CA HRP 1:3000
Goat Anti-Mouse Invitrogen, Carlsbad, CA HRP 1:2000
2.6
Reagents, media and apparatus:
2.6.1: Molecular biology:
Agarose: Molecular biology tested (Sigma-Aldrich, St. Louis, MO)
Protamine sulfate: (Salamine) from Salmon, cell culture tested (Sigma-Aldrich, St. Louis, MO) 5 mg/ml stock solution
DNeasy mini kit: Genomic DNA extraction kit for small cell numbers (Qiagen GmbH, Hilden, Germany)
Small-scale plasmid preparation: GFX miniprep kit for isolation of plasmid DNA from bacteria (Amersham Biosciences GmbH, Freiburg, Germany)
Gel Elution of DNA and PCR or DNA cleanup: GFX gel elution and PCR purification kit for DNA elution from gels and clean up of PCRs (Amersham Biosciences GmbH, Freiburg, Germany)
C h a p t e r I I - M a t e r i a l s
Pre-hybridisation solution: 0.2 g skimmed milk and 2.0 g dextran sulphate were dissolved in 17 ml water and 6ml 20 X SSC, 2 ml formamide, 1 ml 20% SDS and 80 µl 500 mM EDTA were added to the mixture. (All chemicals were individually obtained from Sigma-Aldrich, St. Louis, MO)
Denaturation solution:A solution of1.5 M NaCl, 0.5 N NaOH in water.
20 X SSC: 175.3 g sodium chloride and 88.2 g sodium citrate were dissolved in 800 ml deionised water and pH adjusted to 7.0 and the final volume to one litre.
DNA Crosslinking: GS Gene linker UV chamber (BIO-RAD Laboratories, Hercules, CA)
Western blot: ECL Western blotting analysis system (Amersham Biosciences GmbH, Freiburg, Germany)
Total RNA and genomic DNA isolation: Total RNA isolation reagent (TRIZOL) and
Genomic DNA isolation reagent DNAZOL (Invitrogen, Carlsbad, CA)
Molecular weight markers: Nucleic acid size standards, 1 kb ladder, 1 kb plus ladder and 100 bp ladder (Invitrogen, Carlsbad, CA)
Enzymes: Ligase, Calf intestine phosphatase, Xho I, Cla I, Eco RV, Eco RI, Hpa I, and Pme I
all from New England Biolabs (NEB, Beverly, MA)
RT and PCR: Platinum Taq DNA polymerase kit, ThermoScript kit, RT-PCR kit and
DNaseI DNA inactivating enzyme kit (all from Invitrogen, Carlsbad, CA) PCR soft tubes (0.2 ml) (Biozym Scientific GmBH, Hess.Oldendorf, Germany)
Real time PCR kit: LightCycler FastStart DNA Master SYBR green I kit (Roche
Diagnostics, Mannheim, Germany) LightCycler Carousel and carousel centrifuge (Roche Diagnostics, Mannheim, Germany)
2.6.2: Cell and tissue culture:
Methylcellulose media: Methocult 3434 for the culture of myeloid CFC assays and Methocult 3630 for the pre-B CFC assays (Stem Cell Technologies, Vancouver, Canada).
Filtration units: Millex syringe driven filter units 0.22 μm and 0.45 μm filters (Millipore, Billerica, MA)
Cell strainer: BD Falcon 40 μm Nylon strainer for macerating the spleen and filtering the tissue (BD Biosciences, Palo Alto, CA)
Cell Scrapers: 25 cm sterile cell scrapers (Sarstedt, Newton, NC)
Cell culture pipettes (2, 5, 10 and 25 ml): Sterile disposable pipettes (Corning Inc., Corning, NY)
Cell culture plates and dishes: Sterile 96 well, 24 well, 6 well plates (Sarstedt, Numbrecht, Germany) 100 mm x 20 mm dishes for adherent cells (Corning Inc., Corning, NY), and Petri dishes for suspension cells (Becton Dickinson Labware, Franklin Lakes, NJ) 150 mm x 20 mm dishes for adherent cells (Greiner Bione, Frickenhausen, Germany)
Calcium Chloride solution for transfection: 2.5 M CaCl2 (Sigma-Aldrich, St. Louis, MO)
solution in water.
Hepes Buffered Saline: (HBS) (Invitrogen, Carlsbad, CA)
Media: Dulbecco’s Modified Eagle’s Medium (DMEM) 4,5 g/l glucose, l-glutamine, sodium pyruvate and 3,7 g/l NaHCO3 (PAN biotech GmbH, Aidenbach, Germany)
C h a p t e r I I - M a t e r i a l s
Dulbecco’s phosphate buffered saline (DPBS): without magnesium and calcium, sterile filtered (PAN biotech GmbH, Aidenbach, Germany)
Trypsin – EDTA: 1 X in HBS without calcium and magnesium with EDTA (Invitrogen, Carlsbad, CA)
Penicillin/Streptomycin: Antibiotic solution with 10,000 u/ml Pen G sodium and 10,000 μg/ml Streptomycin sulfate in 0,85% saline. Used 5 ml per 500 ml medium bottle (Invitrogen, Carlsbad, CA)
Murine cytokines: mIL3, mIL6, mSCF, mG-CSF, mM-CS and mGM-CSF (lyophilized)
(Tebu-bio, Offenbach, Germany)
Ciprofloxacin: Ciprofloxacin 400 solution, (Bayer AG, Leverkusen, Germany)
2.6.4: Miscellaneous:
Giemsa: Giemsa’s Azure Eosin Methyleneblue solution modified.(Merck KGaA, Darmstadt, Germany)
May-Gruenwald: May-Gruenwald’s Eosin Methyleneblue solution for microscopy (Merck KGaA, Darmstadt, Germany)
Cytospin apparatus: Cytospin 2 Shandon Apparatus (Thermo Electron corporation, U.S.A)
Cytospin slides: Marienfield pre-cleaned twin frosted slides for fixing single cell suspensions and blood smears (Marienfield, Lauda-Königshofen, Germany)
Flow cytometry: BD FACS Calibur System (BD Biosciences, Palo Alto, CA)
Fluorescence Activated Cell Sorting: BD FACSVantage SE System (BD Biosciences, Palo Alto, CA)
Sequencing mix and apparatus: BigDye Terminator v1.1 Cycle Sequencing Kit and the ABI Prism 310 Genetic Analyzer (Applied Biosystems, Foster City, CA)
Microscope: Leitz Diavert Inverted Microscope (Ernst Leitz Wetzlar GmBH, Wetzlar, Germany)
2.6.5 Software:
C h a p t e r I I I - M e t h o d s
3.1
Cloning of constructs:
The 5.2 kb full length CALM/AF10 fusion gene initially cloned from the U937
monocytic cell line was sub-cloned by blunt end ligation into the Hpa I site in the multiple
cloningsite (MCS) of the modified murine stem cell virus (MSCV) 2.1 vectorupstream of the internal ribosomal entry site (IRES) and the enhanced GFP fluorescent protein gene. The
CALMΔ3’ mutant was cloned by ligating a PCR amplified (primers: Calm_only_fw and
Calm_only_nonstop_rev) 2 kb fragment of the truncated CALM gene in frame to the
polyhistidine epitope of the pCDNA6/V5-His A plasmid. For the CALM/OM-LZ mutant, a
PCR amplified 200 bp fragment (primers: Oct+leu_neu_fw and Leuziptagrev_framec) encoding the AF10 octapeptide motif (OM) and the leucine zipper (LZ) was cloned in frame
into the Xho I site at the 3’ end of the CALMΔ3’ construct, also in frame to the polyhistidine
tag. The CALM/AF10 ΔOM-LZ mutant was constructed in two steps; first by ligating a
portion of PCR amplified DNA (primers: Calm_only_fw and CA_por1_rev) from the start of
CALM/AF10 till the octapeptide motif of the AF10 gene by an Eco RV-Xho I digestion into
the pCDNA6/V5-His A vector. A Cla I site was introduced in frame with the cDNA just
before the 3’ end of the reverse primer before the XhoI site. In the second step a PCR amplified Cla I-Xho I fragment of the remaining portion of AF10 after the leucine zipper
(primers: CA_dellzip_neu_fw and AF10_por2_rev_tag) was inserted into the Cla I-Xho I
digested first clone. Cla I and Xho I were inserted into the 5’ and 3’ regions of the primers
3.2
Preparation of high titre stable virus producing cell lines:
1.5x 10⁶ 293T cells were plated in a 15 cm dish and on the following day used for transient transfection. Medium was changed 4 hours prior to the transfection and 30 μg plasmid DNA each of the gene of interest and of the retroviral packaging construct Ecopac were added to sterile water and a sterile solution of 100 μl 2.5M CaCl2 was added drop wise
to the water-DNA mixture. The volume of water added initially was calculated so as to make the total volume 1 ml. This was added slowly to a tube containing 1 ml sterile Hepes buffered saline solution (pH 7.2). After gentle mixing and incubating at room temperature for 3-4 minutes, this mixture was added drop wise to the medium covering the whole plate and without agitating the cells. The medium was changed the next day and supernatant was collected from the cells every 12 hours (thrice totally) and fresh medium added. This supernatant was filtered with a 0.45 mm Millipore filter and stored as VCM at –80° for later use or used directly to transduce GP+E86 fibroblasts or murine bone marrow.
5x 10⁴ GP+E86 fibroblasts were plated into 6 well plates one day prior to transduction. The next day, medium was withdrawn from these cells and 500 μl or 1 ml of fresh or frozen VCM was layered on top of the cells with the addition of a final concentration of 10 μg/ml protamine sulfate. Fresh medium was added after 4 hours and the transduction procedure was repeated every 12 hours for three-four times. The cells were expanded and two days were allowed for GFP expression. Green fluorescent cells were sorted using the fluorescence activated cell sorter (FACS) sorter, propagated and used as stable virus producing cell lines to transduce murine bone marrow. Using these protocols,
CALM/AF10/GFP, only GFP, ΔCALM/GFP, CALM+LZ/GFP, or ΔLZ/GFP GP+E86 cell
lines were constructed and used for experiments.
In some cases where viral titres of bulk cell lines were low, single cells were sorted into 96 well plates and after expansion their viral titres determined on NIH-3T3 cells. Clones producing highest titres were expanded, frozen and used for experiments.
Titration was performed by plating 2 x 10⁵ NIH3T3 cells per well in 6 well plates and layering them with 500 μl VCM the next day with the addition of a final concentration of 10
C h a p t e r I I I - M e t h o d s
3.3
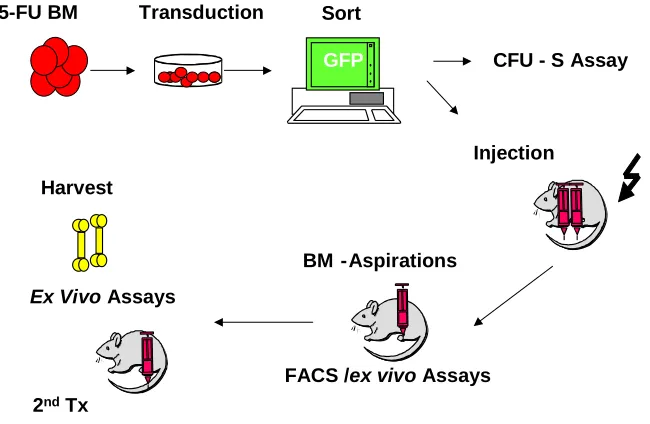
Retroviral transduction of primary bone marrow:
Bone Marrow Transplantation Model
Injection
Ex Vivo Assays
2ndTx
BM -Aspirations
FACS /ex vivo Assays Harvest
5-FU BM Transduction Sort
GFP CFU - S Assay
Fig. 3.3a Experimental design of bone marrow transplantation of CALM/AF10 and control mice
Parental strainmice were bred and maintained at the GSF animal facility. The mice were fed with autoclaved chow and supplied with drinking water containing ciprofloxacin and acetic acid and housed in individually vented cage systems. Donors of primary BM cells were > 8-wk-old (C57BL/6Ly-Pep3b x C3H/HeJ) F1 (PepC3) mice. 150
transduction for two days, bone marrow was removed gently but completely without disturbing the adhered monolayer of the GP+E86 cell line. Bone marrow was cultured in DMEM 15% FBS and 2 more days were allowed for GFP expression. On day 7, GFP positive cells were sorted by FACSVantage and used for bone marrow transplantation or for in vitro
culture. Bone marrow was always cultured in DMEM 15% FBS medium supplemented with 10 ng/ml mIL-6, 6 ng/ml mIL-3 and 100 ng/ml murine stem cell factor.
3.4
Bone marrow transplantation and assessment of mice:
BM cells Gene transfer
GFP CALM/AF10
GFP N=6
Sort
Experimental Design
CALM/AF10 N=13
Fig. 3.4 a Experimental design of bone marrow transplantation of CALM/AF10 and control mice
This is a representation of the experimental set of mice from the CALM/AF10 and the
MSCV-IRES-GFP arms. A total of 13 mice were injected with bone marrow cells transduced with CALM/AF10 and
six mice with the bone marrow cells transduced with the empty vector.
Recipients were > 8- to 12-wk-old (C57BL/6J x C3H/HeJ) F1 (B6C3) mice.
C h a p t e r I I I - M e t h o d s
for signs of leukemic symptoms by blood withdrawal from the tail vein using sterile scalpels and bone marrow aspiration from the tibia of anaesthetised animals or by the observance of symptoms that included crouching, frizzled body hair, paleness in the feet, heavy breathing and disturbed gait. Mice were considered moribund when one of these symptoms was starkly visible.
Expt. no Gene Transduced cells Mock cells
3493b CALM/AF10 200000 200000
3493b CALM/AF10 200000 200000
3493b CALM/AF10 200000 200000
3493b CALM/AF10 400000 0
3493b CALM/AF10 400000 0
3515 CALM/AF10 200000 200000
3515 CALM/AF10 200000 200000
3515 CALM/AF10 200000 200000
3521 CALM/AF10 100000 300000
3724 CALM/AF10 100000 250000
3724 CALM/AF10 100000 250000
3724 CALM/AF10 100000 250000
3746 CALM/AF10 50000 100000
3493a GFP 400000 0
3493a GFP 400000 0
3493a GFP 400000 0
Fig. 3.4 b Injection of transduced and mock transduced bone marrow in CALM/AF10 and MSCV-IRES-GFP mice
This is a schematic representation of the number of cells injected and the respective amount of mock transduced added for transplantation into each mouse. Mock transduced cells were cells sorted from the same sample but negative for GFP expression. For secondary and tertiary mice, 1x 10⁶ bone
addition, to each mouse, of 1x 10 bone marrow cells from a syngenic wild type mouse (non-transduced mock cells).
Moribund mice were sacrificed by CO2 asphyxiation and bone marrow was
aspirated as described before. Spleens were dissected and macerated to produce single cell suspensions and peripheral blood was drawn with a sterile 0.5 x 25 mmneedle by puncturing the heart immediately after sacrificing the mice. Red blood cell (RBC) lysis for peripheral blood, bone marrow and spleen cells was performed by incubating the cells in ammonium chloride buffer for 10 minutes at room temperature.
3.5
FACS analysis of murine cells:
Single cell suspensions of cells were immunostained with various conjugated antibodies. Staining was performed in PBS with the fluorescence-conjugated antibodies using a 1: 200 dilution for each antibody. Samples were incubated at 4°C for 20 minutes and subsequently washed with PBS to remove excess antibody. Cells were centrifuges and after decanting the supernatant, resuspended in FACS buffer (2% fetal bovine serum and 2 μg/ml propidium iodide in phosphate-buffered-saline). Antibodies used for FACS were labelled with phycoerythrin for Gr-1, CD11b (Mac1), Sca-1, Ter119, CD4, CD19, CD23, CD24, CD43, sIgM, F4/80 and allophycocyanin conjugated CD11b (Mac-1), CD117 (c-kit), B220, and CD8. Fluorescence was detected using a FACSCalibur flow cytometer and analyzed using the CellQuest software. Dead cells were gated out by high PI staining and forward light scatter.
3.6
Ex Vivo proliferation and CFC Assays:
C h a p t e r I I I - M e t h o d s
supplemented with cytokines (Methocult M3434) or pre-B cell assays (Methocult M3630). Replating was performed every week in appropriate dilutions.
IL-3-dependent cell populations expressing CALM/AF10 were established in
vitro directly after sorting in DMEM 15% FBS with IL-3 alone (6 ng/ml). Single cell lines
were generated by sorting these cells into 96 well plates using the BD FACS Vantage in 200
μl DMEM 50% FBS and 6 ng/ml IL3. After 2 weeks individual wells were assessed for growth and growing cells expanded as single cell clones.
The differentiation capacity of cultured cells was tested in DMEM 15% FBS supplemented with granulocyte colony-stimulating (G-CSF) factor 100 ng/ml or macrophage colony-stimulating factor (M-CSF) 10 ng/ml. After 5 days, the morphology was determined by Wright–Giemsa stained cytospin preparations.
3.7
Cytospin preparations and Wright Giemsa staining:
Cytospins of single cell suspensions were performed by resuspending cells in PBS at a concentration of 2-6x 10⁵ cells per 200 μl and this volume was introduced into the cytospin apparatus. The cells were permanently fixed on glass slides by centrifugation at 500 rpm for 10 minutes and subsequently air-dried. Modified Wright Giemsa staining was performed by immersing the slides in an undiluted solution of May-Grunwald stain for 5 minutes. This was followed by immersing the slides in 1:50 diluted Giemsa stain for 1 hour. Slides were dipped in water to remove excess stain between the two staining steps and after the staining procedure and air-dried for observance under the inverted light microscope.
3.8
Colony-Forming Unit–Spleen (CFU-S) Assay:
12 days Spleen
colonies
5 FU - BM Injection
Fig. 3.8a Schematic representation of the Colony Forming Units in Spleen Assay (CFU-S)
Primary BM cells from F1 (PepC3) donor mice that had been primed 5 days
previously with an i.v. injection of 150 mg/kg 5-fluorouracil were retrovirally transduced (as described in 3.3 and 3.4) with the different viruses and cells were highly purified based on expression of GFP by using a FACSVantage. Transduced cells were injected directly after sorting into lethally irradiated F1 (B6C3) recipient mice. The recovery of CFU-S cells was
quantifiedby determining the number of macroscopic colonies on the spleenat day 12 post-injection after immersion in Telleyesnickzky'ssolution.
3.9
Quantification of the Leukemia propagating cell
frequency:
B220APC+/Mac1PE- (B population), B220APC+/Mac1PE+ (BM population)
and B220APC-/Mac1PE+ (M population), cells were sorted from the flushed bone marrow of
a sacrificed primary CALM/AF10 mouse. The sort purity of these cells was checked with the
FACSCalibur and determined to be over 95%. Tenfold serial dilutions of these cells were injected intravenously (max. 5x 10⁵, min. 50 cells) into lethally irradiated secondary recipient mice as previously described (Section 3.4). 1x 10⁶ cells from a syngenic disease free mouse
C h a p t e r I I I - M e t h o d s
3.3). The frequency of leukemia propagating cells was calculated using the L-Calc limiting dilution analysis software.
3.10
RNA and genomic DNA isolation and cDNA preparation:
The Trizol method for RNA isolation described by the manufacturer was used to extract RNA with the addition of 1 ml of Trizol solution per million cells. Equal amounts of RNA as quantified by a spectrophotometer were added to each reaction (in a set) used for cDNA preparation for the semi-quantitative PCRs. Each sample was treated with DNaseI for prevention of genomic DNA contamination in cDNA samples. This was performed for each sample prior to cDNA preparation according to the manufacturer’s instructions.
Genomic DNA was isolated from a minimum of 1x 10⁷ cells for Southern blotting from various murine organ cells using the DNAZOL reagent and the protocol for the same according to the manufacturer. Genomic DNA for the V-DJ and D-J PCRs was isolated using the DNeasy mini kit using supplied methods. Genomic DNA was resuspended in sterile water and quantified using a spectrophotometer after proper dissolution.
cDNA was prepared from DNaseI treated RNA. First-strand cDNA synthesis was done with ThermoScript kit. In a 20 μl reaction volume, 1 μg RNA and 1 μg of oligo (dT) were mixed to a final volume of 11 μl and incubated 10 minutes at 70°C. Then, 4 μl of 5 X first-strand buffer, 2 μl of DTT 0.1 mol/L, 1 μl of 10 mmol/L deoxynucleoside triphosphate mix, and 2 μl of ThermoScript reverse transcriptase were added. The sample was incubated 1 hour at 42°C and used for PCRs.
3.11
Southern and Western (immuno) blotting:
3.11.1 Southern blot analysis:
fragment specific to the proviral integration site. To check the full-length integration, DNA was digested with Nhe I, which cuts in the long terminal repeats (LTRs) to release the proviral
genome. After digestion DNA was loaded on a 0.7% agarose gel with 0.5 ug/ml ethidium bromide. After electrophresis, the DNA was depurinated by soaking the gel in 0.2 N HCL for 8 minutes, and subsequently for 45 minutes in denaturation buffer. After denaturation, the DNA was transferred on zeta-Probe GT membrane by capillary action in a 10X transfer buffer. Cross-linking of the DNA with membrane was done by incubating the membrane at 150 mjoule in a UV gene linker. The probe used was a 700 bp GFP fragment, which was digested out from the pEGFP-C1 plasmid and labelled with α-32P dCTP using Megaprime
DNA labelling system. Probe was purified using Microspin S-300 HR columns. Hybridization was done with α-32P GFP labelled overnight at 620C. After two rounds of washing the membrane was dried, covered with a plastic film and put in a cassette for exposure of the film. The film was put on the membrane in a dark room and the exposure was done at variable exposing times between 48 hours and one week, depending on the visualization signal observed.
3.11.2 Western Blotting (Immunoblotting):
Sample preparation and cell lysis (total cell extract):
Proof of protein expression was performed using the 4D6 E86 CALM/AF10
cell line. The cells were lysed using 150 µl RIPA buffer with fresh added protease inhibitors and detached using a cell culture scraper. The cells with RIPA buffer were transferred to an
Eppendorf microcentrifuge tube and mixed by inversion for 30 minutes at 4°C. After the homogenization, the sample was centrifuged at 14000 rpm for 30 minutes at initialized. After centrifugation, the supernatant was transferred to a new Eppendorf tube and either frozen at
-80°C, or kept on ice for determination of protein concentration. As a control, 293T cells from an 80% confluent 15 mm cell culture dish (between 5 and 10x 107 cells) were transiently
transfected with 10 µg of pEYFP-CALM/AF10 DNA. Lysates were prepared using the